1934
Making Myelin Water Imaging Mainstream: Multi-site and Multi-vendor Reproducibility1Medicine, Neurology, University of British Columbia, Vancouver, BC, Canada, 2Electrical Engineering, Polytechnique Montréal, Montreal, QC, Canada, 3Pediatrics, University of British Columbia, Vancouver, BC, Canada, 4Radiology, University of British Columbia, Vancouver, BC, Canada, 5Physics and Astronomy, University of British Columbia, Vancouver, BC, Canada, 6Radiology, University of Manitoba, Winnipeg, MB, Canada, 7Electrical and Computer Engineering, Seoul National University, Seoul, Korea, Republic of
Synopsis
Myelin water imaging (MWI) is a quantitative T2 relaxation-based MRI technique, measuring the amount of myelin in the central nervous system. We investigated the reproducibility of MWI using GRASE with 3T MR scanners from two different vendors at two sites. Using stimulated echo correction, differences in the refocusing flip angle profile between the two sites were effectively corrected for and myelin estimates between the two sites were found to be highly correlated (slope=1.12, R2=0.96). This is the first multi-vendor and multi-site reproducibility study of MWI using GRASE, encouraging future multicenter MWI studies.
Introduction and Motivation
Myelin Water Imaging (MWI) is a quantitative T2 relaxation-based magnetic resonance imaging (MRI) technique1 that is a viable biomarker of myelin.2 To accelerate data acquisition in MWI, a combined gradient and spin echo sequence (GRASE) was introduced by Prasloski et al.3, allowing full brain coverage in less than 15min. As the utility of conducting multicenter studies using MRI increases, there is a need to evaluate the multisite and multivendor reproducibility of MWI. In this study, we evaluate the reproducibility of MWI using GRASE across two scan sites and scanner manufacturers for the first time.Methods
Data acquisition: One healthy volunteer (male, age 24) was scanned at two sites using 3T scanners from two different manufacturers, henceforth referred to as site 1 and site 2. MWI data were collected at both sites using a whole-brain 3D-GRASE sequence (32 echoes, TE/TR=10/1030ms, resolution=1.5x1.5x5mm3, SENSE=2 at site 1, partial k-space=6/8 at site 2).3 Two GRASE scans (without repositioning) were acquired at each site to assess intra-site reproducibility. A 3D-gradient echo T1-weighted scan (1x1x1mm3 resolution) was acquired site 1 for delineating regions of interest (ROIs).
Image analysis: MWI analysis was performed using a non-negative least squares algorithm, both with and without stimulated echo correction4 to obtain maps of the: myelin water fraction (MWF), the T2 time of intra-extra cellular water (IET2), and the estimated flip angle. Seven isolated white matter (WM) and gray matter (GM) ROIs were outlined on the structural 3DT1, and the MWF was averaged within each ROI. Linear regression was used to assess inter- and intra-site correlations in MWF. Full cerebrum WM masks were obtained from the 3DT1 using FSL FAST5, and histograms of the MWF and IET2 within the WM ROIs were calculated. All calculations using ROIs were performed in the native space of the quantitative map using linear registration from 3DT1 to the first echo of the GRASE. Unless explicitly stated, values for MWF and IET2 are obtained from analysis with stimulated echo correction. The signal-to-noise ratio (SNR) of the GRASE was calculated using the dual acquisition method on the first echo within each isolated ROI.6
Results
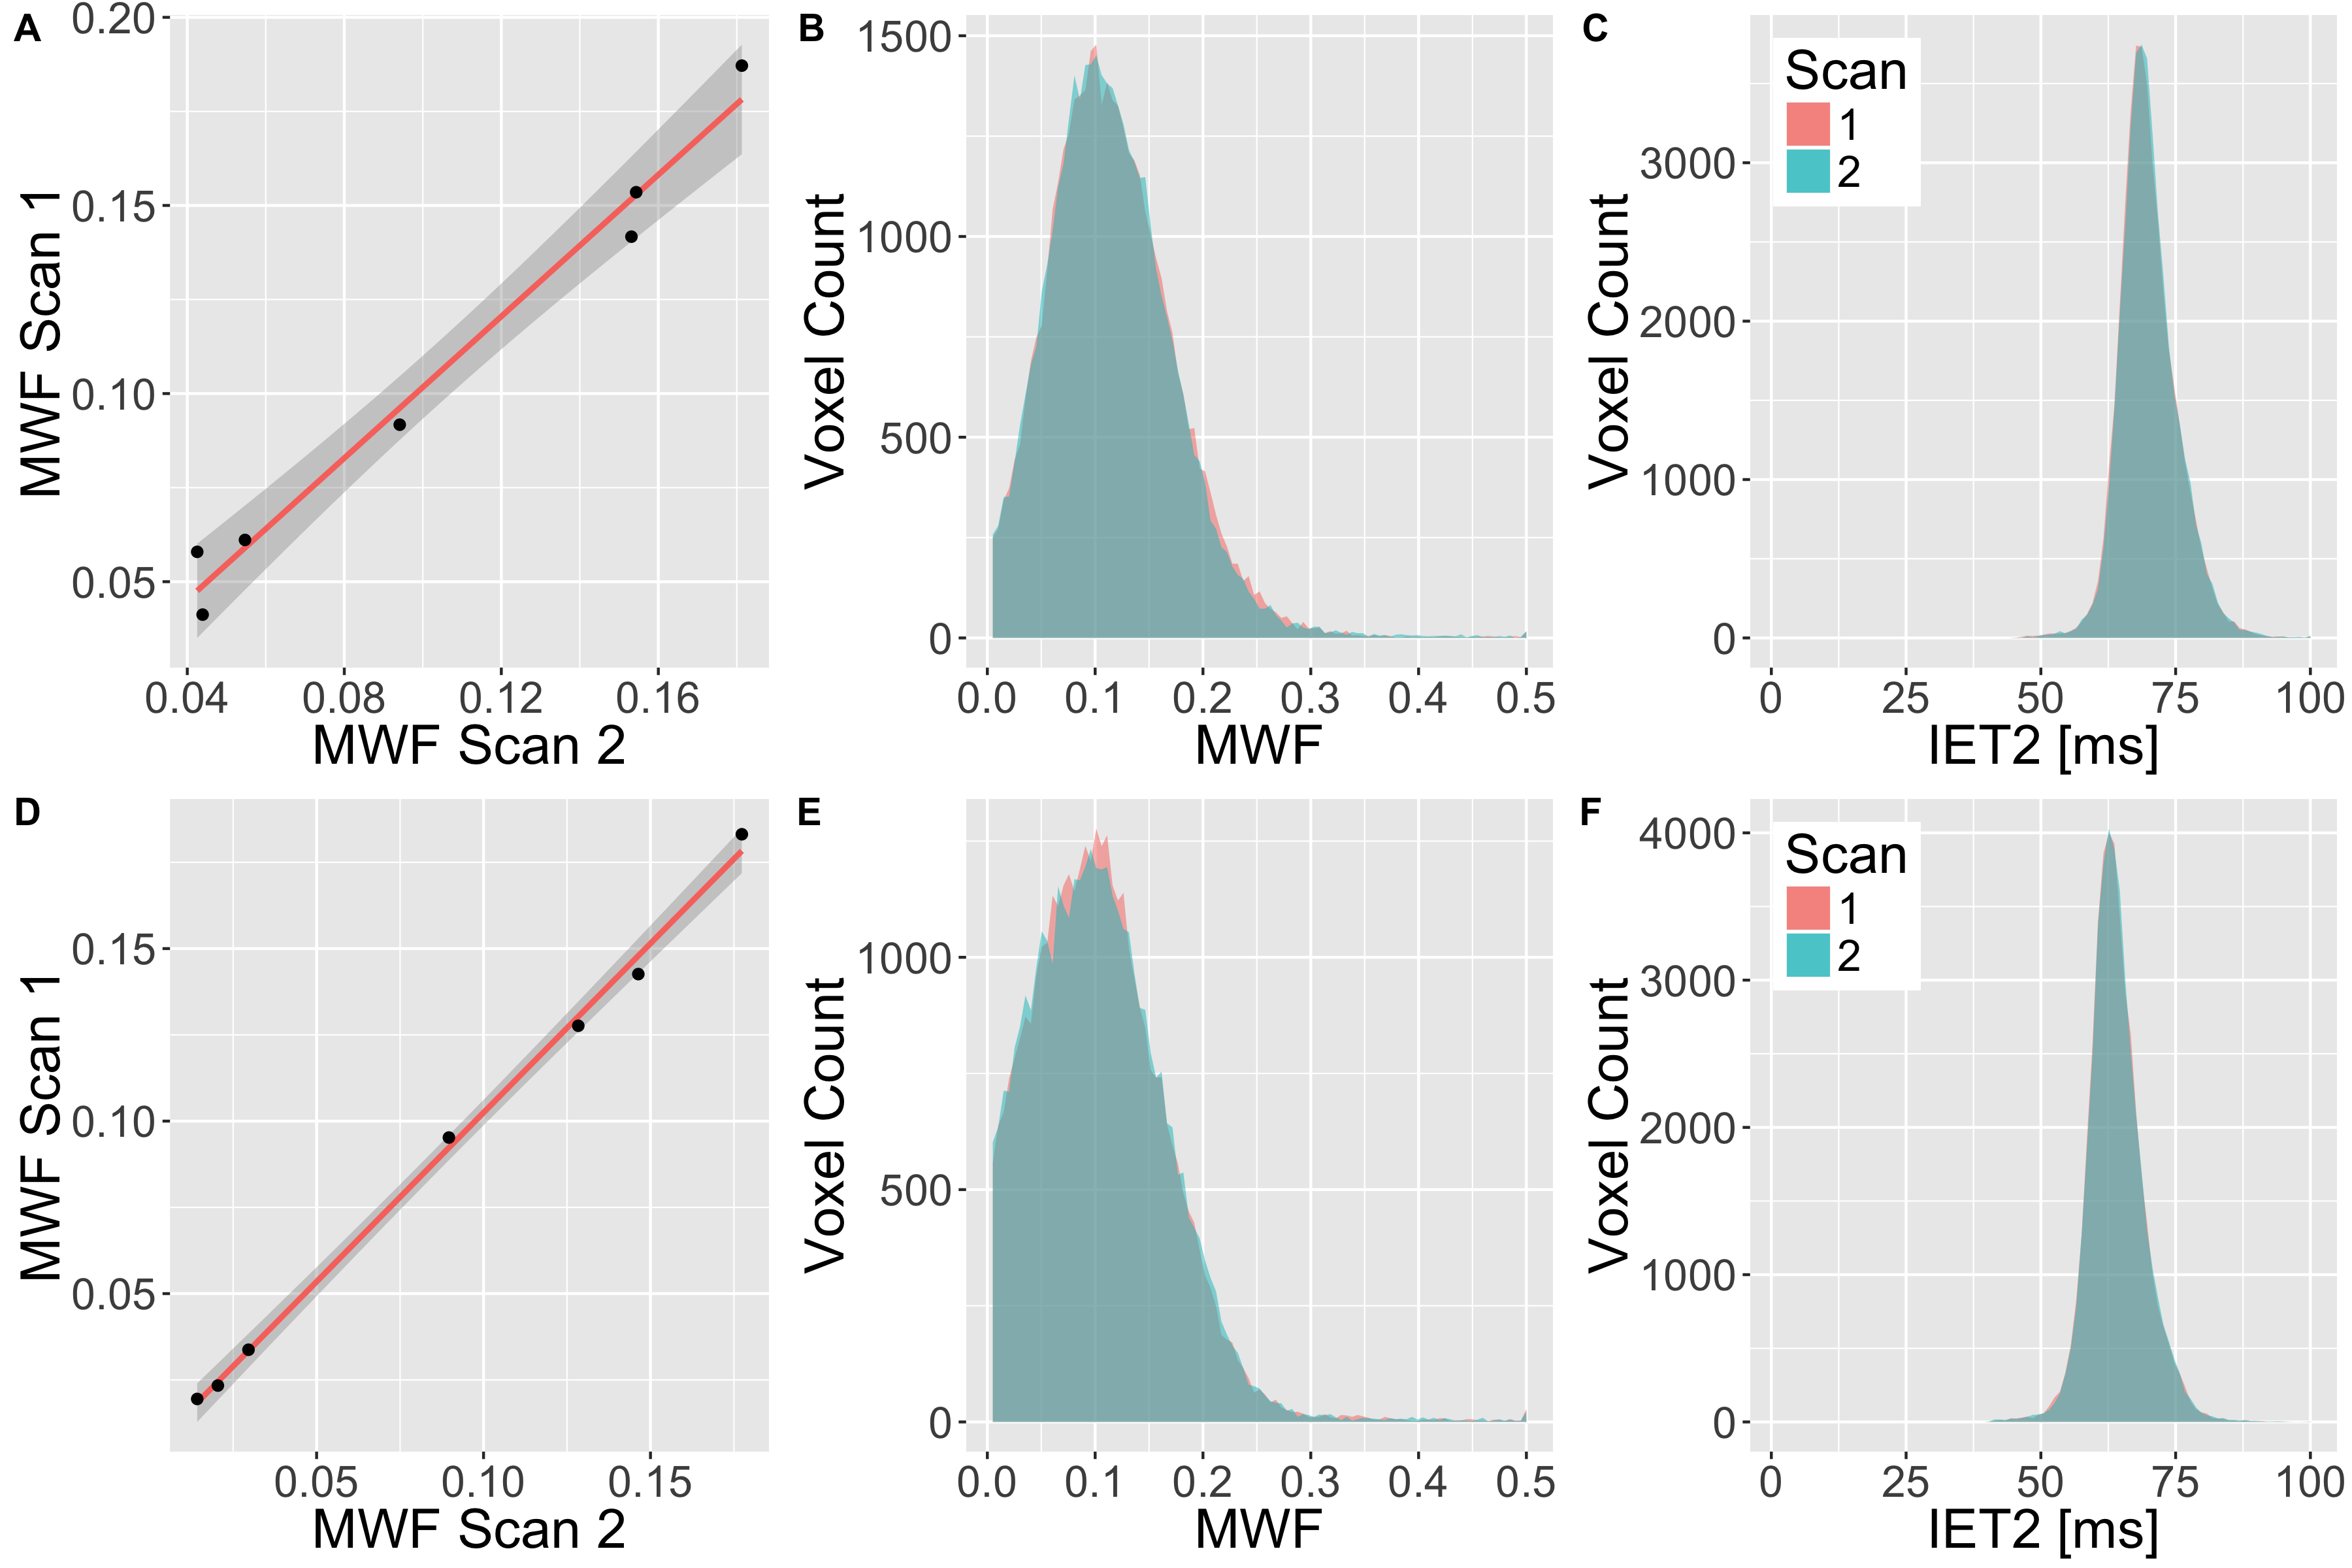
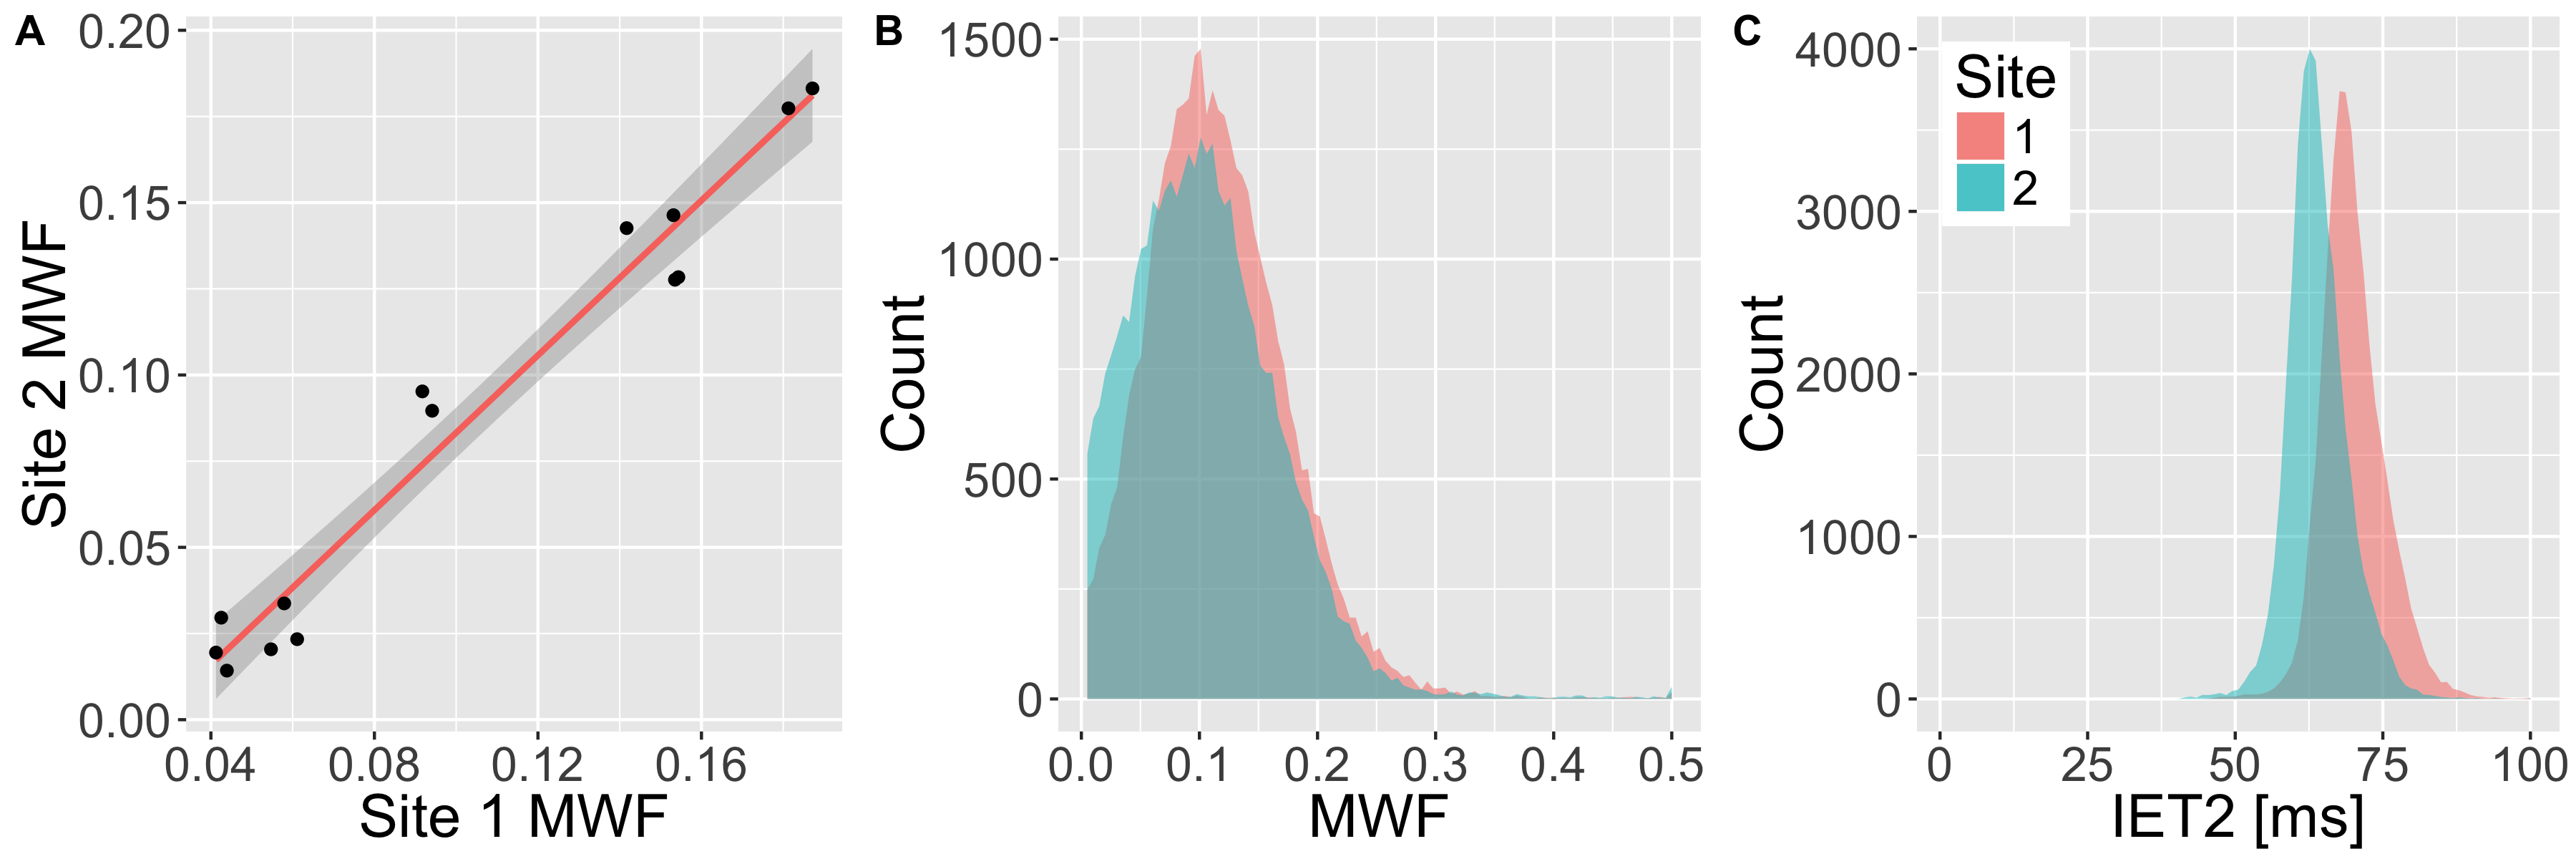
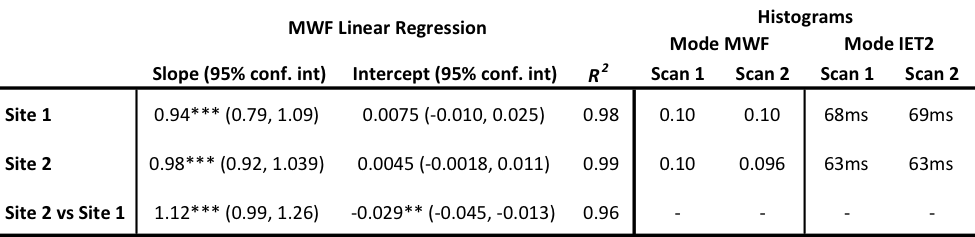
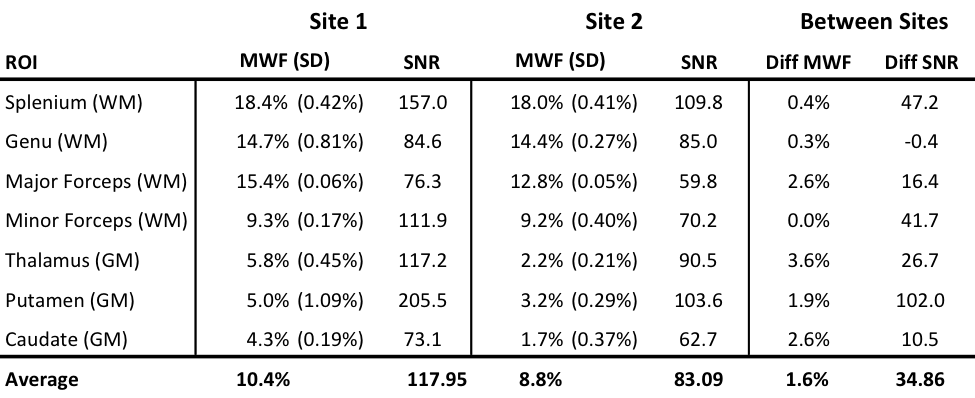
Intra-site reproducibility was found to be very good at both sites as shown by the linear correlations in Figure 1 and fit parameters in Table 1. This is further supported by the overlapping WM histograms for MWF and IET2 (Figure 1), and the small standard deviation of the MWF between the repeated scans at both sites (Table 2). Inter-site reproducibility was also found to be very high with slope=1.12 and R2=0.96 (Figure 2 and Table 1). Comparison of MWF histograms between sites shows a slight offset for lower MWF, but the modes are overlapping at MWF=0.1. The inter-site IET2 histogram (Figure 2) shows an overall shift towards lower T2 estimates at site 2 (63ms) compared to site 1 (68ms). MWF and SNR are tabulated in Table 2.
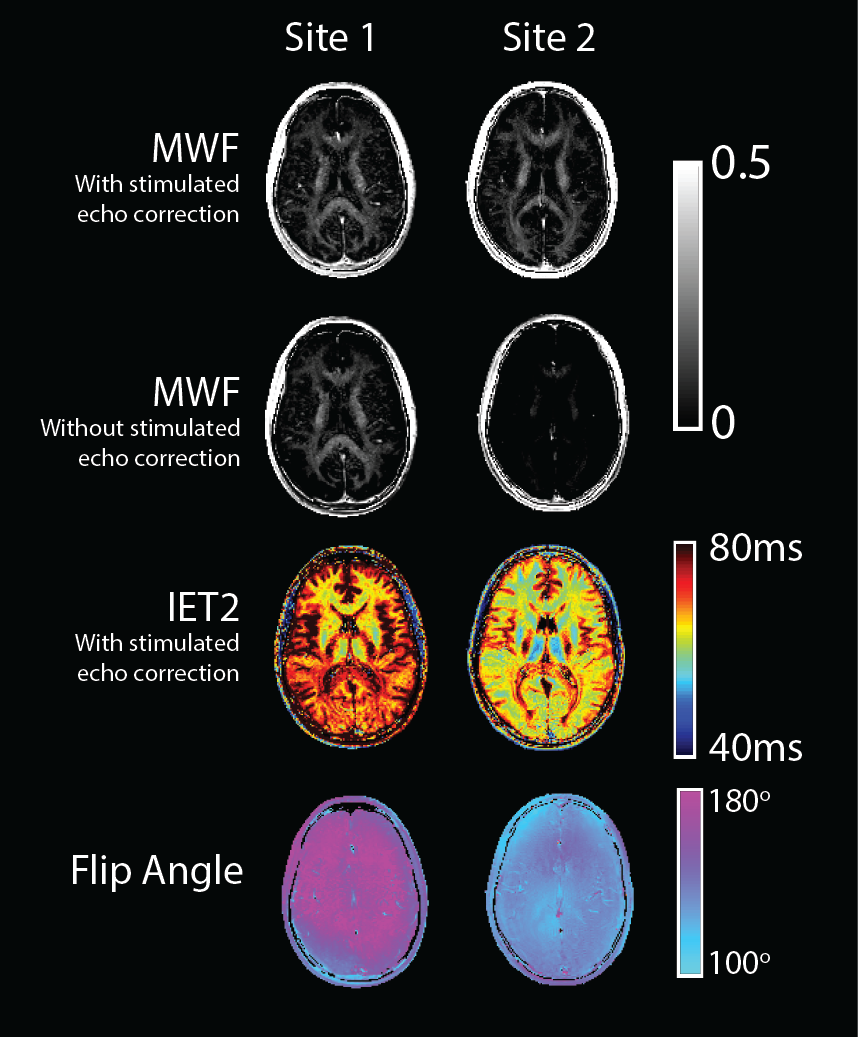
Qualitative
comparison of MWF and IET2 maps in Figure 3 shows a high degree of similarity.
From the flip angle map, it is evident that site 2 produced a consistently
lower flip angle. The second row of Figure 3 also shows that if stimulated echo
correction is not used, the MWF is drastically decreased for site 2, whereas
the MWF map from site 1 remains visually unchanged.
Discussion and conclusion
There is a strong linear correlation for the MWF between the two sites, and very similar overlapping WM histograms (Figures 1 and 2). However, MWF values tended to be slightly lower at site 2. This could be related to difference in SNR. Simulations in previous studies have shown that lower SNR leads to lower MWF values, which is consistent with the lower SNR values at site 2 (Table 2).7 The shift of the mode in the IET2 histogram between the sites is 5ms, which is unlikely to affect the MWF. More importantly, the similarity in shape of the histograms indicate comparable precision in the measurements.
In this study we have shown that significant differences in the estimated flip angle are effectively accounted for using stimulated echo correction as shown in Figure 3. These results are in line with previous studies showing the same behavior through simulations.4 A lower flip angle could be the source of lower SNR at site 2 as well. It is likely that future multicenter studies will have inter-site variability in the acquisition, and this work illustrates that with stimulated echo correction, this can be accounted for to produce comparable MWF maps between sites. These results should motivate future multicenter studies using GRASE for MWI.
Acknowledgements
This study was supported by the Milan & Maureen Ilich Foundation.References
1. Mackay A, Whittall K, Adler J, Li D, Paty D, Graeb D. In vivo visualization of myelin water in brain by magnetic resonance. Magn Reson Med. 1994;31(6):673–7.
2. Laule C, Kozlowski P, Leung E, Li DKB, MacKay AL, Moore GRW. Myelin water imaging of multiple sclerosis at 7T: Correlations with histopathology. Neuroimage. 2008;40(4):1575–80.
3. Prasloski T, Rauscher A, MacKay AL, Hodgson M, Vavasour IM, Laule C, et al. Rapid whole cerebrum myelin water imaging using a 3D GRASE sequence. Neuroimage. 2012 Oct;63(1):533–9.
4. Prasloski T, Mädler B, Xiang QS, MacKay A, Jones C. Applications of stimulated echo correction to multicomponent T2 analysis. Magn Reson Med. 2012;67(6):1803–14.
5. Zhang Y, Brady M, Smith S. Segmentation of brain MR images through a hidden Markov random field model and the expectation-maximization algorithm. Med Imaging, IEEE Trans. IEEE; 2001;20(1):45–57.
6. Firbank MJ, Coulthard A, Harrison RM, Williams ED. A comparison of two methods for measuring the signal to noise ratio on MR images. Phys Med Biol. 1999;44(12):N261-264.
7. Bjarnason T a., McCreary CR, Dunn JF, Mitchell JR. Quantitative T2 analysis: The effects of noise, regularization, and multivoxel approaches. Magn Reson Med. 2010;63(1):212–7.
Figures