1933
Development and Systematic Analysis of 2D and 3D GRE Myelin Water Imaging1Electrical and Computer Engineering, Seoul National University, Seoul, Korea, Republic of, 2Biomedical Engineering, Hankuk University of Foreign Studies, Seoul, Korea, Republic of
Synopsis
In this study, we developed
PURPOSE
Myelin water imaging (MWI) measures signals from water trapped between lipid bilayers of myelin and has been suggested as a good biomarker of myelin. Recently, GRE-MWI has been proposed as an efficient approach for acquiring MWI 1. However, previous implementations often suffered from various artifacts 2. In this study, we developed 2D and 3D GRE-MWI methods that acquire high quality myelin water images. Using these sequences, we investigated the systematic effects of scan parameters (TR and flip angle) on myelin water fraction (MWF).METHODS
1. Development of 2D and 3D GRE-MWI
To acquire high quality GRE-MWI, the following methods were developed and implemented.
[Bipolar Readout] Previous studies utilized monopolar readout gradient to avoid eddy-current induced artifacts in bipolar readout images. However, the monopolar readout has a longer echo space than bipolar readout (e.g. 2.75 ms for monopolar vs. 2.2 ms for bipolar) and, therefore, has lower efficiency. To improve efficiency and remove artifacts, we acquired and averaged two bipolar readout datasets with the opposite readout polarity3. The effect of a reduced echo space is important in MWI because of the short T2* of myelin water.
[Physiological Noise] Physiological noises are the primary sources of image degradation in GRE-MWI 2. To mitigate the effects of the physiological noises, we utilized RF saturation to reduce blood inflow artifacts and B0 navigator to compensate for respiration induced B0 fluctuation.
[Complex Data Processing] For GRE-MWI, complex data were fitted to a three pool complex model to reduce residual errors 4. To generate high quality complex images from multi-channel data, magnitude images from individual channels were averaged using the sum of squares. Phase images were combined in complex after compensating for voxel-wise B1+ offsets 5.
[Field inhomogeneity] Background field inhomogeneity is a source of signal loss in frontal and temporal lobes. This effect was compensated using a sinc correction 6,7.
Lastly, we verified that 2D multi-slice data had negligible MT effects from off-resonance RF excitations.
2. Effects of TR and flip angle in GRE-MWI
To test the effects of TR and flip angle, experiments were performed using the following parameters: FOV = 208x256, resolution = 2x2 mm2, slice thickness = 2 mm, and bandwidth = 500 Hz/pixel. For 3D, TE was 2.1:2.2:34.8 ms. For 2D, TE was 2.4:2.2:33 ms. Four subjects were scanned at 3T.
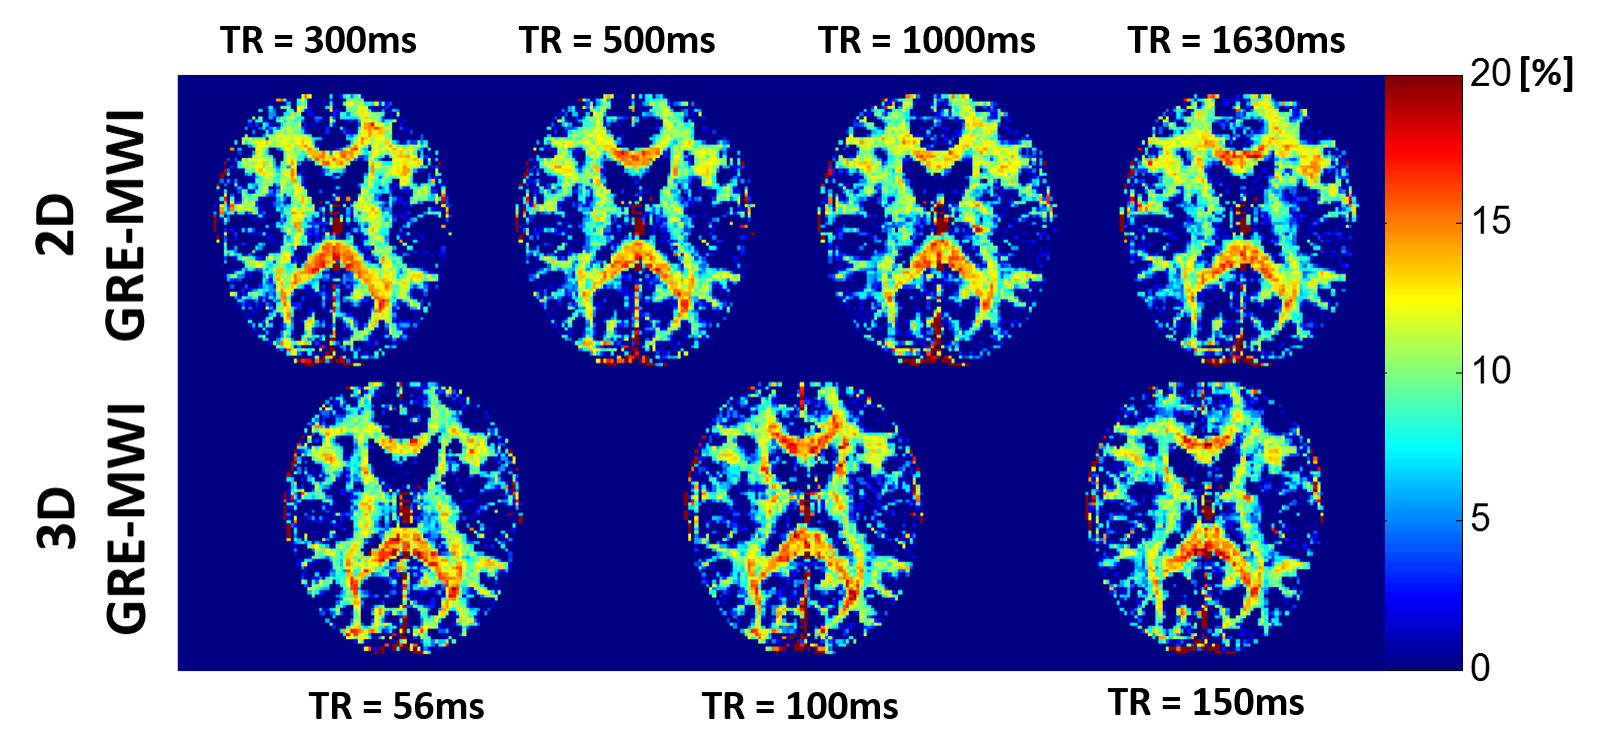
[Experiment 1: Effects of TR] The 3D sequence was utilized to acquire data at three different TRs (56, 100, and 150 ms). For longer TRs (300, 500, 1000, and 1630 ms), the 2D multi-slice sequences were acquired. In all scans, the flip angle (FA) was determined as the Ernst angles, assuming T1 = 800 ms.
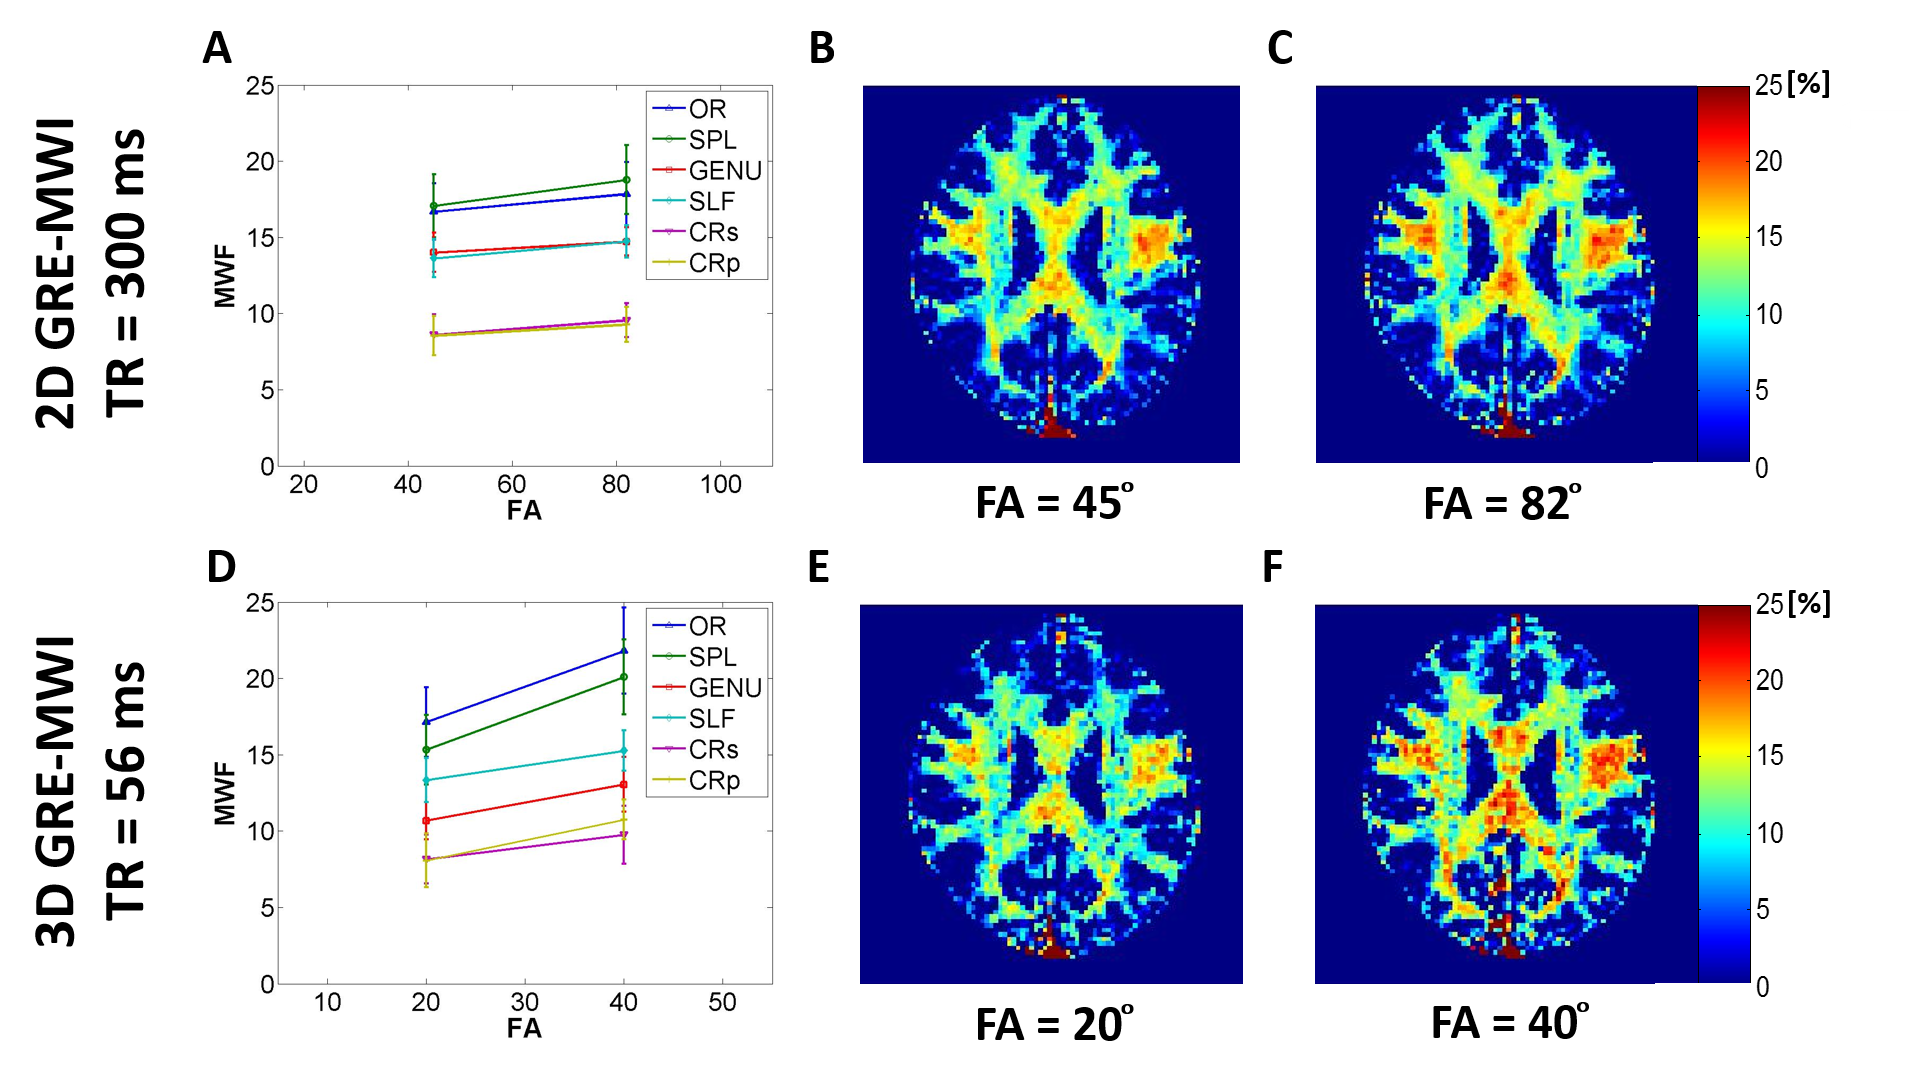
[Experiment 2: Effects of flip angle] To measure the effects of FA on MWF, additional scans were performed for TR = 56 ms using FA of 40 ̊ (FA in Exp 1 was 20 ̊) and TR = 300 ms using 82 ̊ (FA in Exp 1 was 45 ̊). The other parameters were the same.
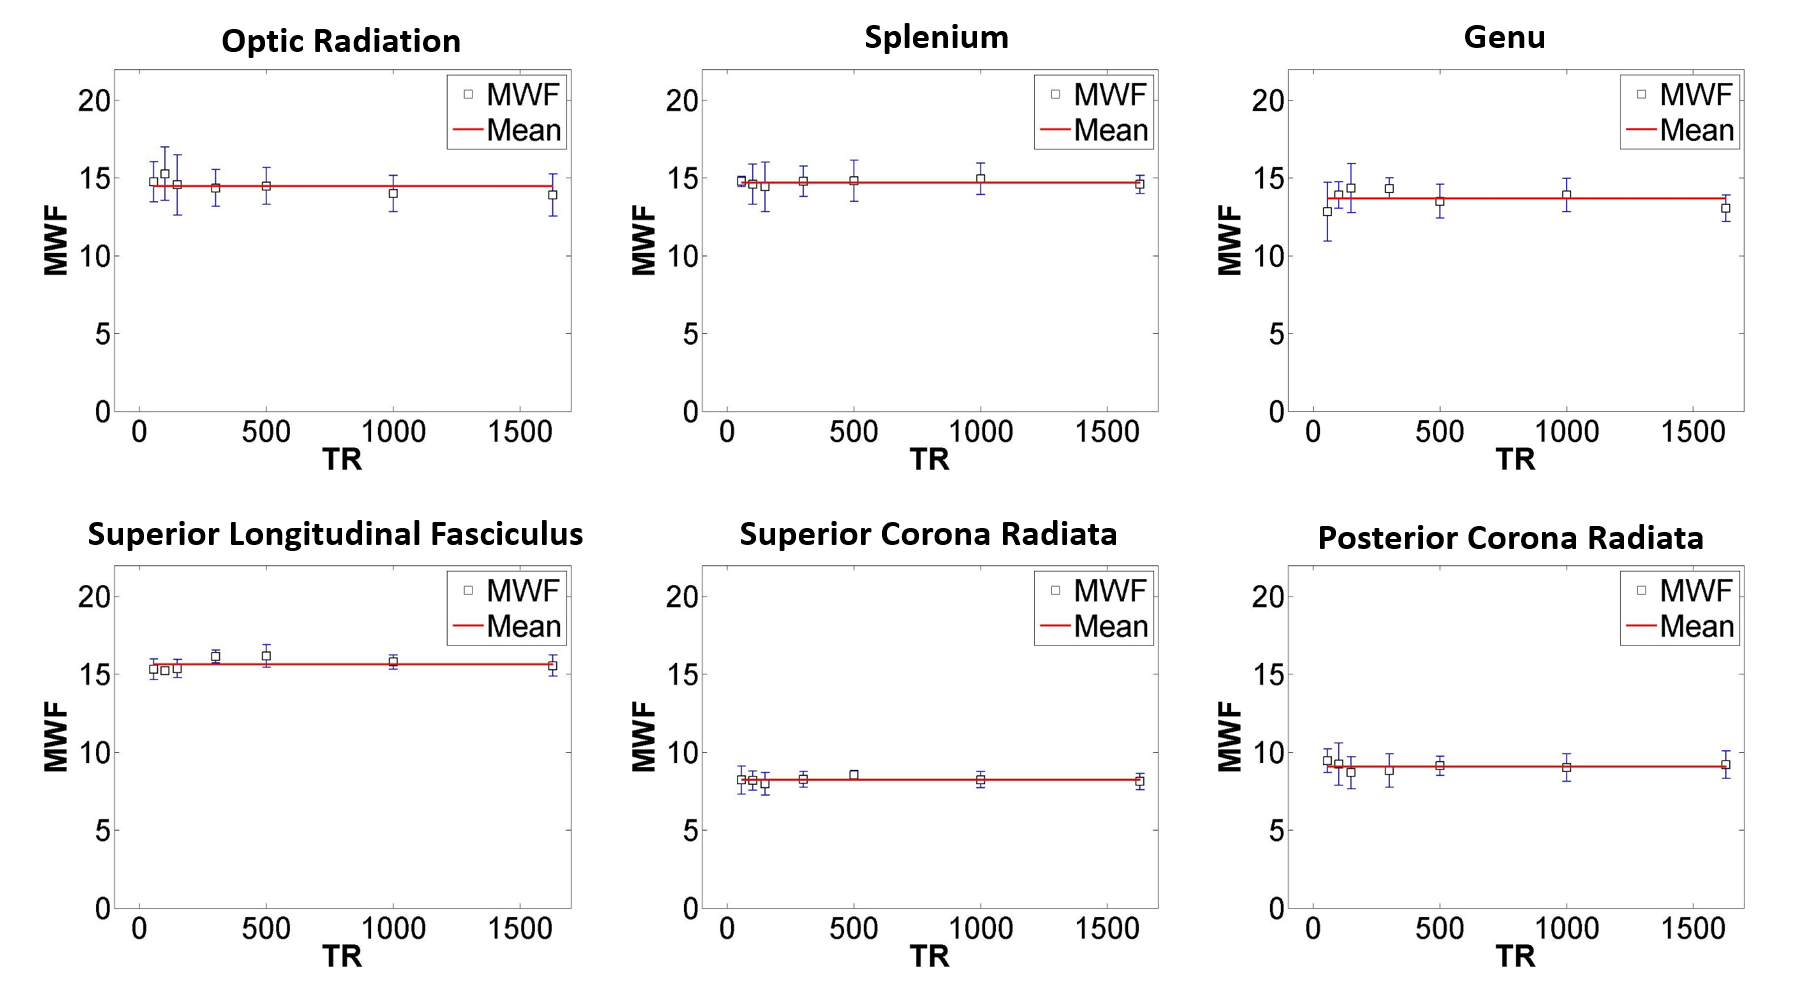
[Data Analysis] Six regions of interest (OR, SPL, GENU, SLF, CRs and CRp) were chosen for ROI analysis. Statistical comparison was performed using T-test.
RESULTS
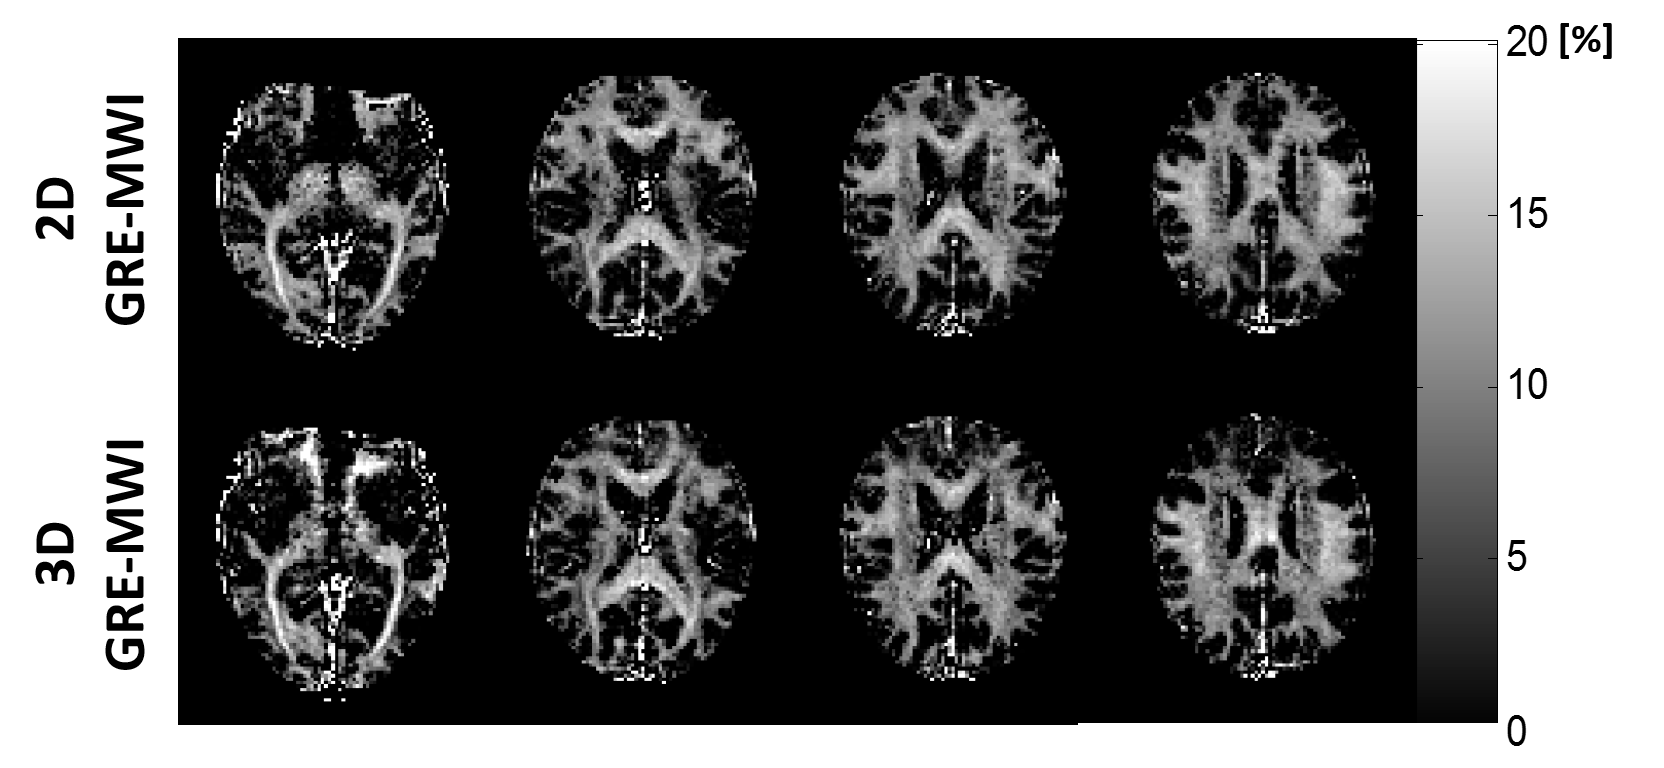
Newly developed GRE-MWI generated high quality MWF maps both in 2D and 3D (Figure 1). Compared to 3D, 2D maps show higher image quality, which may be explained by physiological noise effects suggested in fMRI 8. When the effects of TR on MWF were analyzed, the MWF maps and ROI analysis results reveal uniform MWF in all TRs when the Ernst angles were used (Figures 2, 3). On the other hand, when larger flip angles than the Ernst flip angles were applied, the maps and ROI analysis revealed overestimated MWF (p < 0.05; Figure 3).CONCLUSION AND DISCUSSION
In this study, we improved the image quality of GRE-MWI and analyzed the effects of TR and FA on MWF. We further compared 2D multi-slice imaging with 3D imaging, revealing better image quality in the 2D maps. When the multi-TR experiment was analyzed, a short TR did not reveal overestimation of MWF. This may be because of water exchange between compartments 9,10. In the multi-FA experiment, we did observe overestimated MWF in the large flip angles, suggesting that myelin water has shorter (apparent) T1 11 that may have introduced larger influence than the exchange effects. Our results suggest that the 2D multi-slice approach with long TR and Ernst angle is a good candidate for quantitative imaging. If quantification is less important, one may choose a shorter TR and a larger flip angle to overestimate myelin water signal, improving the SNR.Acknowledgements
This research was supported by Basic Science Research Program through the National Research Foundation of Korea(NRF) funded by the Ministry of Education (NRF-2015R1D1A1A01058360) and the Brain Korea 21 Plus Project in 2016.References
[1] Du, Yiping P., et al. "Fast multislice mapping of the myelin water fraction using multicompartment analysis of T 2* decay at 3T: a preliminary postmortem study." Magnetic resonance in medicine 58.5 (2007): 865-870.
[2] Nam, Yoonho, Dong-Hyun Kim, and Jongho Lee. "Physiological noise compensation in gradient-echo myelin water imaging." NeuroImage 120 (2015): 345-349.
[3] Yu, Huanzhou, et al. "Phase and amplitude correction for multi-echo water–fat separation with bipolar acquisitions." Journal of Magnetic Resonance Imaging31.5 (2010): 1264-1271.
[4] Nam, Yoonho, et al. "Improved estimation of myelin water fraction using complex model fitting." NeuroImage 116 (2015): 214-221.
[5] Robinson, Simon, et al. "Combining phase images from multi-channel RF coils using 3D phase offset maps derived from a dual-echo scan." Magnetic resonance in medicine 65.6 (2011): 1638-1648.
[6] Alonso-Ortiz, Eva, et al. "Field inhomogeneity correction for gradient echo myelin water fraction imaging." Magnetic Resonance in Medicine (2016).
[7] Fernández-Seara, M. A., and F. W. Wehrli. "Postprocessing technique to correct for background gradients in image-based R* 2 measurements." Magnetic resonance in medicine 44.3 (2000): 358-366.
[8] Lai, Song, and Gary H. Glover. "Three-dimensional spiral fMRI technique: a comparison with 2D spiral acquisition." Magnetic resonance in medicine 39.1 (1998): 68-78.
[9] Levesque, Ives R., and G. Bruce Pike. "Characterizing healthy and diseased white matter using quantitative magnetization transfer and multicomponent T2 relaxometry: A unified view via a four-pool model." Magnetic resonance in medicine 62.6 (2009): 1487-1496.
[10] Kalantari, Saeed, et al. "Insight into in vivo magnetization exchange in human white matter regions." Magnetic resonance in medicine 66.4 (2011): 1142-1151.
[11] Barta, R., et al. "Modeling T 1 and T 2 relaxation in bovine white matter." Journal of Magnetic Resonance 259 (2015): 56-67.
Figures