1932
Effect of T1 on Multi-echo Gradient Echo based Myelin Water Fraction1Yonsei University, Seoul, Korea, Republic of, 2Seoul St. Mary's Hospital, College of Medicine, The Catholic University of Korea, Seoul, Korea, Republic of
Synopsis
Myelin Water Fraction uses the property that myelin water has shorter T2* relaxation time compared to axonal/extra-cellular water. Previous studies found that not only the T2/T2* relaxation time but also the T1 relaxation time is difference between these compartments. The T1 relaxation time of myelin water is known to be affected by the cross-relaxation therefore the term “apparent T1” is considered more accurate. In this study, we analyze the effect of this ‘apparent’ T1 in mGRE based MWF. Our results show that the MWF estimation is dependent on the differential T1 of different compartments. T1 effect on the MWF can makes overestimation error. Using the low flip angle could reduce the this error, but it gives rise to insufficient SNR on MWF. Also, increasing TR could be another choice for reducing estimated error, but it leads to inefficient scan time. Thus, GRE-MWF is needed to compensated T1 effect for accurate quantification.
Introduction
Water in the myelin sheath has different MR properties than water in the intra/extracellular spaces. Myelin Water Fraction (MWF) mapping using multi-echo gradient recalled echo (mGRE) in white matter of the brain have been explored1,2. These techniques use the property that myelin water has shorter T2* relaxation time compared to axonal/extra-cellular water. Previous studies found that not only the T2/T2* relaxation time but also the T1 relaxation time is difference between these compartments3-5. Generally, mGRE based MWF mapping use short TR, thus, involving high T1-weighting. The T1 relaxation time of myelin water is known to be affected by the cross-relaxation therefore the term “apparent T1” is considered more accurate6. In this study, we analyze the effect of this ‘apparent’ T1 in mGRE based MWF. Our results show that the MWF estimation is dependent on the differential T1 of different compartments.Method
[Simulation] To investigate the T1 effect, a MWF map is emulated which incorporates the T1 factor into the 2-pool model. Specifically, the following mGRE signal model is used to generate MWF maps:
$$S=A_{my} + A_{ex,ax} $$
$$ A_{my,ax,ex} = M_{my,ax,ex}*sin(\alpha)*{{1-e^{-TR/T1_{my,ax,ex}}}\over{1-cos(\alpha)e^{-TR/T1_{my,ax,ex}}}} + NOISE$$
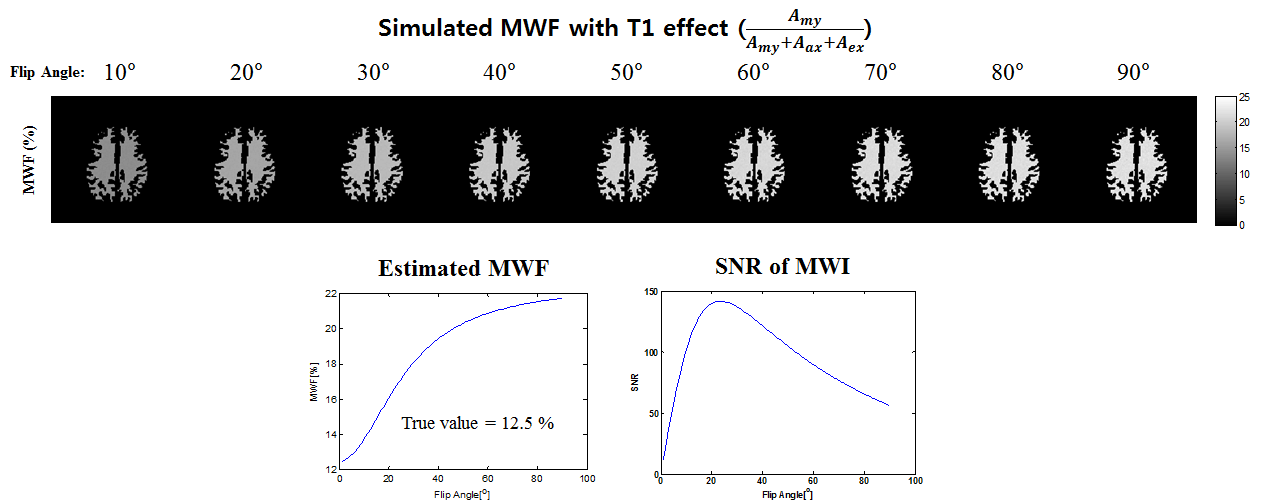
Here it is assumed that Mmy= 0.125, Mex,ax = 0.875, T1my = 500, T1ex,ax= 1000 ms, TR = 60 ms, FA = 1:0.1:90, SNR = 80. In the simulation, T2* effect is not considered.
[Experiment] A healthy volunteer was scanned at 3T (Tim Trio, Siemens Medical Solutions, Erlangen, Germany) with a 12-channel head coil. For MWI, a 3D mGRE sequence was used with the following imaging parameters: matrix size: 128x128x30, spatial resolution 2x2x3[mm3], TR = 60[ms], TE1 = 1.65 [ms], ΔTE = 1.04[ms] (bipolar acquisition7), # of echo = 30, flip angle = 10°, 20°, 30°, 40°, 50°, 60°. Physiological noise is compensated using navigator and flow saturation band.8 A three-pool complex model which includes the T2* information and frequency offset terms was fitted to each voxel to estimate MWF,
$$S(t) = ( A_{my}e^{-(1/T^*_{2my}+i2\pi(Δf_{bg+my}))t} + A_{ax}e^{-(1/T^*_{2ax}+i2\pi(Δf_{bg+ax}))t} + A_{ex}e^{-(1/T^*_{2ex}+i2\pi(Δf_{bg+ex}))t} )e^{-i∅_0} $$
To determine the T1my, T1ax and T1ex , the data was first fit to $$ A_{my,ax,ex} = M_{my,ax,ex}*sin(\alpha)*{{1-e^{-TR/T1_{my,ax,ex}}}\over{1-cos(\alpha)e^{-TR/T1_{my,ax,ex}}}} $$ using first echo data from every flip angle data. Here, we assume that the T1 of axonal and extra-cellular compartment is the same. After T1 fitting, T1 value of each compartment is used for compensating MWF.
Result
Figure 1 shows the result of the simulation of T1 effect. Because high flip angle makes more T1-weight on the images, errors on MWF is increased when higher flip angle is used. Also, this simulation shows the SNR of MWF is the highest using 23° flip angle. This flip angle is between Ernst angle of myelin water and axonal/extra-cellular water. (Ernst angle of T1 = 1000 is 20°, of T1 = 500 is 27°)
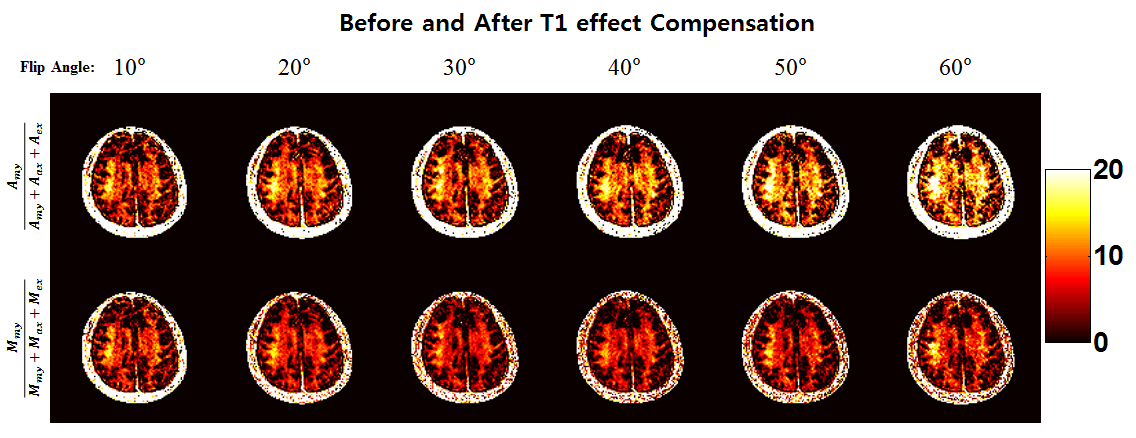
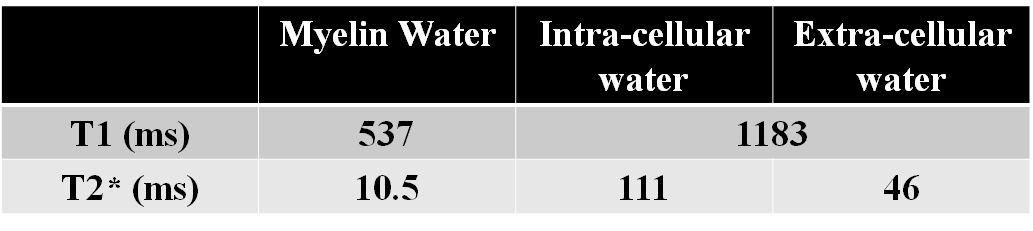
Figure 2 first low images shows the experimental MWF changing flip angle. The values of the fitting parameters averaged over global white matter listed in the table. Using the fitted T1my and T1ax,ex value, MWF is compensated overestimation error caused by T1 effects (Figure 2 second low). After compensation, it is seen that the variations of MWF estimation is reduced regardless of flip angle.
Discussion and Conclusion
In this study, we showed that T1 effect on the MWF can makes overestimation error. Using the low flip angle could reduce the this error, but it gives rise to insufficient SNR on MWF. Also, increasing TR could be another choice for reducing estimated error, but it leads to inefficient scan time. Thus, GRE-MWF is needed to compensated T1 effect for accurate quantification. Appropriate compensation method will be investigated in future work.Acknowledgements
No acknowledgement found.References
1. Sati P, et al. Micrto-compartment specific T2* relaxation in the brain. Neuroimage, 2013;77:268-278
2. Nam Y, et al. Improved Estimation of Myelin Water Fraction using Complex Model Fitting. Nueroimage, 2015;116:214-221
3. Deoni S, et al. Gleaning Multicomponent T1 and T2 Information From Steady-State Imaging Data, MRM, 2008;60;1372-1387
4. Oh S-H, et al. Direct visualization of short transverse relaxation time component (ViSTa), NeuroImage, 2013;83;485-492
5. Li W, et al. Dependence of gradient echo phase contrast on the differential signal decay in subcellular compartments, ISMRM, 2013
6. Ou X, et al. MT Effects and T1 Quantification in Single-Slice Spoiled Gradient Echo Imaging, MRM, 2008;59;835-845
7. Lee et al, Myelin Water Fraction Estimation with Phase Corrected Bipolar Multiecho Gradient echo Sequences, ISMRM, 2016
8. Nam et al, Physiological noise compensation in gradient-echo myelin water imaging, NeuroImage, 120(2015)345-349
Figures