1930
Transverse relaxation of cerebrospinal fluid depends on glucose concentration1National Institute of Neurological Disorders and Stroke, National Institutes of Health, Bethesda, MD, United States
Synopsis
Brain relaxometric properties are widely used by the NMR community. While brain tissue relaxivities are well established, much less work has been done on CSF relaxivities. To clarify this point, we characterized the CSF relaxometric properties at various field strengths in vivo and in vitro. Our results suggest that low field is more optimal to quantify CSF T2 due to smaller residual gradients. There is a significant difference between in vitro CSF T2 vs saline T2 that is mostly explained by the glucose relaxivity. This finding was confirmed in vivo, opening the possibility of studying glucose regulation of CSF at the resolution of MRI.
INTRODUCTION
Brain relaxometric properties are widely used by the NMR community. Brain tissue T1 and T2 are well known with a T1 ranging from 1-1.4 s and a T2 ranging from 0.05 - 0.1 s depending on field strength and specific sequences used1-3. However, much less work has been done on CSF relaxation times. Indeed, the range of CSF T2 values in the literature is remarkably wide, ranging from 0.2 to 2.2 s (11-fold variation). CSF T1 values are more consistent ranging from 2.8 to 4.6 s (2 fold variation)4-8. In this study, the values of T2 for in vivo human and mice CSF at various field strengths and for in vitro CSF samples at 14.1T were measured. We also determine whether the T2 values are affected by physiological protein, metals and glucose CSF concentration.
METHODS
IN VIVO Human: 6 healthy patients were scanned. T2 measurement: performed on a 3 and 7T MRI trying to minimize gradients from the imaging sequence. Imaging was performed using a spin echo multi-contrast sequence with TR = 10000 ms, TE (32) = 30.5 - 945.5 ms and a resolution of 3 mm3. Animals: 12 mice were used to measure CSF T2 on a 1, 4.7, 9.4 and 11.7T MRI and 10 rats were used to measure CSF T2 on a 4.7T MRI for the glucose challenge. All procedures were performed under isoflurane anesthesia (2.5%). For the in vivo glucose challenge, both jugular (for glucose injection) and femoral (for blood collection) veins were catheterized (Fig.1A). T2 measurement: Spectroscopy of the whole head was performed using a mutiecho CPMG sequence with TR=20000 ms, TE(1024)=2–1029 ms. Post-Processing: for human data, T2 maps were calculated by performing a bi-exponential fit of the pixel intensities using the robust least absolute residuals method. For rodent, T2 data was fitted using a NNLS method9. A spectrum was obtained and the average value of peak assigned to CSF was used to quantitate the T2.
IN VITRO CSF samples: CSF of 3 patients, 3 rhesus macaque monkey and 4 CD rats were collected (all healthy). Solutes preparation: all solutes were diluted in saline: ZnCl2, FeCl2, CuCl2 (0-1 mM), MnCl2 (0-0.08 mM), bovine serum albumin (BSA, 0-0.03 mM) and glucose (0-56 mM). T2 measurement: T2 values were calculated at 37°C on a 14.1 T MRI system (see above). Post-Processing: R2 value in human CSF for each solute was calculated (Table.3).
Fig. 2
RESULTS
|
Fig. 2 |
In vivo, CSF T2 decreased with an increase in field strength for both human and rodent (Table.1). This was true even when a spectroscopic sequence with no imaging gradients was used. In vitro, CSF was measured to be about 2 s in all samples (Table.2). This is close to the value obtained in the human at 3T and the rodent at 1T. The difference in T2 between saline and CSF was large (~ 40%; Table.2).
To test whether paramagnetic metals ions, proteins and/or glucose could explain CSF T2, the relaxivity for each component was measured (Table.3). For all metals, the concentration was too low to significantly modify the CSF T2 relaxivity (<0.5%). Proteins can explain approxiately 14% of the shortening of CSF T2. Interestingly, the glucose concentration was high enough to cause most of the shortening of CSF T2 with respect to saline T2 (53%). To test whether CSF T2 changed with changes in CSF glucose, CSF R2 was measured during changes in blood glucose in the rat. A good correlation between the R2 measured and both the blood glucose (R2=0.71; p<0.001; Fig.1B) and CSF glucose (R2=0.93; p<0.005; Fig.1C) was measured.
B
B
DISCUSSION
CSF T2 is about 2 s and can be
measured in vitro and in vivo (at low field). This long T2
is in agreement with values obtained at low field in the literature4.
The shorter CSF T2 values obtained at higher fields likely reflect
the effects of residual gradients in the image sequence used or residual
gradients in the brain due to tissue susceptibility or shim gradients. Therefore, low field is more optimal to
quantify CSF relaxivity in vivo. Glucose was identified as the major
contributor of the CSF T2 shortening with respect to saline explaining
about 53% of the differences. An acute change in CSF
glucose by infusion of glucose into blood in rodents was able to be monitored via changes in CSF T2 values.
Interestingly, both the very long T2 of
CSF and the fact that glucose is the dominant contributor to the relaxation
properties of CSF lead to the intriguing possibility that regulation of CSF
glucose can be studied by simply using T2-weighted MRI.|
B |
|
B |
Acknowledgements
This study was supported by the Intramural Research Program of the National Institute of Neurologic Disorders and Stroke (NINDS), National Institutes of Health
.References
1Li et al., Neurosci Lett, 2016, 610:92–97; 2Piper et al., Magn Reson Imaging, 2016, 34:596–602; 3Schilling et al., Neuroradiology, 2002, 44:968–972; 4Hopkins et al., Magn Reson Med, 1986, 3(2):303-11; 5Kjos et al., Am J Roentgenol, 1985, 144:1165–1170; 6Larsson et al., Magn Reson Med, 1989, 11(3):337–348; 7Piechnik et al., Magn Reson Med, 2009, 61:579–586; 8Jezzard et al., Radiology, 1996, 199(3):773-9; 9Prasloski et al., Magn Reson Med, 2012, 67(6):1803-14
Figures
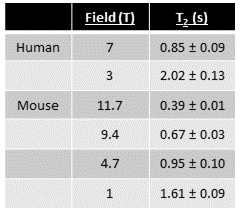
Table 1: CSF T2 measurement of in vivo human and rodent brain.
In humans, T2 mapping was performed at 7T and 3T. CSF-ROIs were drawn by hand in the lateral ventricles. In rodent, spectroscopic sequences were used to measure CSF T2 of the whole head at 11.7T, 9.4T, 4.7T, and 1T. Quantification of CSF T2 in vivo shows longer T2 values at low field in both Human and rodent. T2 values are expressed as mean ± Standard Deviation
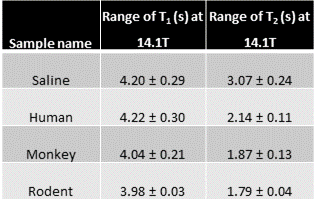
Table 2: T1 and T2 of ex vivo CSF samples.
CSF samples were collected from healthy humans, rats and monkeys. The relaxation times were measured at 37°C on a 14.1T Bruker scanner. Values are represented as mean ± standard deviation.
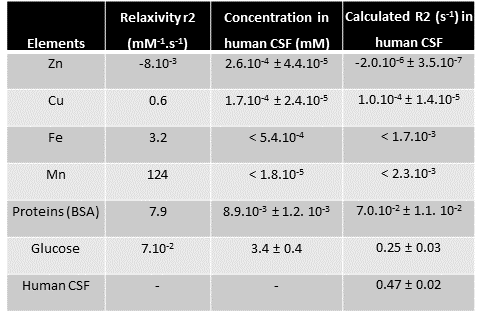
Table 3: CSF compounds that can substantially change human CSF T2 relaxivity.
For each solute (proteins, metals and glucose), ΔR2 (1/T2; s-1) values were plotted against solute concentration (mM). Relaxivity r2 (mM-1.s-1) was then computed (ΔR2 = r2 x [solute]). Each solute concentration in healthy human CSF was measured (by IC-PMS (Exova, California) for metals and by colorimetric methods for BSA and glucose. Based on this concentration, R2 value in human healthy CSF for each solute was calculated using R2 = r2 x [solute] + b assuming the in vitro values for relaxivities.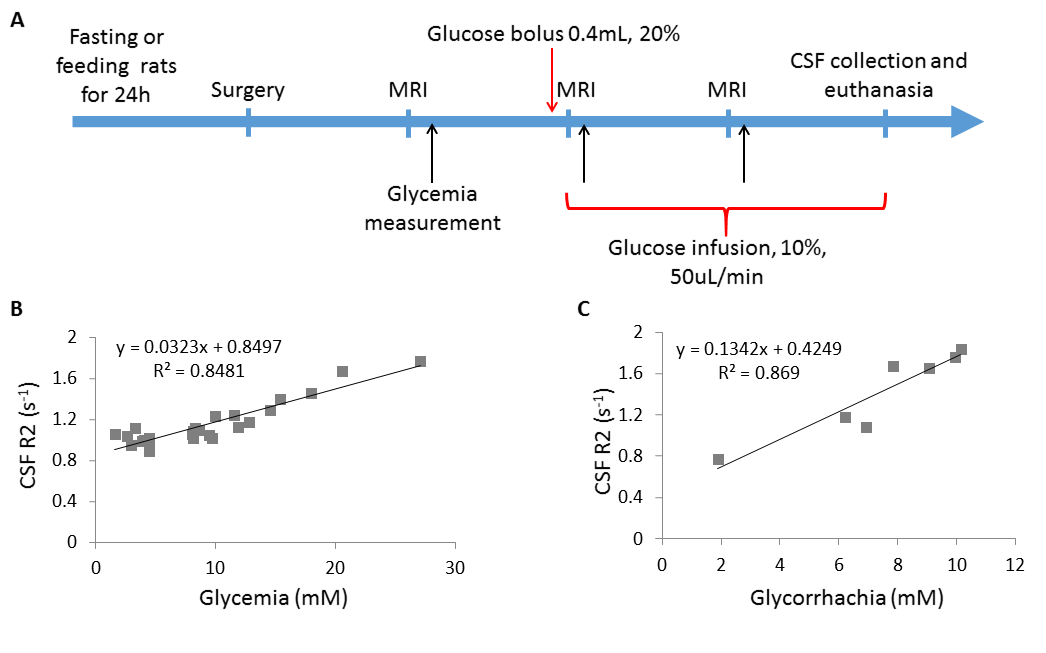
Figure 1: CSF T2 depends on glycemia
A. Experimental scheme. Black arrows correspond to serum glucose concentration measurement via the femoral artery. The rat was kept within the MRI scanner (4.7T Bruker MRI system) during blood collection. B. CSF R2 values measured at 3 time point as shown in A, plotted against serum glucose concentration values (n=9 rats). C. CSF R2 values measured at the end of the experiment, just before CSF collection, plotted against CSF glucose concentration values (n=7). CSF was collected just after the last MRI acquisition and before euthanasia.