1929
Characterization of the Four Pool Model in formalin-fixed sheep's brain using NMR spectroscopy1Physics and Astronomy, University of British Columbia, Vancouver, BC, Canada, 2Radiology, University of British Columbia, Vancouver, BC, Canada
Synopsis
Despite its importance, T1 relaxation in brain and spinal cord is not well understood. The Four Pool Model gives a fundamental framework for its understanding in white and grey matter tissue. In this work, we characterize the Four Pool Model for the first time in formalin-fixed sheep's brain using NMR spectroscopy. We find this is a suitable system, and our results are consistent with previous studies: T1 is multi-exponential and the values measured result from a convolution of pure relaxation and exchange processes.
Introduction
Despite its role in generating contrast, T1 relaxation in brain and spinal cord is not well understood. Magnetization exchange between aqueous and non-aqueuous protons in these tissues is often approached using two-pool fast exchange models, which give a single T1 value dependent on water content [1,2,3,4]. However, recent studies [5,6,7,8] have measured two T1 components, where the slower component has been proposed to be from water trapped between myelin bilayers. Yet, it has also been shown that when the non-aqueous and aqueous magnetizations are returning to equilibrium, cross-relaxation effects can induce a short T1 component [9, 10].
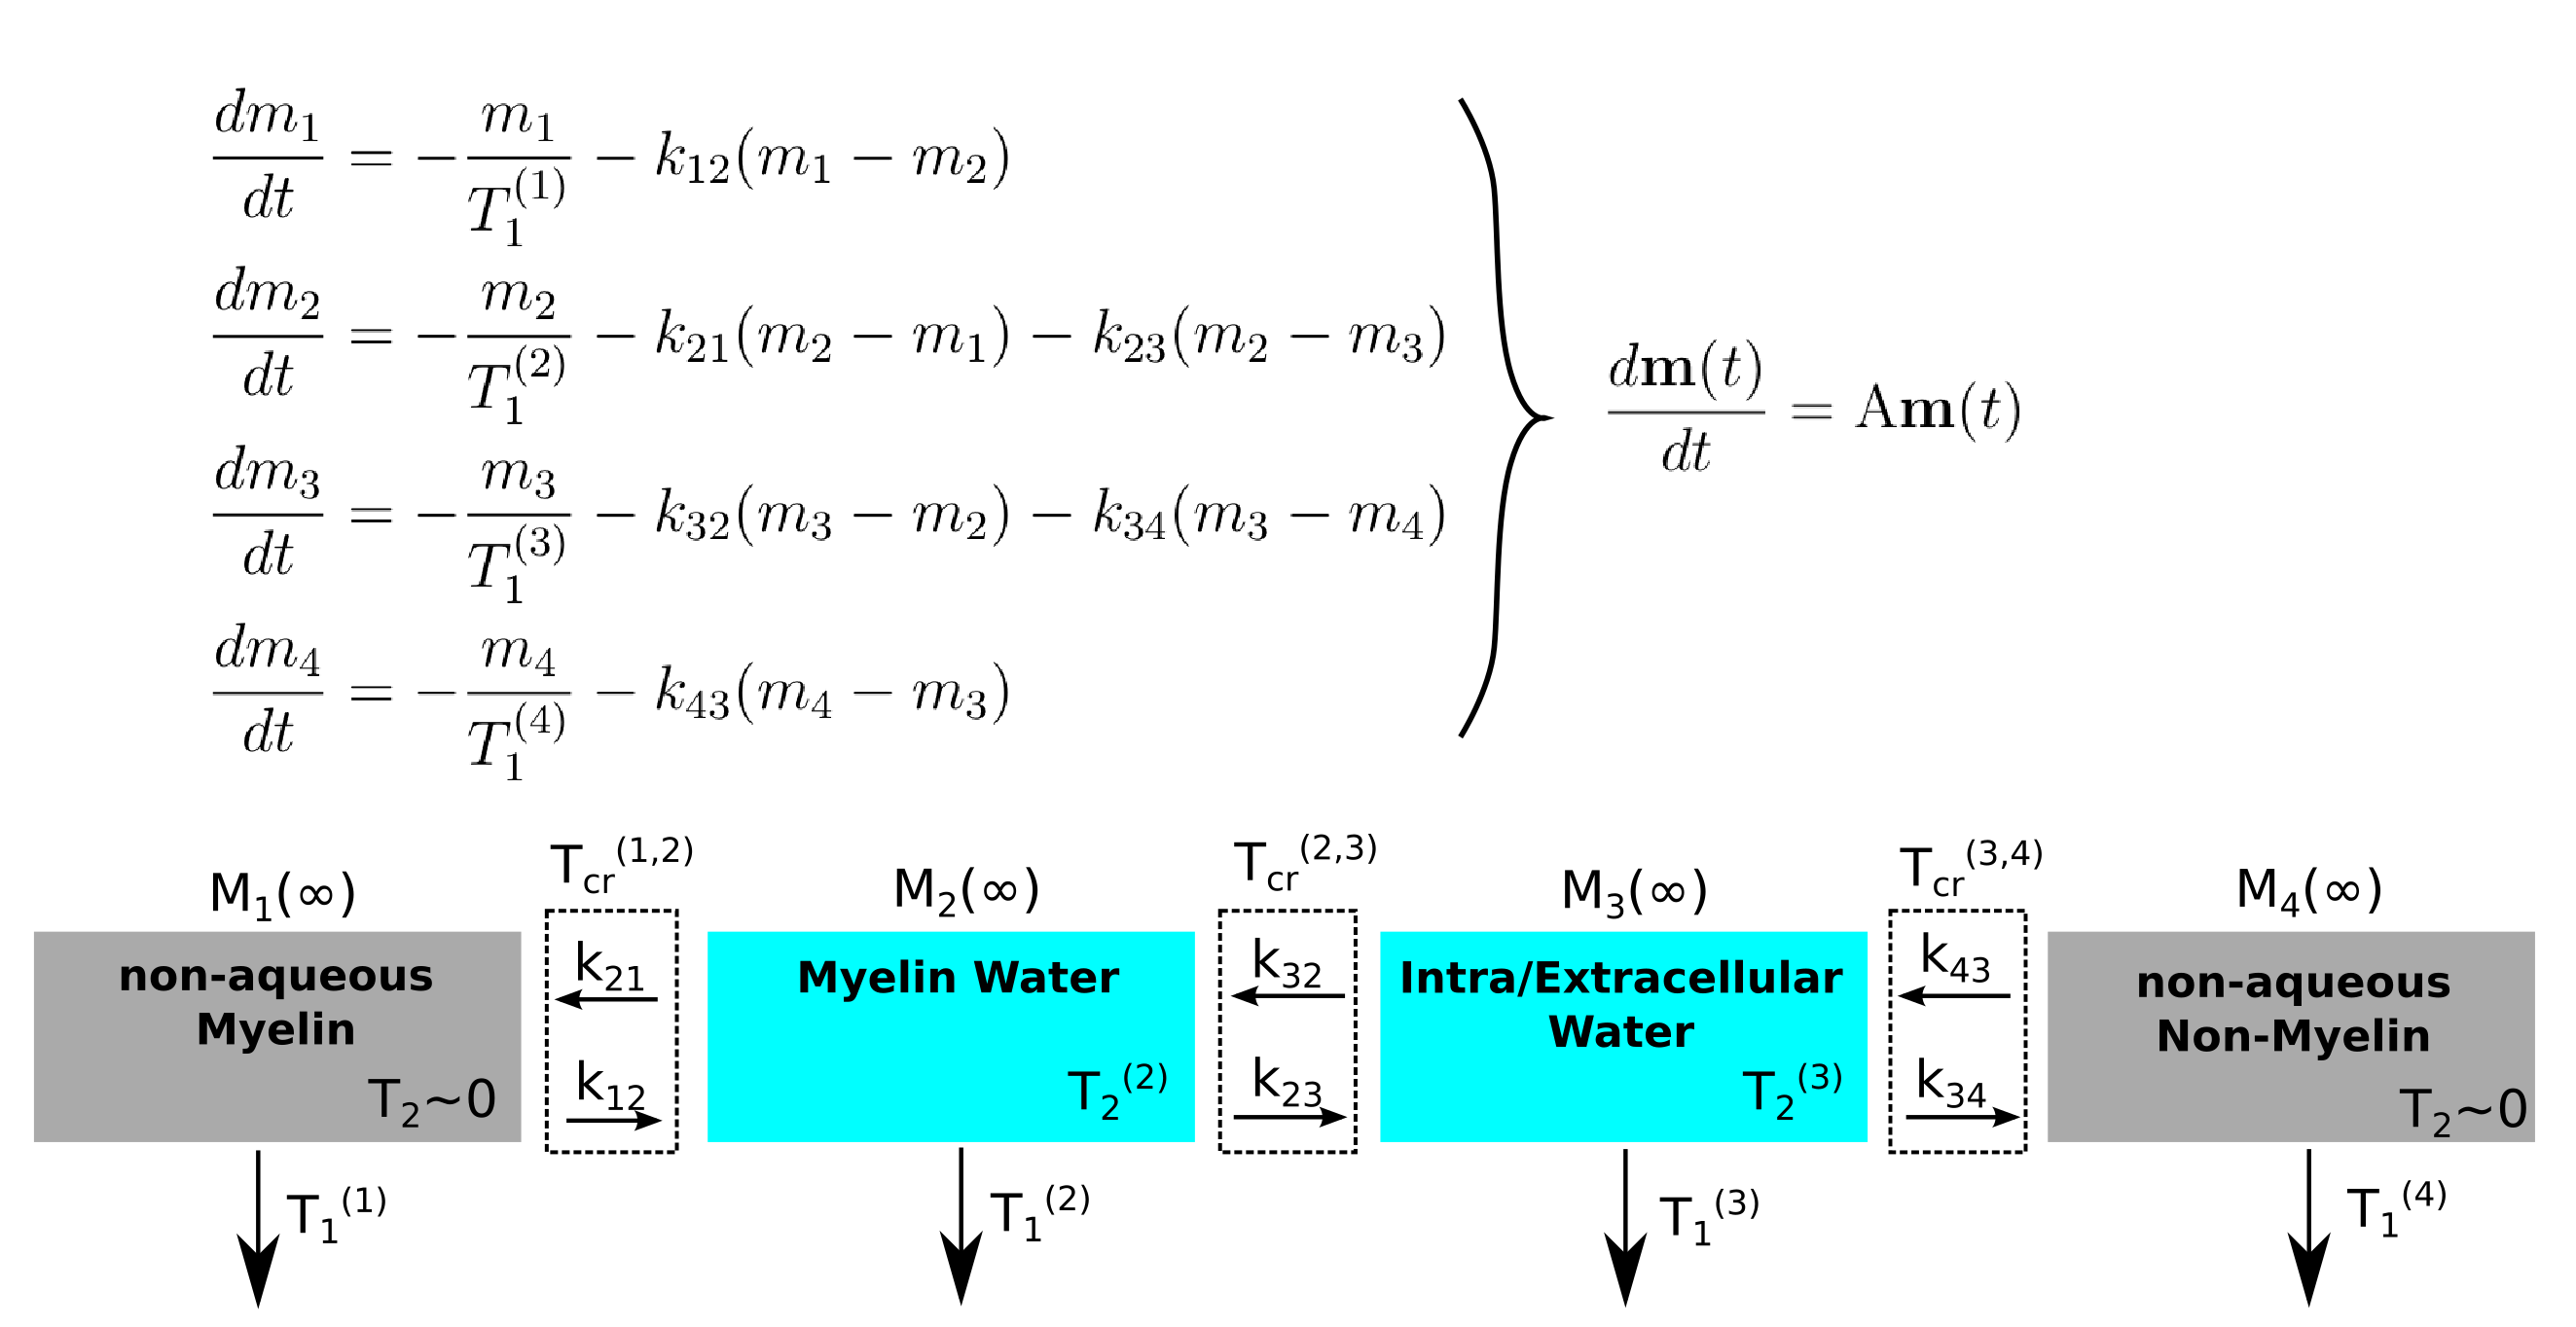
Analysis of the problem with the Four Pool Model has yielded insights into this relaxation/exchange interplay [11, 12, 13, 14, 15]. This physiological-based model (Figure 1) uses four separate pools: Non-aqueous Myelin, Aqueous Myelin water, Aqueous Intra/Extracellular (IE) water, and Non-aqueous non-myelin. Each pool has a unique size Mi(∞), T1 and T2 time, and exchange rates kij with adjacent pools. In reduced magnetizaiton units, $$$m_i = -(M_i - M_(\infty))/2M_i(\infty),$$$ the model's coupled Bloch equations (Figure 1) leads to solutions in the form $$\mathbf{m}(t) = \sum_{i=1}^{4} c_i \mathbf{v}_i \exp(-t/T_{1i}^*).$$ The eigenvectors $$$\mathbf{v}$$$, which are a linear combination of magnetization from each pool, relax with an effective T1, T1*. The coefficients ci are determined by how initial magnetizations in the pools are prepared with RF pulses.
This work is part of an effort to fully characterize the four pool model in a specific tissue sample to clarify the conflicting views of T1 relaxation. We have used NMR spectroscopy to study relaxation in formalin-fixed sheep White Matter (WM), a novel system for these studies. Like previous work [11], we use direct observation of the non-aqueous signal (undetectable in conventional MRI) to measure the aqueous fraction. The aqueous signal's relaxation under different initial conditions is analyzed using the the four pool model eigenvectors [15].
Methods
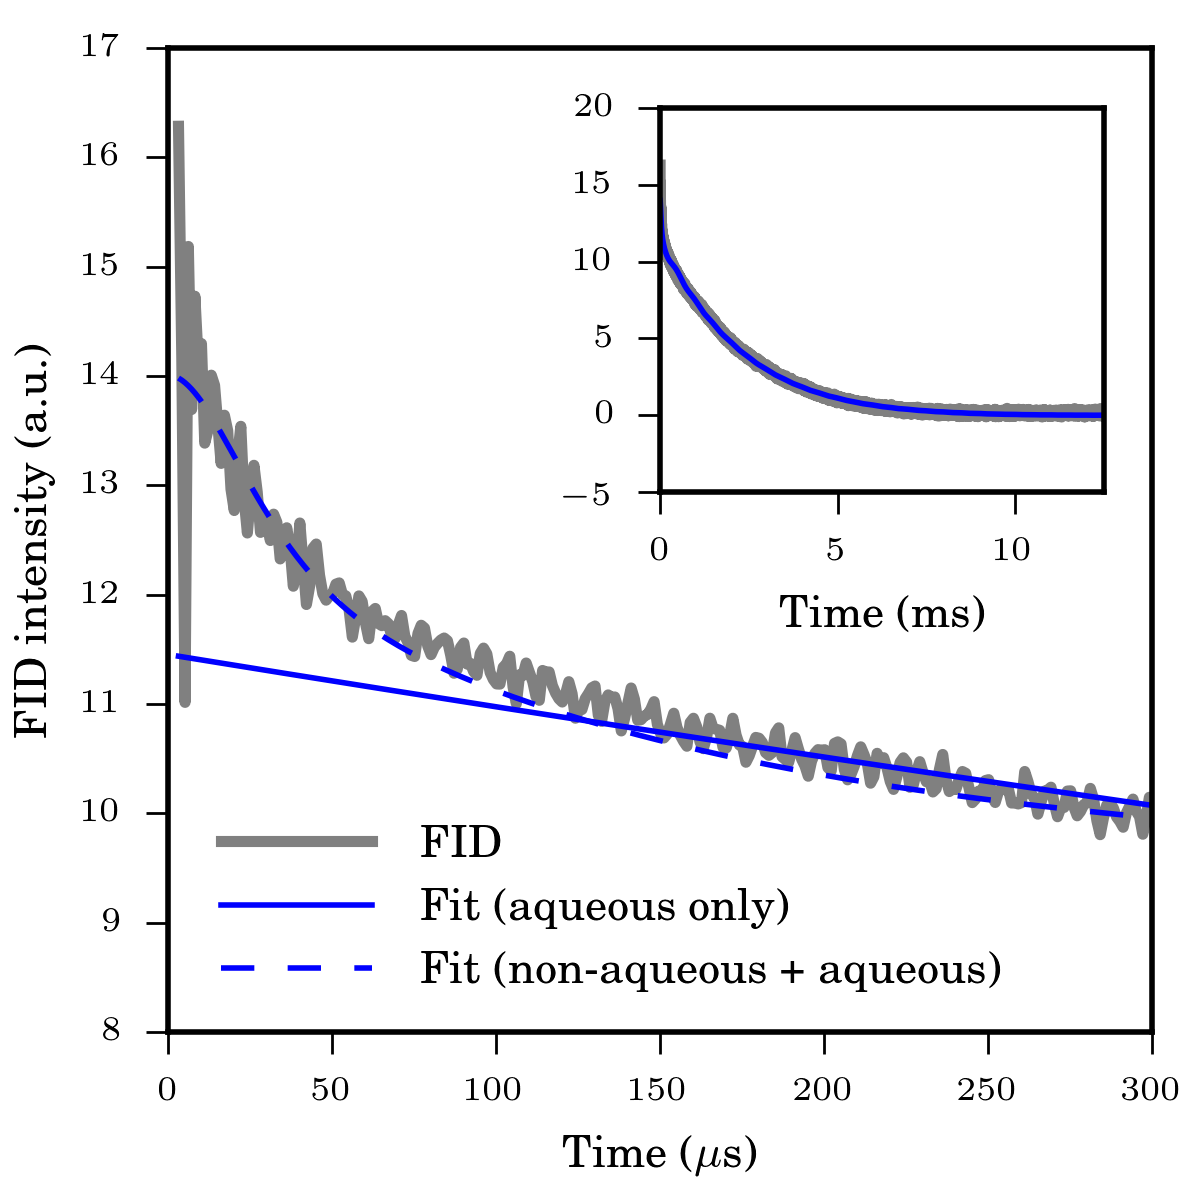
A ~50 mg WM sample of formalin-fixed sheep brain (Ward's Science, Rochester, NY, USA) was excised from the parietal lobe adjacent to the cerebral fissure and sealed inside an NMR tube. A homebuilt spectrometer (200 MHz / 4.7 T) utilizing a broadband solenoidal probe was used for the experiments. The aqueous/non-aqueous magnetization fractions were determined by fitting a Bloch decay FID to a superposition of a lorentzian and superlorentzian lineshapes, thereby modelling the NMR signal from the aqueous and non-aqueous protons, respectively (Figure 2).
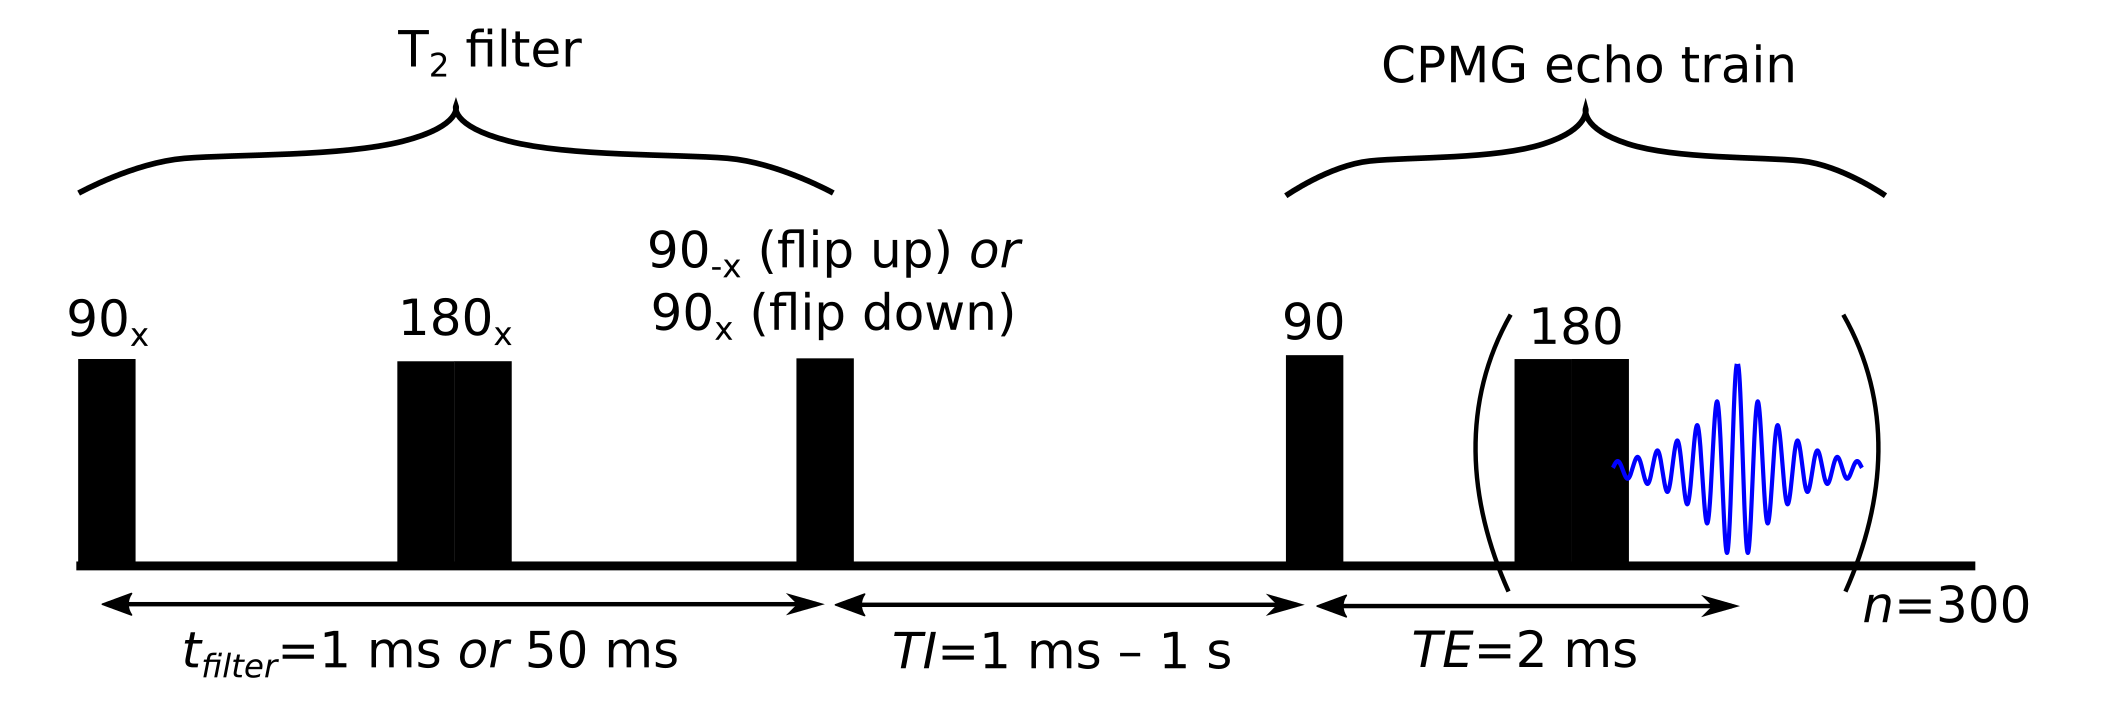
The four pool model was fit simultaneously using a least-squares solver to data from four Goldman-Shen sequences [16] with CPMG aquisition. The Goldman-Shen sequences (Figure 3) consisted of a T2 filter (echo time: 1 ms or 50 ms) after which the magnetization is stored along +z (flip up) or -z (flip down). Given the expected T2 times of Myelin water (~15 ms) and IE water (~70-90 ms) [17], a filter time of 50 ms resulted in significant magnetization differences. No magnetization remains in the non-aqueous pools because of their short (~100 μs) T2 values. Following the filter, there is a relaxation period (24 TI values, 1 ms to 10 s) and CPMG acquisition (TE=2 ms, 300 echos).
When fitting the data, the magnetizations following flip down/up pulses were multiplied by an efficiency factor to account for pulse imperfections. Also, a small non-exchanging pool was included to account for bulk water.
Results and Discussion
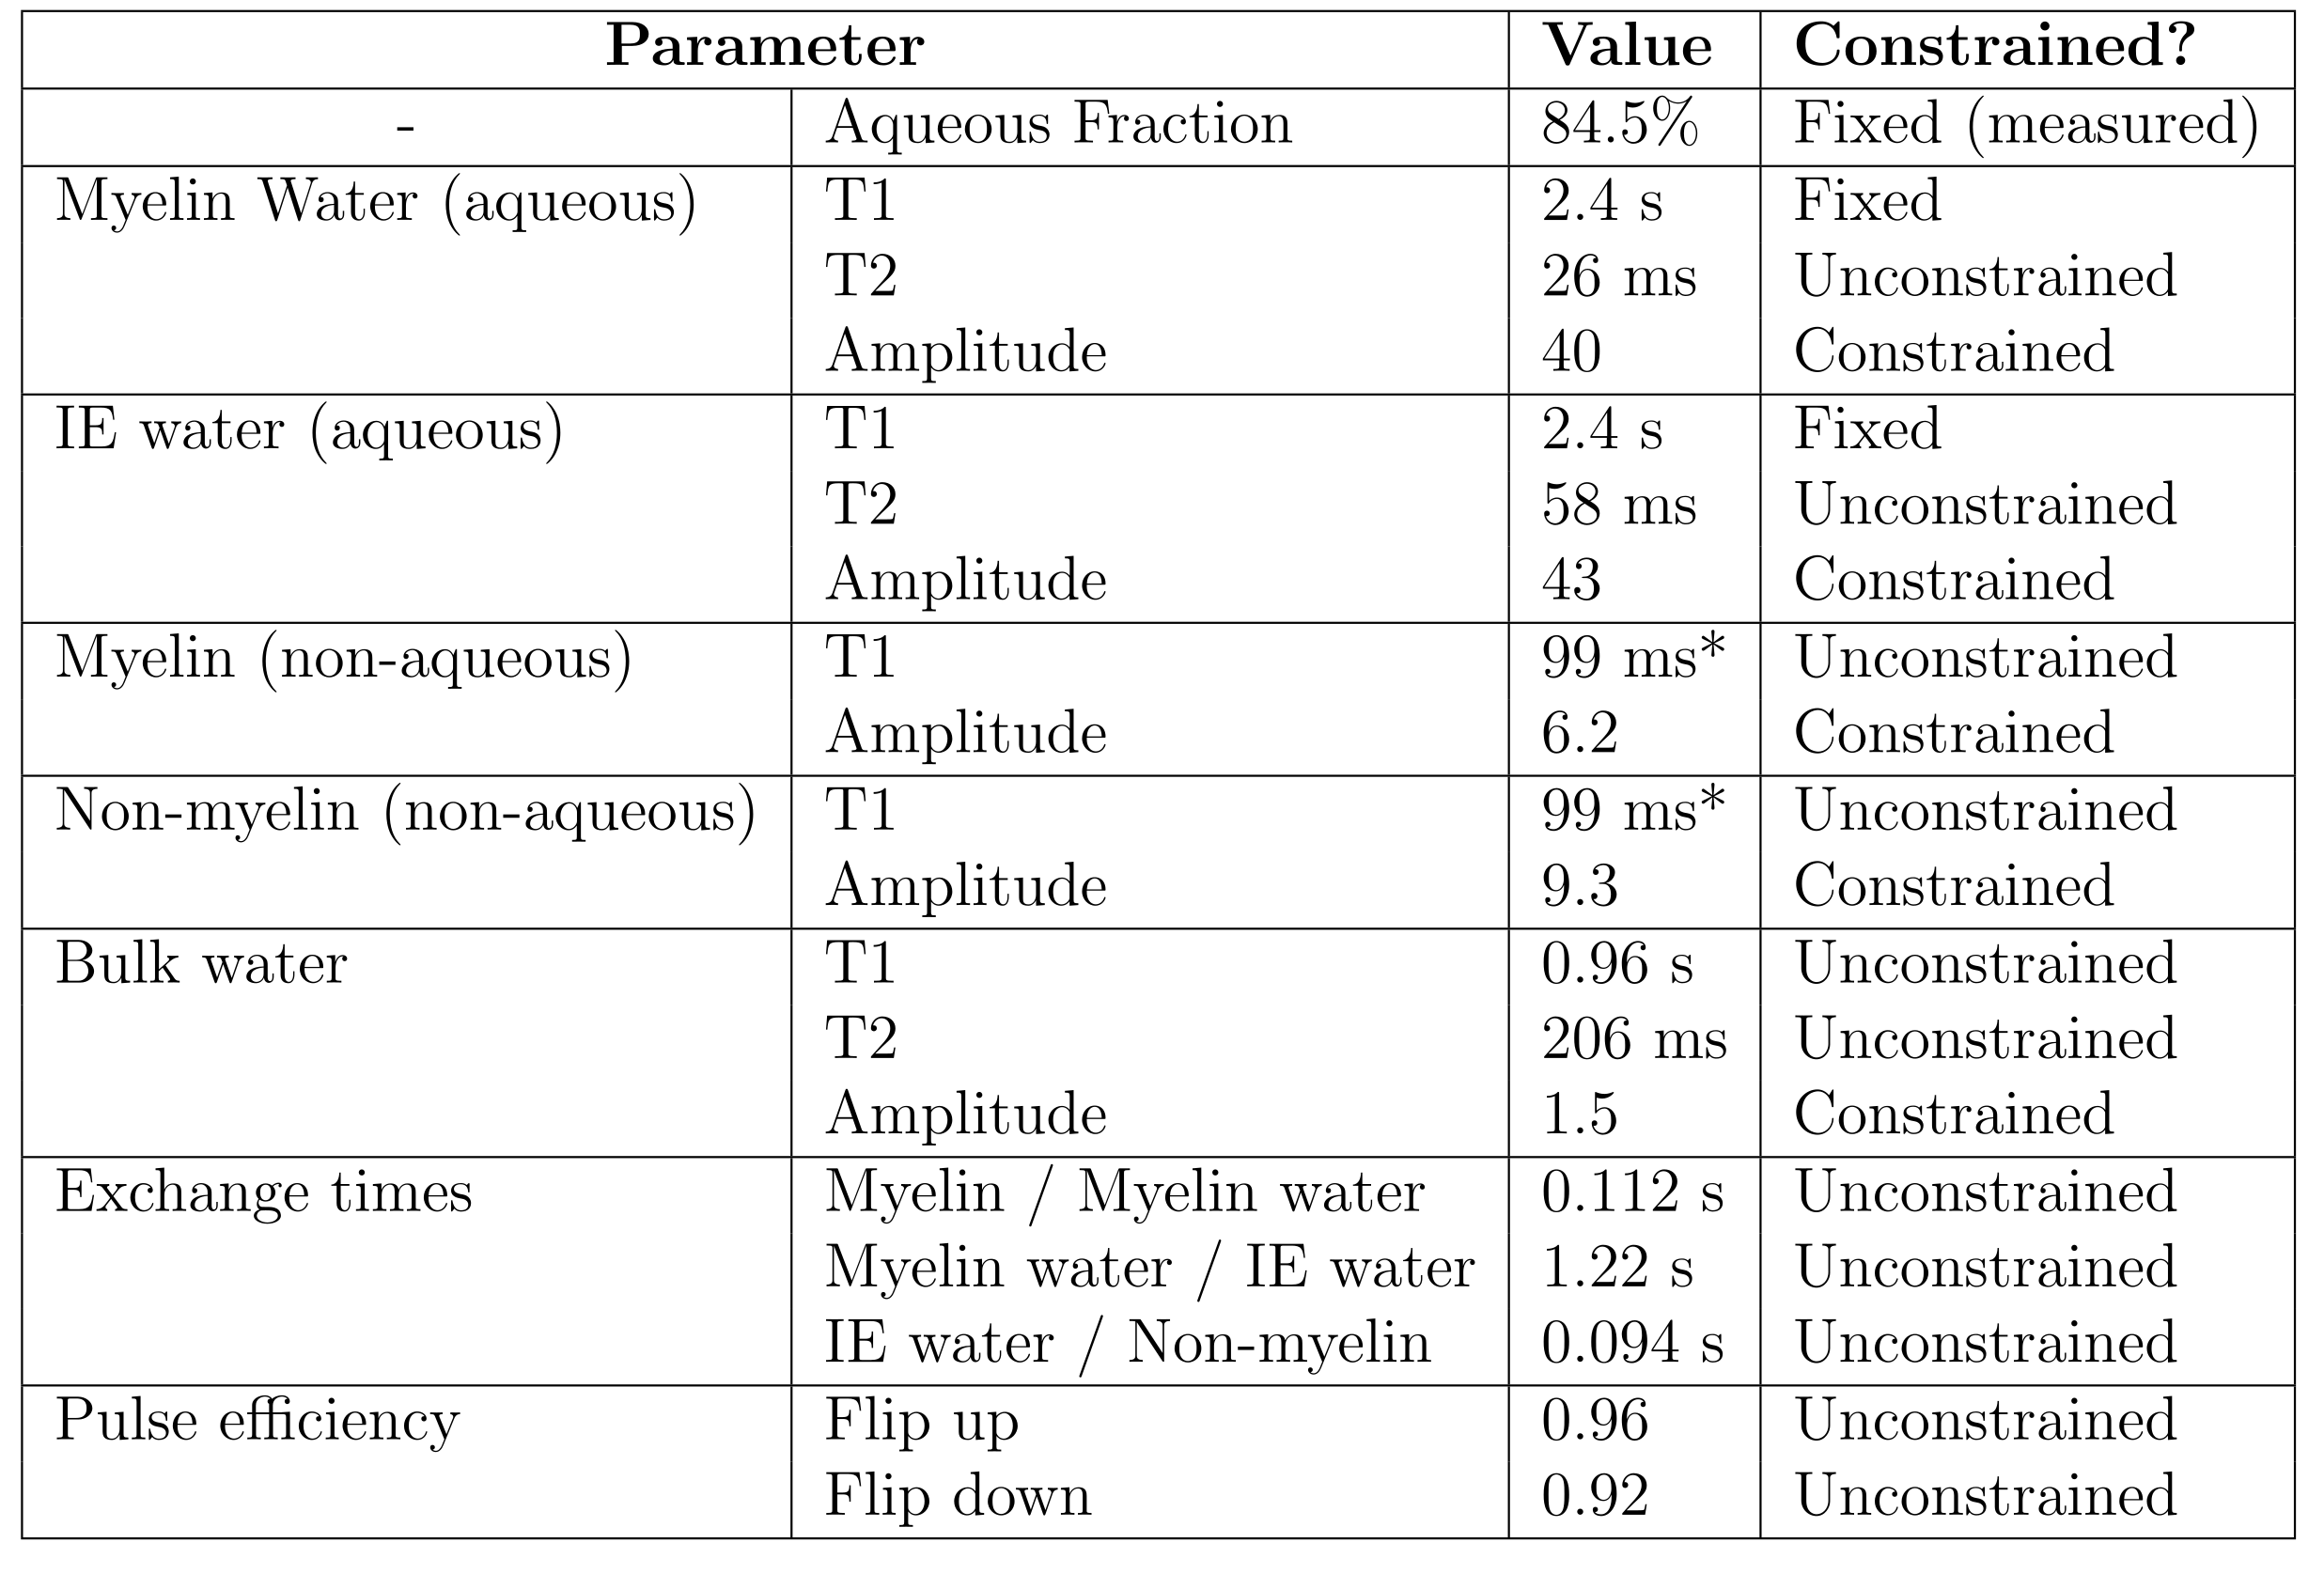
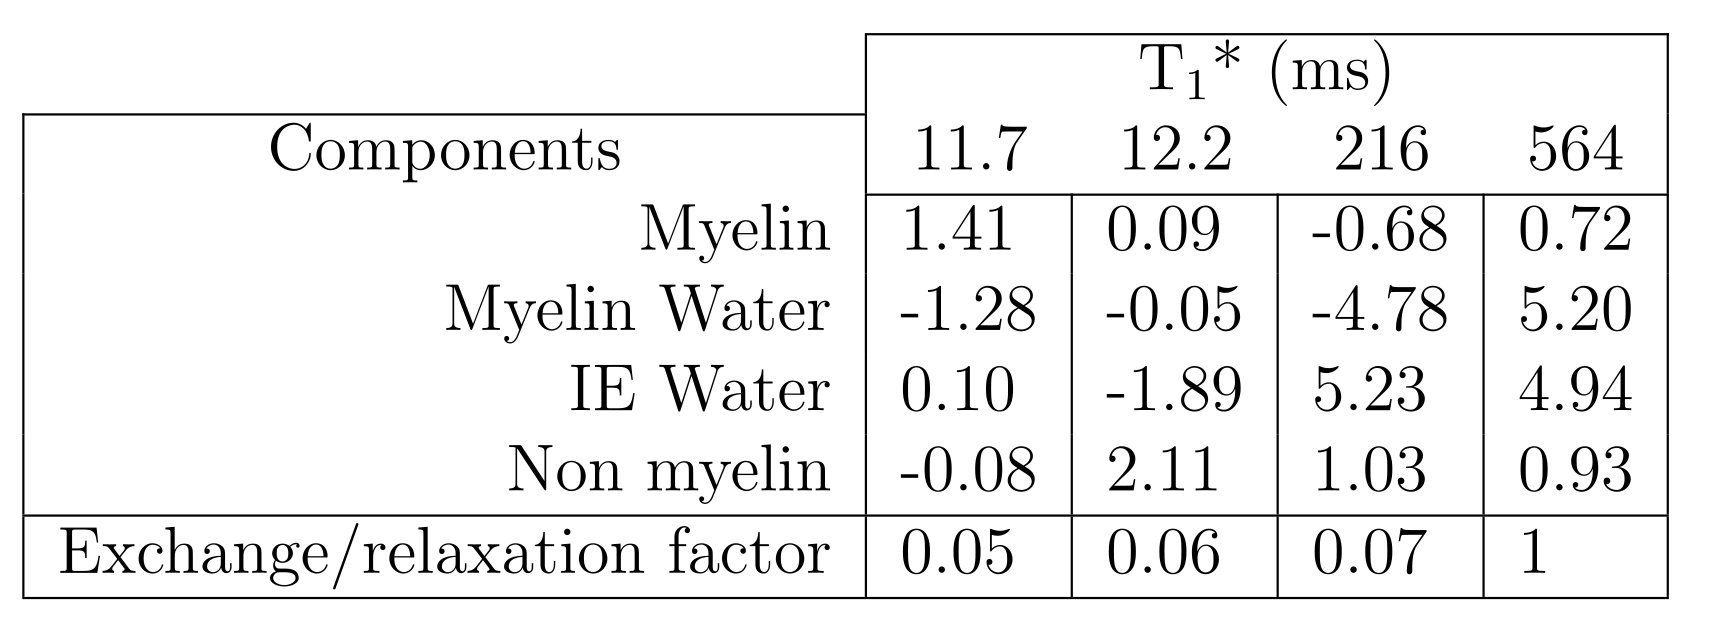
Figure 3 shows the fitted parameters. Aqueous pool amplitudes were constrained to the measured aqueous fraction. Because the T1 of isolated aqueous pools is poorly constrained, this was fixed as in previous studies [15]. The relaxation and exchange parameters are qualitatively similar to those found in bovine brain [11,15]. The increase in the Myelin water pool from normal values (~1-10% [17]) is expected in formalin-fixed WM tissue [18,19]. Figure 4 shows the eigenvectors (scaled by the pool sizes to represent magnetization) and the associated T1* values. Whether this is associated with exchange to the non-aqueous pools or due to pure relaxation can be determined for each eigenvector $$$\mathbf{v}$$$ by calculating $$$\sum_i v_i / |\mathbf{v}|$$$. This is 0 for pure exchanging eigenvectors as for T1*=11.7 ms and T1*=12.2 ms, which describe myelin water/non-aqueous myelin and IE water/non-aqeuous non-myelin cross-relaxation. When this factor is 1, as for T1*=564 ms, the eigenvector describes pure relaxation.Conclusions
By direct observation of the non-aqueous signal, NMR spectroscopy allows for near-complete characterisation of all parameters in the Four Pool Model. Formalin-fixed sheep brain is a suitable model system for T1 relaxation in WM tissue and reinforces the findings of previous studies: T1 relaxation is multi-component due to an interplay of pure and cross-relaxation.Acknowledgements
A.P.M. was supported by an NSERC doctoral scholarship. A.L.M. and C.A.M. were supported by NSERC Discovery Grants.References
[1] MacDonald, H. L. et al. Correlation of human NMR T1 values measured in vivo and brain water content. The British Journal of Radiology 59, 355–357 (1986)
[2] Fatouros, P. P. et al. Water Determination by T1 Measurements: Effect of Total Water Content, Hydration Fraction, and Field Strength. Magnetic Resonance in Medicine 17, 402–413 (1991).
[3] Vavasour, I. M., Laule, C., Li, D. K., Traboulsee, A. L. & MacKay, A. L. Is the magnetization transfer ratio a marker for myelin in multiple sclerosis? Journal of Magnetic Resonance Imaging 33, 710–718 (2011).
[4] Meyers, S. M. et al. Does hydration status affect MRI measures of brain volume or water content? Journal of Magnetic Resonance Imaging 44, 296–304 (2016).
[5] van Gelderen, P., Jiang, X. & Duyn, J. H. Effects of magnetization transfer on T1 contrast in human brain white matter. NeuroImage 128, 85–95 (2016).
[6] Harkins, K. D. et al. The microstructural correlates of T1 in white matter. Magnetic Resonance in Medicine 75, 1341–1345 (2016).
[7] Labadie, C. et al. Myelin water mapping by spatially regularized longitudinal relaxographic imaging at high magnetic fields. Magnetic Resonance in Medicine 71,375–387 (2014).
[8] Oh, S.-H. et al. Direct visualization of short transverse relaxation time component(ViSTa). NeuroImage 83, 485–492 (2013).
[9] Prantner, A. M., Bretthorst, G. L., Neil, J. J., Garbow, J. R. & Ackerman, J. J. Magnetization transfer induced biexponential longitudinal relaxation. Magnetic Resonance in Medicine 60, 555–563 (2008).
[10] Gochberg, D. F. & Gore, J. C. Quantitative magnetization transfer imaging via selective inversion recovery with short repetition times. Magnetic Resonance in Medicine 57, 437–441 (2007).
[11] Bjarnason, T., Vavasour, I., Chia, C. & MacKay, A. Characterization of the NMR behavior of white matter in bovine brain. Magnetic Resonance in Medicine 54, 1072–1081 (2005).
[12] Stanisz, G., Kecojevic, A., Bronskill, M. & Henkelman, R. Characterizing white matter with magnetization transfer and T2. Magnetic Resonance in Medicine 42, 1128–1136 (1999).
[15] Barta, R. et al. Modeling T1 and T2 relaxation in bovine white matter. Journal of Magnetic Resonance 259, 56–67 (2015).
[16] Goldman, M. & Shen, L. Spin-Spin Relaxation in LaF3. Phys. Rev. 144, 321–331 (1966).
[17] MacKay, A. et al. Insights into brain microstructure from the T2 distribution. Magnetic Resonance Imaging 24, 515 – 525 (2006).
[18] Chen HS, Holmes N, Tetzlaff W, Kozlowski P. Effect of Osmolarity on Myelin Water Fraction Measurement in Aldehyde Fixed Spinal Cord Tissue. Proceedings of the International Society of Magnetic Resonance Imaging. 21, p. 1114 (2013)
[19] Chen HS, Holmes N, Tetzlaff W, Kozlowski P. Correcting Myelin Water Fractoin for T2 Changes Caused by Varying Phosphate Buffer Concentration in Aldehyde Fixed Spinal Cord Tissue. Proceedings of the International Society of Magnetic Resonance Imaging. 22, p. 4909 (2014)
Figures