1928
Relaxation time shortening by oxygen molecules: Strong enhancement in a viscous solution with cellular viscosity1Graduate School of Health Sciences, Hokkaido University, sapporo, Japan, 2Faculty of Health Sciences, Hokkaido University, sapporo, Japan
Synopsis
Since oxygen molecules are paramagnetic, they shorten the relaxation time as well as gadolinium contrast medium. The effect of relaxation time shortening by the paramagnetic substance is enhanced with an increase in viscosity of the solution as in the cell. We investigated the longitudinal and transverse relaxivities of oxygen in viscous solution with cellular viscosity and clarified that the relaxation time shortening by oxygen molecules strongly increases with an increase in viscosity. This effect of oxygen in the cell may be visible by using pulse sequences that enhance the signal from the cellular proton.
Purpose
Since oxygen molecules are paramagnetic, they shorten the relaxation time as well as gadolinium contrast medium. The relaxivity of oxygen, i.e. the oxygen concentration dependence of relaxation rate, has been investigated in saline solution. Longitudinal and transverse relaxivities are found to be almost too small for MR signals to reflect oxygen concentration changes. The Bloembergen-Purcell-Pound (BPP) theory tells us that the effect of relaxation time shortening by the paramagnetic substance is enhanced with an increase in the viscosity of the solution. The viscosity in a cell is high as an average of 80 cP in organelles1, while the viscosity of saline is 0.7 cP at 37°C. However, the relaxivity of oxygen has not yet been investigated in such a viscous solution. In this study, we investigated the longitudinal and transverse relaxivities of oxygen in a solution with cellular viscosity.Materials and Methods
In this experiment, we prepared a saline solution that mimics interstitial fluid and a viscous solution (saline with glycerin 91% (w/w), 75 cP) that mimics intracellular water in a container (23 L for saline, 0.7 L for viscous solution), respectively. Oxygen gas was bubbled in each solution in order to attain 4 different oxygen concentrations between 130 and 250 mmHg. The bubbled solution was then packed into a sealed tube (14.1 mm inner diameter, 105 mm length). To measure the T2 of each solution, the multi-echo imaging (TR = 2000 ms, TE = 50-1000 ms (saline), TE = 12.5-250 ms (viscous solution)) was performed with a 64 channel head coil in a 3-T MRI (MAGNETOM Prisma, Siemens). The temperature of the solution was maintained at 37°C during the entire experiment. This measurement was repeated 7 times for the saline solution and 4 times for the viscous solution. Using T2 data, the transverse relaxivity of oxygen in the saline and viscous solutions was obtained. The T1 was also measured in the viscous solution by using IR-SE imaging (TR = 2000 ms, TE = 12 ms, TI = 30-1000 ms) and the longitudinal relaxivity of oxygen was obtained.Results and Discussion
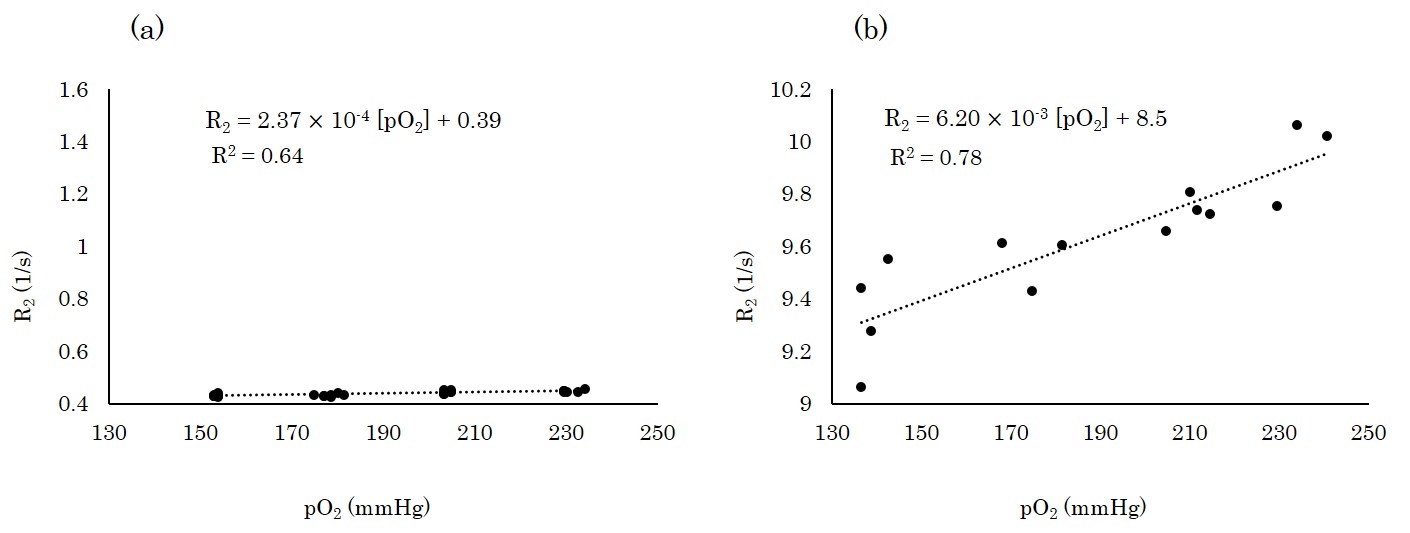
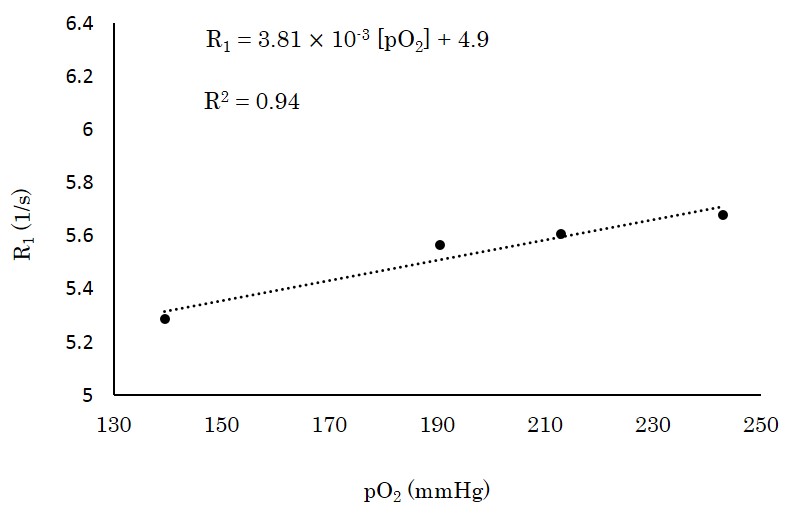
The transverse relaxivity of the saline solution was 2.37 × 10⁻⁴ [s·mmHg]-1 (Fig. 1a). On the other hand, that of the viscous solution increased 26 times to 6.20 × 10⁻³ [s·mmHg]-1 reflecting the BPP theory (Fig. 1b). The longitudinal relaxivity of the viscous solution was measured as 3.81 × 10⁻³ [s·mmHg]-1 (Fig. 2) which was 24 times larger than the reported value of the saline solution (1.61 ± 0.02 × 10⁻⁴ [s·mmHg]-1)2 at the same temperature. The change in oxygen concentration (Δ[O2]) gives rise to a change in signal intensity of the spin-echo EPI (ΔS/S) and this change is given by $$\frac{ΔS}{S}=\left(\frac{TR}{e^{R_{1}·TR}-1}·r_{1}-TE·r_{2}\right)Δ\left[O_{2}\right]\;\;\;\;\;\;\;\;\;\;\;\;\;\;\;\;\;\;\;\;\;\;\;\;\;\;\;\;\;\;\;\;\;\;\;\;\;\;\;\;\;\;\;\;\;\;\;\;\;\;\;\;\;\;\;\;\;\;\;\;\;\;\;\;\;\;\;\;\;\;\;\;\;\;\;(1),$$
where R1 is the longitudinal relaxation rate, r1 and r2 are the longitudinal and transverse relaxivities of oxygen, respectively. Using TR = 2 s and TE = 80 ms as an example of diffusion-weighted imaging (DWI: spin-echo EPI with motion probing gradient) in fMRI, the ΔS/S of the cellular signal, which is enhanced in DWI, is estimated as -5.0 × 10⁻⁴·Δ[O2] from Eq. 1. In this estimation, we used the value of R1 of the viscous solution prepared by the atmospheric partial pressure of oxygen (140 mmHg in Fig. 2). The oxygen concentration in tissue may physiologically change, by a maximum of 100 mmHg. This maximal change in oxygen concentration leads to 5% of the corresponding cellular signal change (|ΔS/S|) from Eq. 1. By increasing the b value of DWI, the signal from the cellular proton is enhanced because of the high viscosity in the cell. Therefore, the oxygen concentration changes in the cell may be visible in DWI. Although the signal is mainly observed from glycerin (91% (w/w)), the signal from water in the cell would also show the enhancement of the relaxation time shortening by oxygen molecules following the BPP theory.
Conclusions
The relaxation time shortening by oxygen molecules is enhanced with an increase in viscosity and this effect in the cell may be visible by using pulse sequences that enhance the signal from the cellular proton.Acknowledgements
No acknowledgement found.References
1) Kuimova MK, Yahioglu G, Levitt JA, et al. Molecular rotor measures viscosity of live cells via fluorescence lifetime imaging. J. Am. Chem. Soc. 2008;130:6672-6673.
2) Pilkinton DT, Hiraki T, Detre JA, et al. Absolute cerebral blood flow quantification with pulsed arterial spin labeling during hyperoxia corrected with the simultaneous measurement of the longitudinal relaxation time of arterial blood. Mag Reson Med. 2012;67:1556-1565.
Figures