1927
Effect of vendor specific formalin composition and concentration on post-mortem MRI of human brain tissue1Department of Neurology, Medical University of Graz, Graz, Austria, 2Department of Neuropathology, Institute of Pathology, Medical University of Graz, Graz, Austria, 3Department of Pathology, Medical Faculty, Otto-von-Guericke-University, Magdeburg, Germany
Synopsis
Formalin fixation is common procedure to prevent tissue autolysis by crosslinking proteins. Not unexpectedly this affects the relaxation properties of the tissue. In addition, quantitative relaxation time constants of formalin fixed brain tissue show a broad variation across different studies. To investigate the contribution of the formulation of formalin to this variability we investigated MR relaxation times of pure formalin solutions from different vendors and the effect of formalin concentration on MR relaxation times of fixed brain tissue. Our results showed a strong variation of relaxation times depending on the concentration used and more importantly on the vendor specific composition of the formalin solutions.
Introduction
Commonly, formalin fixed tissue is used for post-mortem MRI studies because unfixed human brain tissue with a short post-mortem delay is sparsely available and can be investigated only over short time periods. Formalin fixation is preventing autolysis and subsequently enabling long time storage of biological tissue samples1,2. However, a broad spectrum of quantitative relaxation times of fixed brain tissue is reported in literature2-5. Those differences in relaxation times are commonly attributed to different formalin concentrations but other factors like the composition of the formalin solution used may also play a role. Therefore, we systematically investigated MR relaxation times of formalin from different vendors and in different concentrations as well as the impact of formalin concentration on post-mortem MRI of human brain tissue.Methods
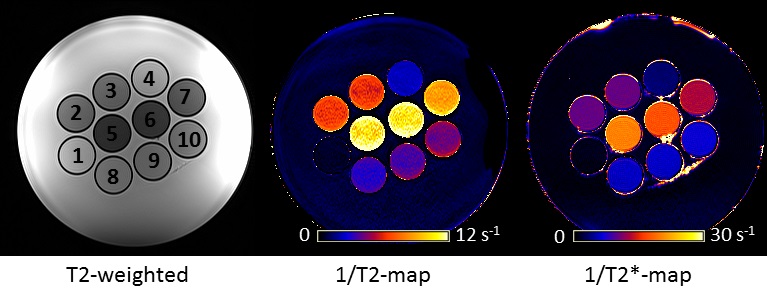
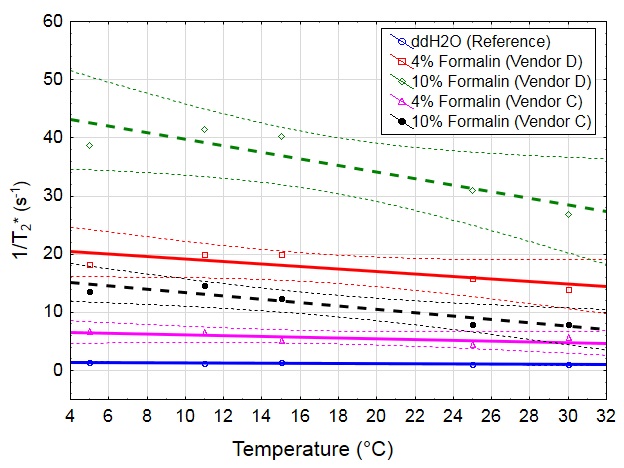
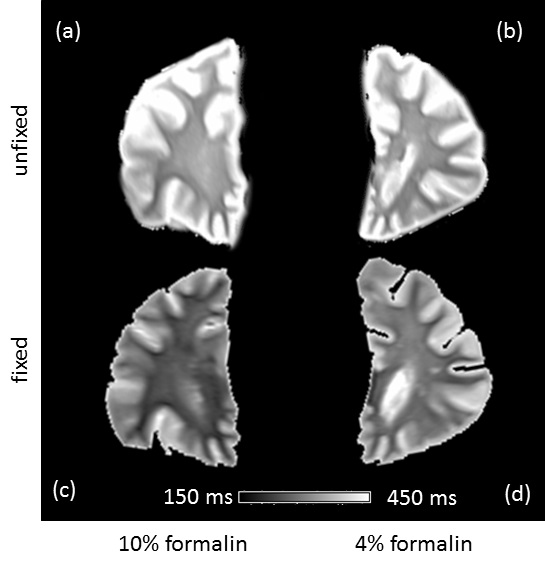
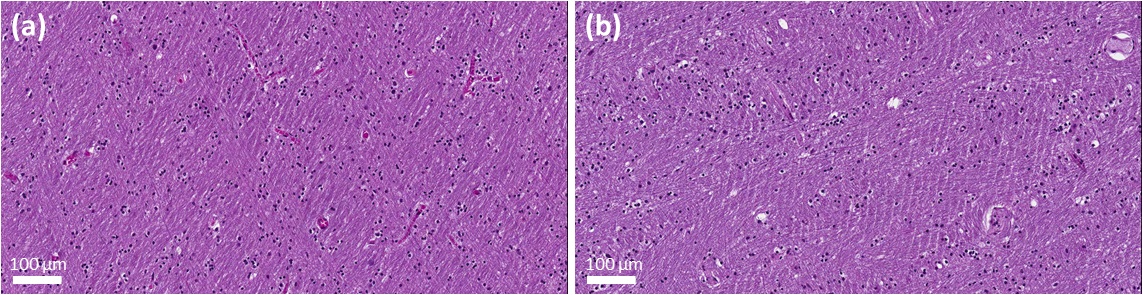
Quantitative MRI of formalin solutions from five different vendors and with different concentrations, was performed at 3T (Magnetom PRISMA, Siemens, Erlangen, Germany). For T1 relaxometry a turbo inversion recovery sequence (TE = 6.4 ms; TR = 8000 ms) with 6 inversion times (TI = 100, 200, 400, 800, 1600, 3200ms) was used. T2 relaxation time was determined using a turbo spin echo (TSE) sequence with three echo times (TE = 10, 73, 115 ms; TR = 4000 ms). T2* relaxation time was mapped using a 2D RF spoiled gradient echo sequence with six equally-spaced-echoes (TE1 = 4.92 ms, ΔTE = 4.92 ms; TR = 300 ms, flip angle = 15°; NSA = 5). To assess paramagnetic components of formalin, temperature dependent R2* relaxometry from four selected formalin solutions (4% and 10% formalin of two different vendors) was acquired6. To investigate the influence of formalin concentrations on MR relaxation times, relaxometry of four 10 mm thick coronal brain slices (mean age at death = 73 years, 50% females) was performed in unfixed condition and after entire fixation (22 days) with 4% and 10% formalin of the same vendor (vendor C). To assess histological differences, two white matter regions were excised from each brain sample and stained with haematoxylin and eosin (HE).Results
Relaxometry of the formalin solutions revealed moderate differences in T1 (not shown). T2 and T2* of pure formalin solutions showed substantial differences which depended both on the formulation (vendor) and concentration of formalin solution (Figure 1). Temperature dependent R2* measurements demonstrated a paramagnetic behavior (indicated by higher slope) of formalin, which was concentration dependent and differed between vendors (Figure 2). When using 4% formalin from the same vendor to fixate brain tissue the decreases in relaxation times of WM compared to the unfixed tissue were as follows: T1 30%, T2 20% and T2* 14%. After 10% formalin fixation the decreases were: T1 52%, T2 38% and T2* 36% (Figure 3). In line with the observed relaxation time reduction, HE stained tissue showed a more compact appearance after 10% formalin fixation compared to 4% fixation (Figure 4).Discussion and Conclusion
Vendor and concentration specific differences of formalin solutions are both strongly affecting relaxation times in post-mortem MRI of human brain tissue. Our results demonstrate that the decrease of all MR relaxation times in human brain tissue is approximately 2-times stronger after 10% compared to 4% formalin fixation. Most likely this effect comes from a higher degree of crosslinking of proteins, which was indicated by HE staining. A different rate of T1 decrease after 4% formalin fixation was reported in a previous study3 compared to this work. Both studies utilized the same T1 mapping in comparable specimens, but used formalin from different vendors. Since the formaldehyde concentration was constant across vendors, further studies are needed to investigate the composition of the formalin buffer and its magnetic properties. Thus, our results suggest, that the influence of formalin composition has a higher impact in post-mortem MRI studies than expected.Acknowledgements
No acknowledgement found.References
1. Fox CH, Johnson FB, Whiting J, Roller PP. Formaldehyde fixation. J. Histochem. Cytochem. 1985;33:845–853. doi: 10.1177/33.8.3894502.
2. Pfefferbaum A, Sullivan E V, Adalsteinsson E, Garrick T, Harper C. Postmortem MR imaging of formalin-fixed human brain. Neuroimage 2004;21:1585–1595. doi: 10.1016/j.neuroimage.2003.11.024.
3. Birkl C, Langkammer C, Golob-Schwarzl N, Leoni M, Haybaeck J, Goessler W, Fazekas F, Ropele S. Effects of formalin fixation and temperature on MR relaxation times in the human brain. NMR Biomed. 2016;29:458–465. doi: 10.1002/nbm.3477.
4. Dawe RJ, Bennett DA, Schneider JA, Vasireddi SK, Arfanakis K. Postmortem MRI of human brain hemispheres: T2 relaxation times during formaldehyde fixation. Magn Reson Med 2009;61:810–8. doi: 10.1002/mrm.21909.
5. Raman MR, Shu Y, Lesnick TG, Jack CR, Kantarci K. Regional T 1 relaxation time constants in Ex vivo human brain: Longitudinal effects of formalin exposure. Magn. Reson. Med. 2016;0:n/a-n/a. doi: 10.1002/mrm.26140.
6. Birkl C, Langkammer C, Krenn H, Goessler W, Ernst C, Haybaeck J, Stollberger R, Fazekas F, Ropele S. Iron mapping using the temperature dependency of the magnetic susceptibility. Magn. Reson. Med. 2015;73:1282–8. doi: 10.1002/mrm.25236.
Figures