1925
Direct Assessment of Magnetization Transfer Effects with T1 qMRIMitchell Horn1, Ning Hua1, Stephan Anderson1, and Hernan Jara1
1Boston University, Boston, MA, United States
Synopsis
Purpose: To measure inaccuracies on T1 qMRI caused by magnetization transfer effects that are inherent to MRI pulse sequences. Methods: The mixed-TSE pulse sequence was used at several RF power levels to image a series of agarose gels, sucrose solutions, and Gd solutions. Results: Measured T1s are increasingly underestimated as a function of increasing semisolid pool size and RF power level. Conclusion: Uncorrected magnetization transfer effects can cause large underestimation of T1 measurements in tissue imaged with RF intensive pulse sequences. This work could have implications for the design of more accurate qT1 mapping algorithms.
Introduction
Magnetization transfer (MT) effects are known to reduce the apparent T1s of tissue –particularly tissues with significant semisolid pools such as white matter (WM)—when using RF-intensive MRI pulse sequences, such as with multislice T1-weighted turbo spin echo (TSE) sequences. The causal assumption being that the T1 recovery of WM is slowed down by MT effects caused by all RF pulses; in particular, by the off-resonance pulses interrogating the other slices of the package. To our knowledge, this theoretical prediction of the binary spin bath model (1) has not been demonstrated directly with T1 qMRI methods. The mixed-TSE pulse sequence (diagram in Fig. 1) can be used to map the proton density (PD) as well as the T1 and T2 relaxation times with a single acquisition, and can be implemented at various effective RF power levels (see legend Fig. 2) –specifically, as a single-slice, multi-slice acquisition, and different power levels of the initial inversion pulse--. The purpose of this work was to measure the T1 relaxation times of three fundamentally different aqueous substances –specifically, agarose gels, sucrose solutions, and Gd-DTPA solutions-- with mixed-TSE pulse sequences implemented at increasing RF power levels and to evaluate the resulting MT effects relative to the qT1 “gold standard” measurements performed with single slice serial inversion recovery (IR) with varying inversion times (TI).Materials and Methods
A multi-compartment phantom consisting of twenty-five plastic vials containing solutions of Gd-DTPA in distilled water, sucrose in distilled water, and agarose gels prepared with distilled water, was constructed (Fig. 3). The vials were positioned in rows sequentially of 4% agarose gel to reduce vibration effects during scanning. All MRI scanning was performed using a 1.5T clinical scanner (Achieva, Philips Healthcare, Best, The Netherlands) using the quadrature body coil for RF transmission and a pair of surface coils (Flex-L) in phased array configuration for signal reception. The mixed-TSE pulse sequence generates four images per slice with different T1- and T2-weightings: the contrast control variables being two inversion times (TI1&2) and two effective echo times (TEeff1&2). Each TR-cycle of the mixed-TSE begins with and adiabatic inversion pulse, which can be implemented at two different power levels (pw1&2). Mixed-TSE scans were performed at five RF power levels (see Fig. 1 legend) with common parameters: TE1&2eff = 8/100ms, ETL = 16, TI1&2 = 700/7,438ms, TR = 14,875ms, matrix 176 x 176, voxel = 0.9 x 0.9 x 3mm3). The qT1 reference scans were single slice IR-TSE run serially at 18 TI values (ms): 25, 50, 75, 100, 200, 300, 400, 500, 600, 700, 800, 900, 1,000, 1,250, 1,500, 1,750, 2,000, and 3,000. The qT1 algorithms for mix-TSE and IR-TSE pulse sequences were programed in Mathcad (version 2001i, PTC, Needham, MA) and all measurements were performed using ROIs placed in qT1 maps (Fig. 3). Results: Main qT1 results are shown in Fig. 4 for agarose gels and in Fig. 5 for sucrose solutions. Observed MT T1 reduction effects were largest for highly concentrated agarose gels, markedly weaker for sucrose solutions, and negligible for Gd-DTPA solutions (not shown). MT T1 reductions effects were most pronounced for high RF power level acquisitions (i.e. 30 slices and high power inversion pulse) and correlated with RF power level (Figs. 4 and 5).Results
Main qT1 results are shown in Fig. 4 for agarose gels and in Fig. 5 for sucrose solutions. Observed MT T1 reduction effects were largest for highly concentrated agarose gels, markedly weaker for sucrose solutions, and negligible for Gd-DTPA solutions (not shown). MT T1 reductions effects were most pronounced for high RF power level acquisitions (i.e. 30 slices and high power inversion pulse) and correlated with RF power level (Figs. 4 and 5).Discussion
Accurate qT1 measurements are needed for standardization across platforms and for an increasing number of qMRI applications including Synthetic-MRI, structural studies of WM, and WM fibrography. In this work, we demonstrated direct T1 shortening effects caused by MT effects that correlate with increasing pulse sequence RF power level and are most pronounced for tissues with largest semisolid pools.Conclusion
Uncorrected magnetization transfer effects can cause large underestimation of T1 measurements in tissue imaged with RF intensive pulse sequences. This work could have implications for the design of more accurate qT1 mapping algorithms and for improving several applications that use qT1 measures such as Synthetic MRI, correlation time diffusion MRI, and MR Fibrography.Acknowledgements
No acknowledgement found.References
1. Henkelman RM, Huang X, Xiang QS, Stanisz GJ, Swanson SD, Bronskill MJ. Quantitative interpretation of magnetization transfer. Magn Reson Med 1993;29(6):759-766.Figures
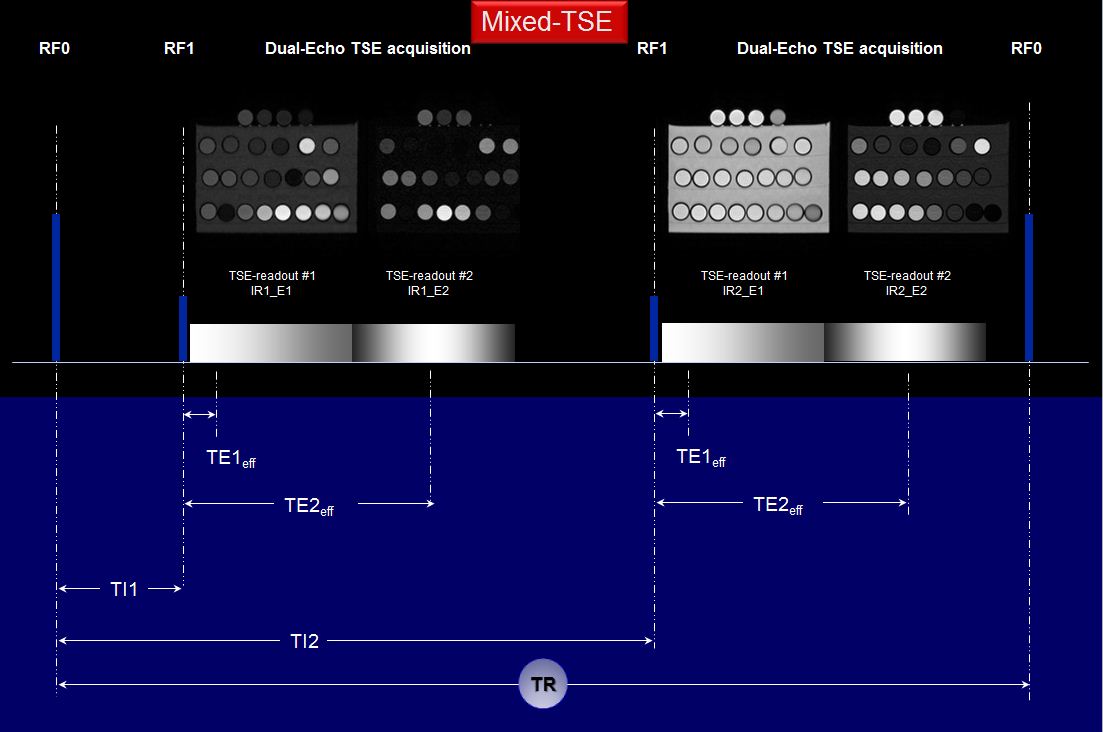
Figure 1. Mixed-TSE pulse sequence diagram: after an
initial (adiabatic) inversion pulse, two DE-TSE are run after delays TI1 and
TI2 thus leading to four differently weighted images per slice.
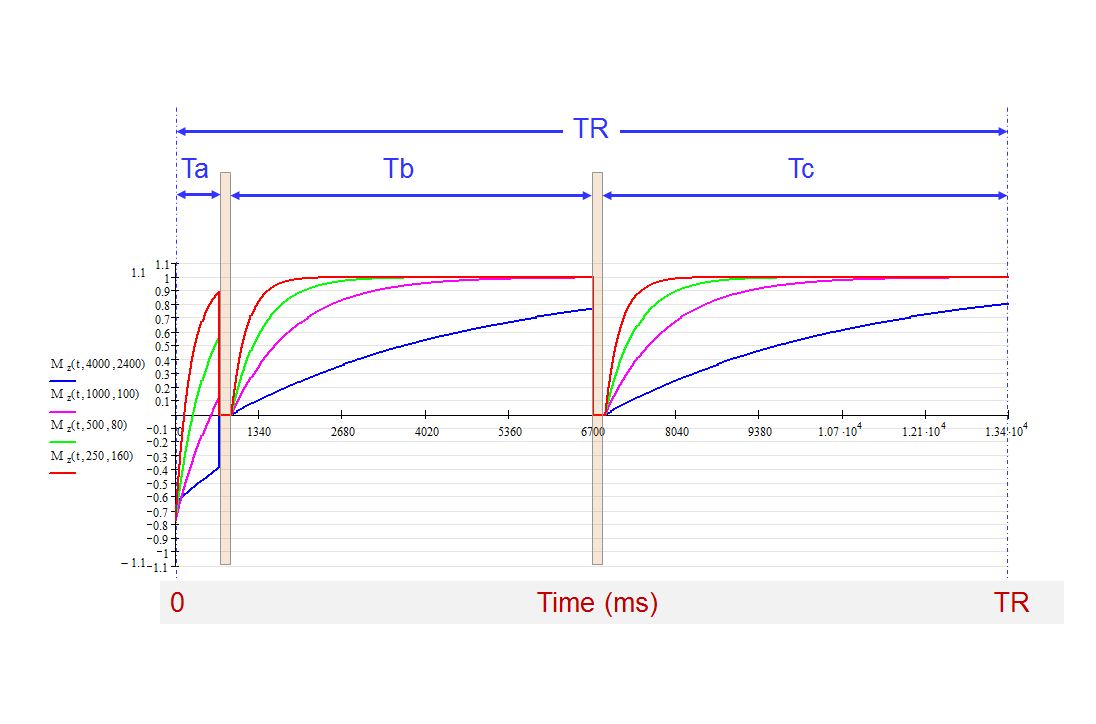
Figure 2. Longitudinal magnetization temporal evolution
during one TR cycle. There are three time intervals (Ta, Tb, and Tc) during
which the recovering longitudinal magnetizations can be affected by the
off-resonance RF pulses that are interrogating the other slices of the slice
package.
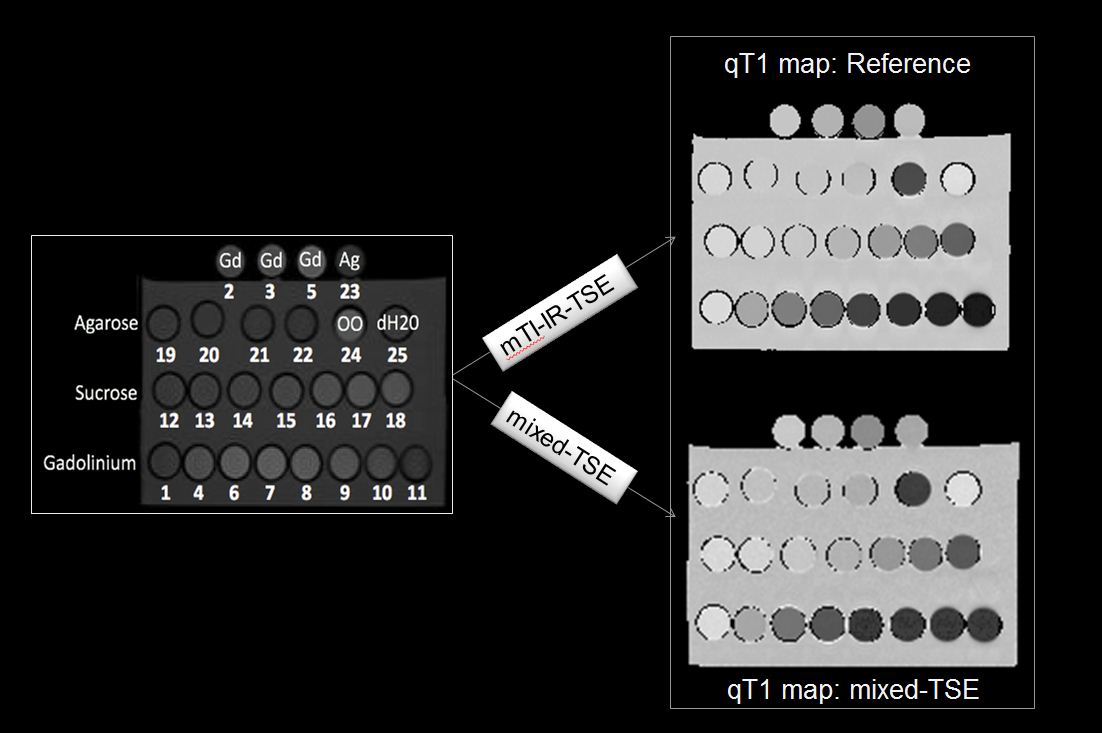
Figure 3. Examples of qT1 maps: mixed-TSE vs. multi-TI
IR-TSE. Phantom layout: 15 mL solutions of distilled water and 0.075, 0.5,
1.25, 1.95, 3.27, 5.7, 10.7, 35.7, 73.2, 148.2, and 298.2μL GD-DTPA from
commercial 0.5-M MultiHance stock. Sucrose solutions were prepared by means of
serial dilution of a master solution of 100 g of sucrose in 50 mL of distilled
water (5.843-M sucrose): the sucrose solutions were prepared as 67%, 50%, 33%,
20%, 11.3%, 5.9%, and 3% of the master solution, thus resulting in 3.914 M,
2.921 M, 1.928 M, 1.169 M, 0.660 M, 0.345 M, and 0.175 M water-sucrose solutions.
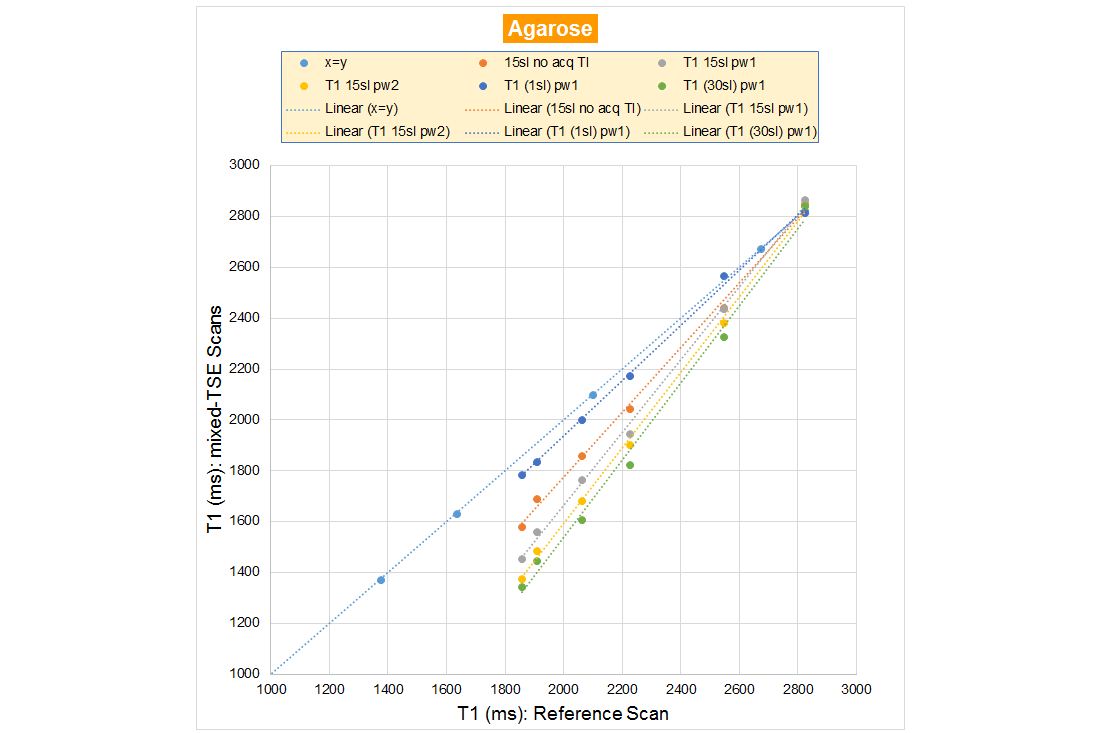
Figure 4. Apparent T1 vs.
reference T1 graph: agarose gels. The T1s obtained with the mixed-TSE pulse
sequence are significantly lower than the reference T1s. This T1 reduction
effect increases as a function of increasing agarose concentration and as
function of increasing off-resonance RF power.
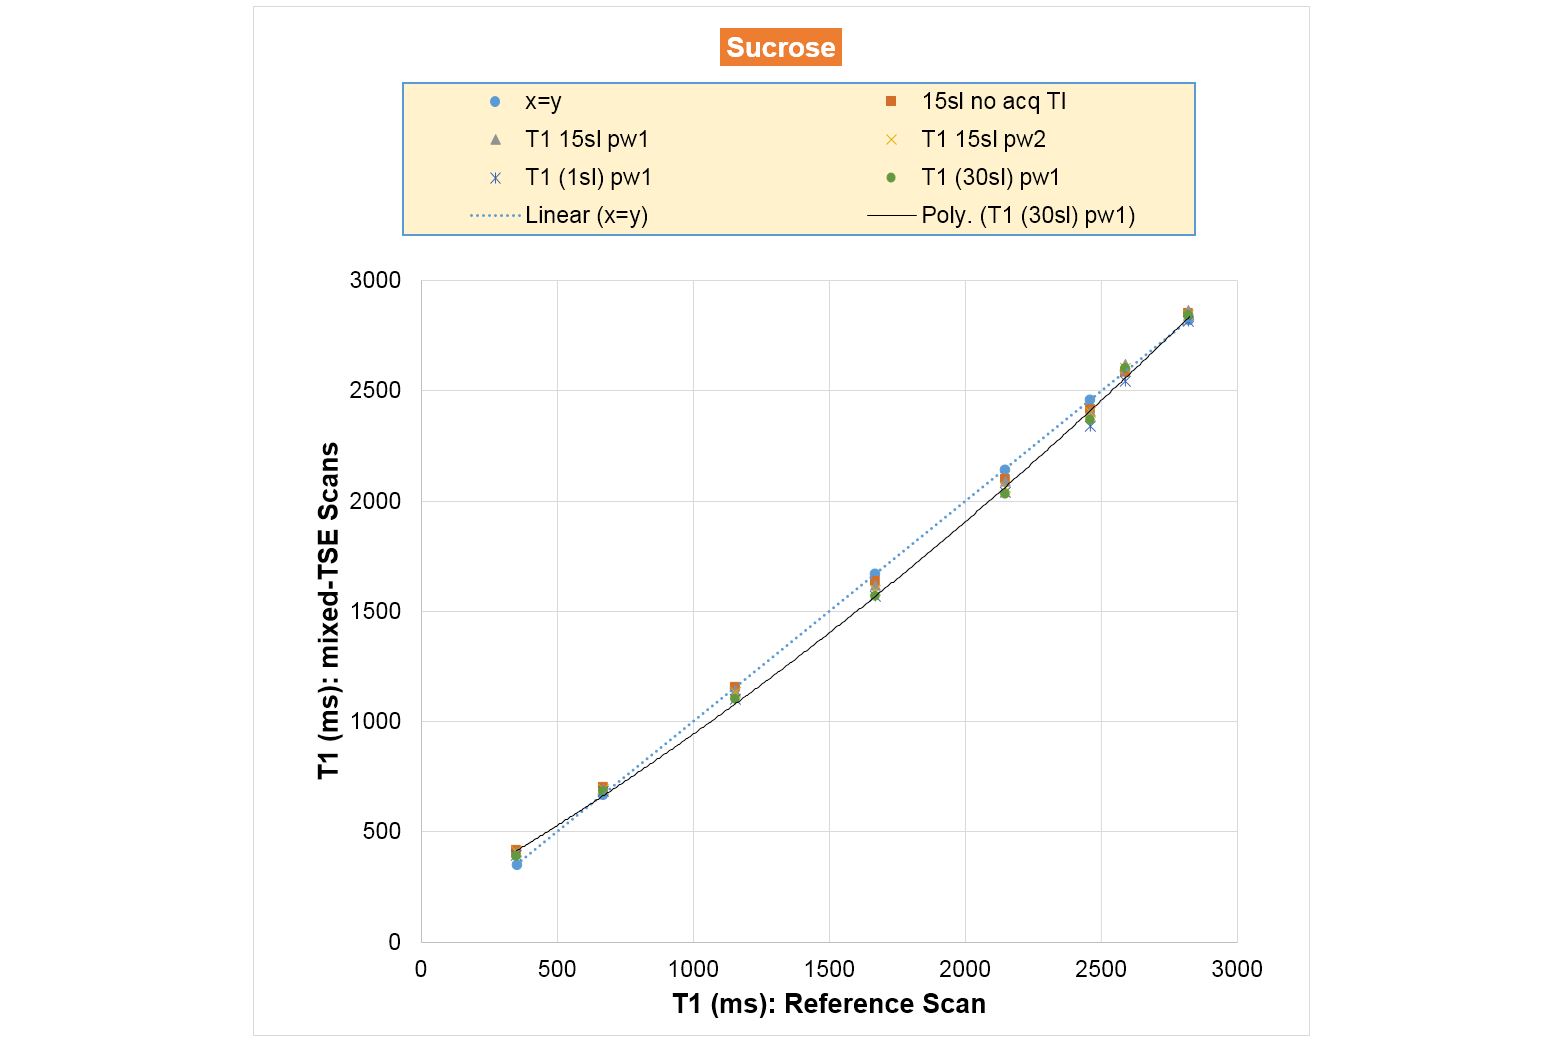
Figure 5. Apparent T1 vs.
reference T1 graph: sucrose solutions. The T1-reduction effects are weaker for
sucrose relative to agarose gels and peak at intermediate concentrations.