1923
Feasibility of using Active Contrast Encoding (ACE)-MRI for Assessment of Tumor Treatment Response1Center for Advanced Imaging Innovation and Research (CAI2R), Dept. Radiology, NYU School of Medicine, New York, NY, United States
Synopsis
Active Contrast Encoding MRI (ACE-MRI) is a recently proposed method to conduct DCE-MRI experiment without the need to perform separate T1 and B1 measurement. The purpose of this study is to further investigate the feasibility of using the ACE-MRI method for evaluation of tumor treatment response in a mouse model of breast cancer. The results of the ACE-MRI method were compared with conventional DCE-MRI data analysis with separately measured T1 maps. Our preliminary results demonstrate that the ACE-MRI method can be used to evaluate tumor treatment response reliably.
Purpose
T1-weighted dynamic contrast enhanced magnetic resonance imaging (DCE-MRI) has been widely used to probe tumor microenvironment using kinetic model parameters, such as transfer constant Ktrans and extracellular space volume fraction ve,. Quantitative analysis of DCE-MRI data using a contrast kinetic model requires separate measurement of pre-contrast T1 and RF transmit field B1. Recently, an alternative approach, referred to as Active Contrast Encoding MRI (ACE-MRI), was introduced to eliminate the need to perform separate T1/B1 measurement. ACE-MRI actively encodes the slow washout phase of post-contrast time-intensity curve using multiple flip angles and TRs which give different T1 and B1 weighting on the signal intensity. It was demonstrated that such actively-encoded time-intensity curves can be used to estimate T1 and B1 which then can be used for subsequent contrast kinetic model anlaysis. The purpose of this study is to further investigate the feasibility of using the ACE-MRI method for evaluation of tumor treatment response in a mouse model of breast cancer. The results of the ACE-MRI method were compared with conventional DCE-MRI data analysis with separately measured T1 maps.Methods
4T1 breast cancer tumor cells were injected into the flank of six-eight week old BALB/c mice (n=6, female) under anesthesia. Each mouse was scanned twice; first at post injection day 10~13 for pre-treatment and second scan 2 days after treatment. For the treatment group (n=3), pre-treatment MRI was followed by bevacizumab (10mg/kg) on the first day, 5FU (80mg/kg) on the second day, and post-treatment MRI on the third day. The control group (n=3) was treated with sodium chloride solution (0.01ml/g) on the first day and the second day along with the two MRI scans at the same time points as the treatment group. A 7T horizontal bore magnet with a volume transmit and receive coil was used. General anesthesia was induced by 1.5% isoflurane in air. The animals were mounted on a cradle with respiratory and temperature monitoring probes. Data Acquisition: A 3D FLASH sequence was used to minimize the flow effect (TR/TE=12 and 3.83ms, image matrix = 100x66x9, resolution = 0.15x0.15x1 mm3). This sequence was run to acquire 78 3D images for about 10 min with multiple flip angles (10o, 20o, 5o, 10o, 30o, 2o, 10o, 80o(TR=100ms), 10o) and different number of repetitions (40, 5, 5, 5, 5, 5, 5, 3, 5). Temporal resolution was 5.4s for small flip angles and 45s for 80o flip angle. A bolus of 10 mM Gd-DTPA in saline, corresponding to dose 0.1 mmol/kg, was injected through a tail vein catheter, starting 1 min after the acquisition of pre-contrast images. T1 was separately measured using RARE-VTR sequence available on the Bruker system. Data Processing: For ACE-MRI, B1 and pre-contrast T1 were estimated from the washout region of the ACE-MRI curve as described in previous studies.1,2 Tofts model3 was used to estimate Ktrans and ve with the estimated T1/B1. For conventional DCE-MRI analysis, the data collected with the baseline protocol (flip angle 10o) were used, together with independently measured pre-contrast T1 (B1 assumed to be 1). Arterial input function was generated with a reference tissue approach4 with assumed muscle parameters Ktrans=0.11 min-1 and ve=0.20.Results
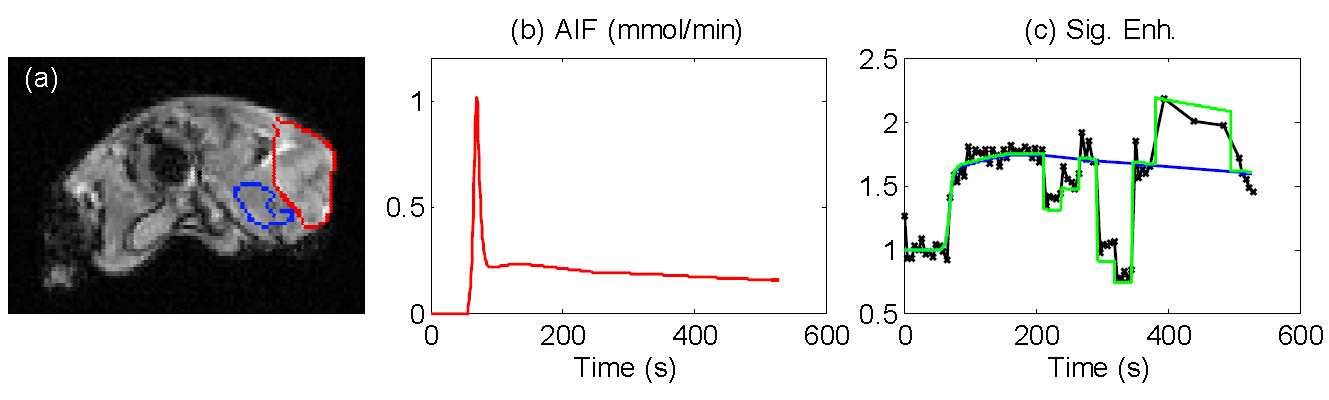
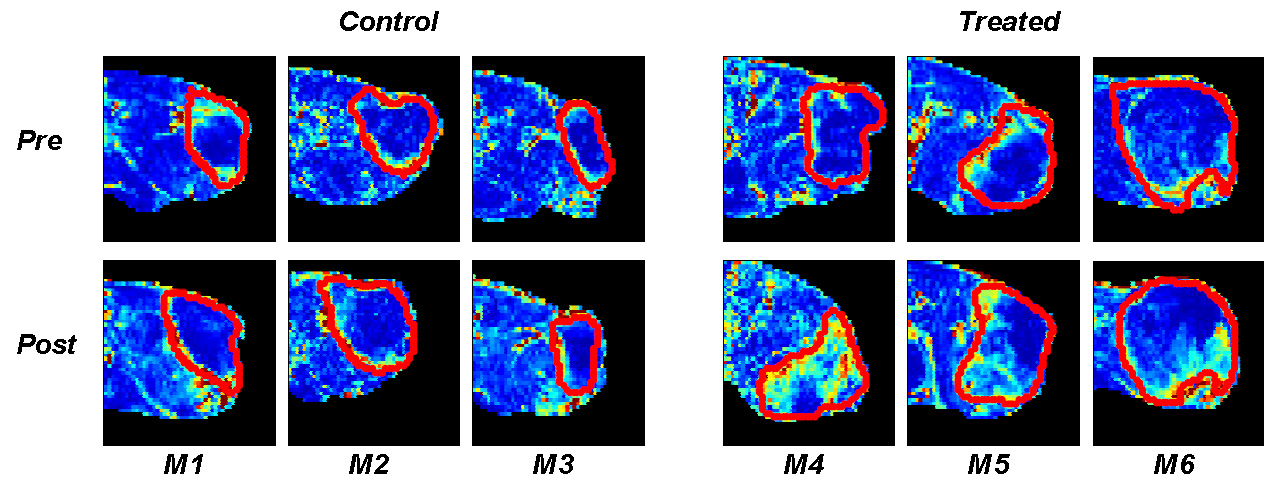
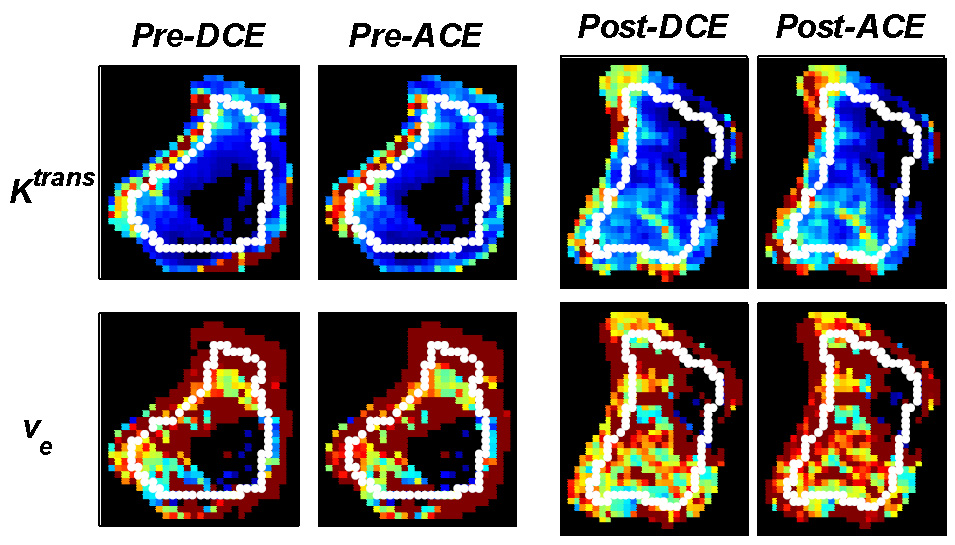
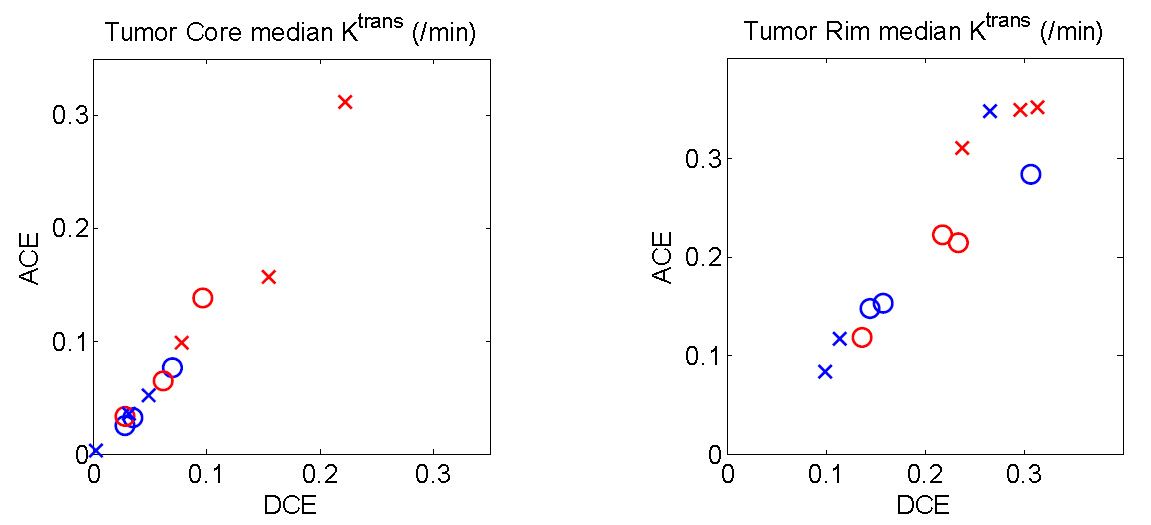
Figure 1 shows a representative AIF function and ACE-MRI time-intensity curve which shows step changes in the washout phase due to active encoding of T1 and B1. Figure 2 shows tumor treatment response in terms of initial area under the curve (IAUC) for the six mice with the manually selected tumor ROI. Each tumor ROI was eroded by 4 pixels to generate a smaller ROI for the tumor core region. The regions in between whole ROI and core ROI are assumed to be tumor rim. It is noticeable that the treatment induced increase of IAUC in the core region for treated group. Figure 3 shows comparison of the contrast kinetic parameters, Ktrans and ve, between ACE-MRI and DCE-MRI. Overall, the kinetic parameters estimated by ACE-MRI match well with those by DCE-MRI with separate T1 measurement. Figure 4 shows comparisons of the Ktrans values measured by both methods. Signed rank tests showed no significant difference between the kinetic model parameters measured by ACE-MRI and DCE-MRI.Discussion and Conclusion
Our preliminary results demonstrate that the ACE-MRI method can be used to evaluate tumor treatment response without the need to measure T1 and B1 separately. Future study is warranted to investigate the tumor treatment evaluation using ACE-MRI for larger cohort animals along with histological validation.Acknowledgements
NIH 1 R01 CA160620 / NIH P41 EB017183References
1.Zhang J, Kim SG. Simultaneous measurement of pharmacokinetic model parameters and T1/B1 using Active Contrast Encoding MRI. ISMRM 2014
2.Zhang J, Winters K, Kim SG. In vivo cross-validation study of contrast kinetic model analysis with simultaneous B1/T1 estimation. ISMRM 2015
3.Tofts PS, Brix G, Buckley DL, et al. Estimating kinetic parameters from dynamic contrast-enhanced T1-weighted MRI of a diffusable tracer: standardized quantities and symbols. J Magn Reson Imaging 1999;10(3):223-232.4.
4.Kovar DA, Lewis M, Karczmar GS. A new method for imaging perfusion and contrast extraction fraction: input functions derived from reference tissues. J Magn Reson Imaging 1998;8(5):1126-1134.
Figures