1922
Feasibility study of a Dialyzer as a multi-compartment Perfusion Phantom for microvascular tracer kinetic Modelling1Computer Assisted Clinical Medicine, Medical Faculty Mannheim, Heidelberg University, Mannheim, Germany
Synopsis
Dynamic contrast enhanced MRI combined with tracer kinetic modelling allows for the determination of quantitative perfusion parameters. To achieve standardized examinations and data analysis, phantoms are employed to investigate the reproducibility of perfusion parameters by imitating tissue on capillary level. In this study we used a dialysis filter with a semipermeable membrane of the fibers which enables the simulation of two compartment kinetics and can thus serve as imitation of capillaries and interstitium which might be closer to the anatomical conditions.
Introduction
Dynamic
contrast enhanced (DCE)-MRI combined with tracer kinetic modelling allows for the
determination of quantitative perfusion parameters. However, in clinical
routine, reproducibility and comparison of these parameters is difficult due to
non-standardized examinations and data analysis1. Therefore, phantoms
are employed to investigate the reproducibility of perfusion parameters by
imitating tissue on a capillary level. Compared to previously presented
phantoms modelling solely the capillaries2, in this study we propose
to use a dialysis filter that has a semipermeable capillary membrane which can
be crossed by MR-contrast agent (CA). This way, a dual-compartment model that
depicts anatomical conditions more accurately can be realized.Materials and Methods
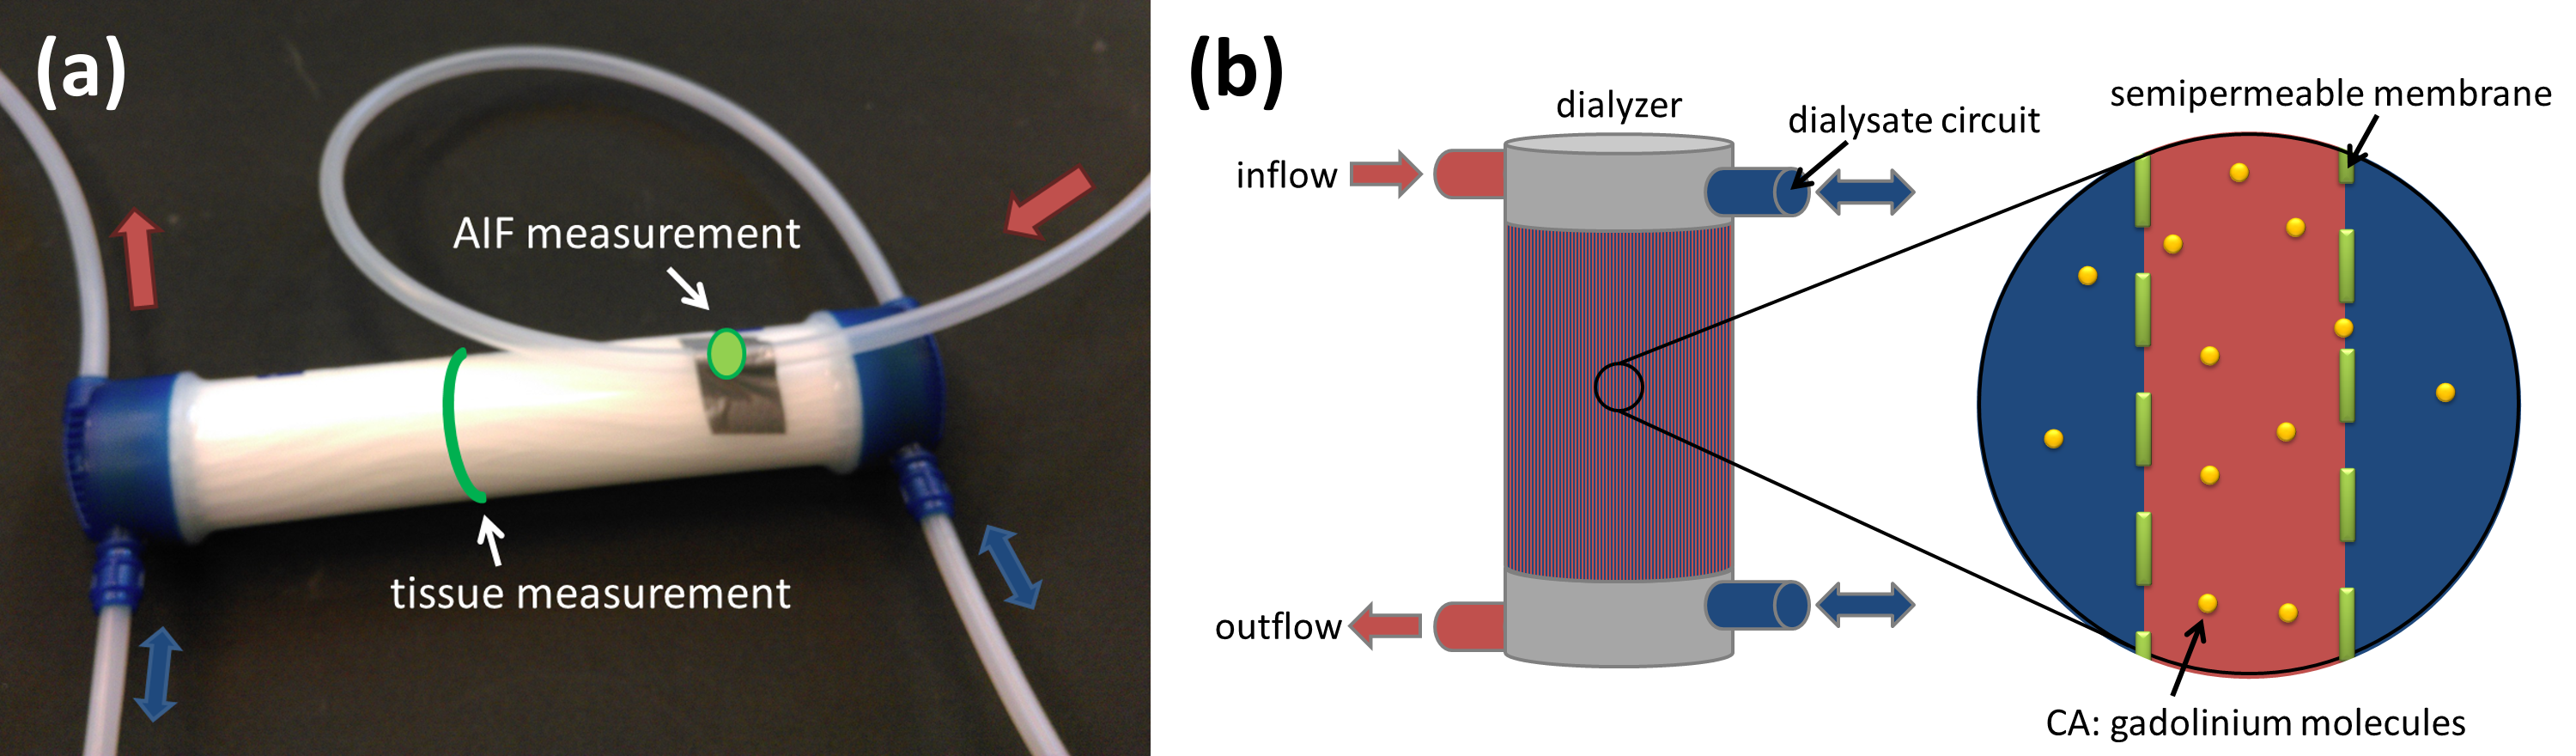
Phantom
A dialysis filter (Helixone FX 800, Fresenius Medical Care, Germany) was used to imitate tissue characteristics with fibers (diameter = 200 µm) close to the capillary size. The construction principle of the dialyzer enables the transfer of CA through a semipermeable membrane (pore diameter = 1.8 nm) from within the fibers to the surrounding space and thus provides two compartments (Fig. 1). Water and automatically injected CA (Dotarem®, Guerbet, France, (1 ml CA and 10 ml NaCl)) were pumped through the phantom with an injection rate of 1 ml/s. Velocities ranging between 12 and 20 ml/s, corresponding to typical blood flow velocity in larger human arteries3, were chosen for this study. A tube in front of the phantom inlet served as an artificial artery where the first pass of CA signal was measured and used to determine the (arterial) input function (AIF).
Imaging Protocol
Imaging was performed at a 3T scanner (Magnetom Skyra, Siemens Healthcare Sector, Erlangen, Germany), using a 3D-TWIST sequence with a temporal resolution of 2 s, total acquisition time of 100 s and parameters TR/TE/FA=1.44ms/15ms/15°, #slices=6, slice thickness=2mm, matrix 128*88, FOV 100mm*68mm. Three setups were tested during this study. Setup 1: To demonstrate the ability of gadolinium molecules to cross the membrane, CA present in the tube fibers was washed out by a counter flow of water through the dialysate circuit. Setup 2: In- and outflow only passing through the fiber circuit was tested. Setup 3 combined both previous settings to realize two compartments. An additional flow through the dialysate compartment in same- and counter direction was incorporated.
Analysis
Perfusion analysis was performed using an in-house developed OsiriX plugin4. For calculation of the perfusion parameters, the one-compartment model (1CM) and the two-compartment uptake model (2CUM) were compared. Clearance data recorded in setup 1 was analyzed using Matlab 2015 (The Mathworks, Nattick, USA).
Results and Discussion
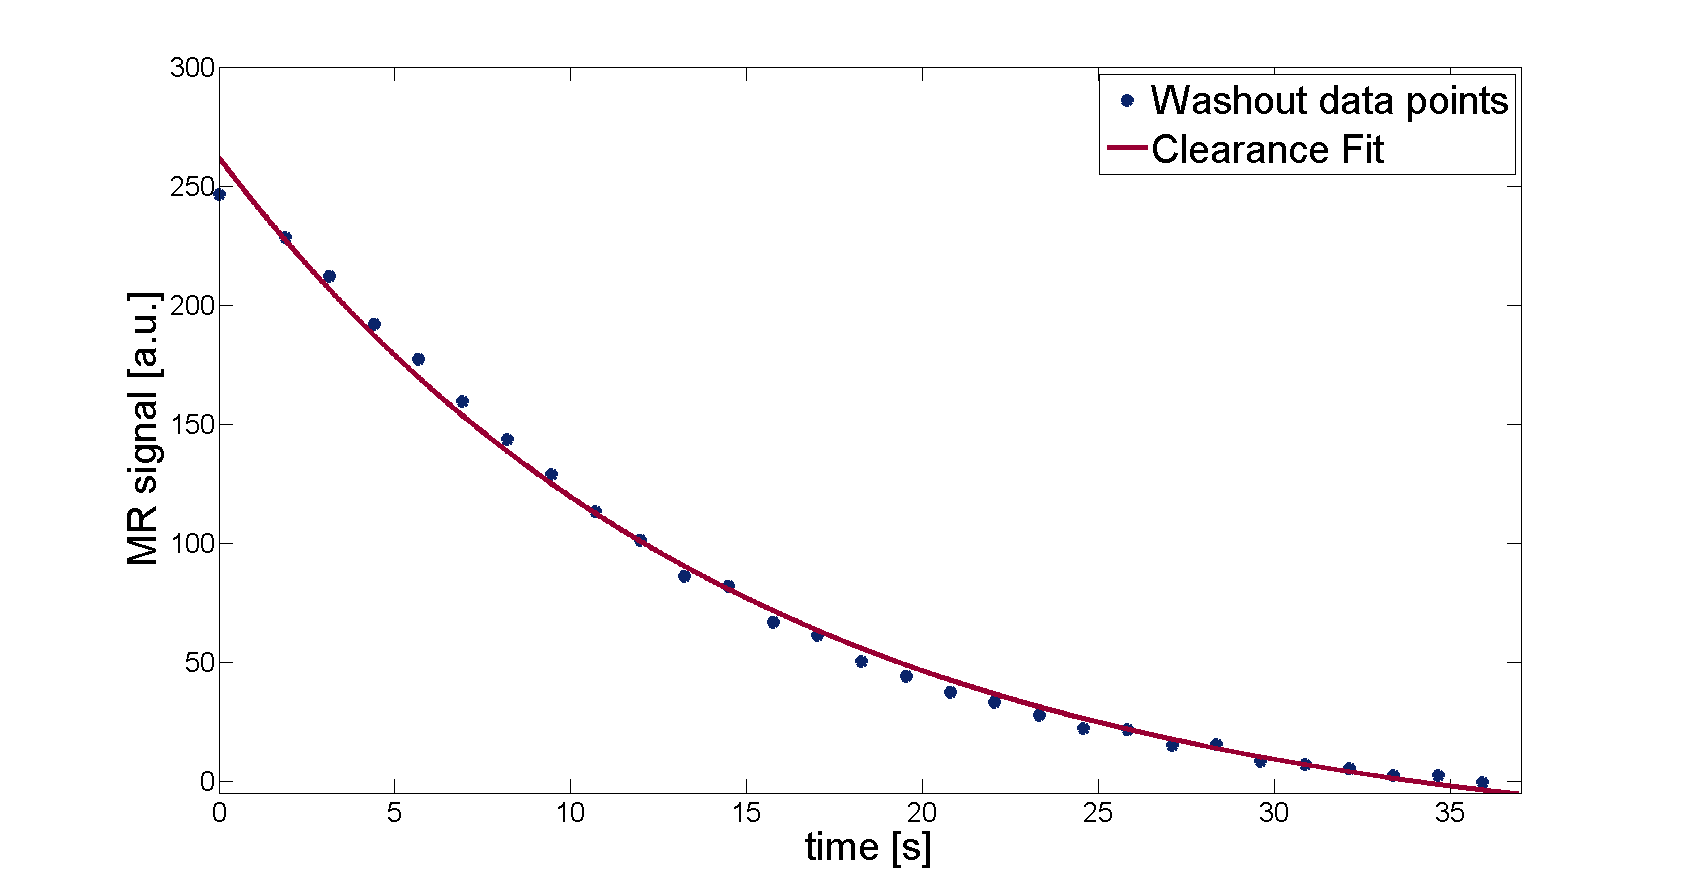
The measured MR signal of setup 1 shows the
transfer of CA from the fibers (t=0) into the surrounding space and subsequent
wash-out by the dialysate circuit (Fig. 2). The wash-out process follows a
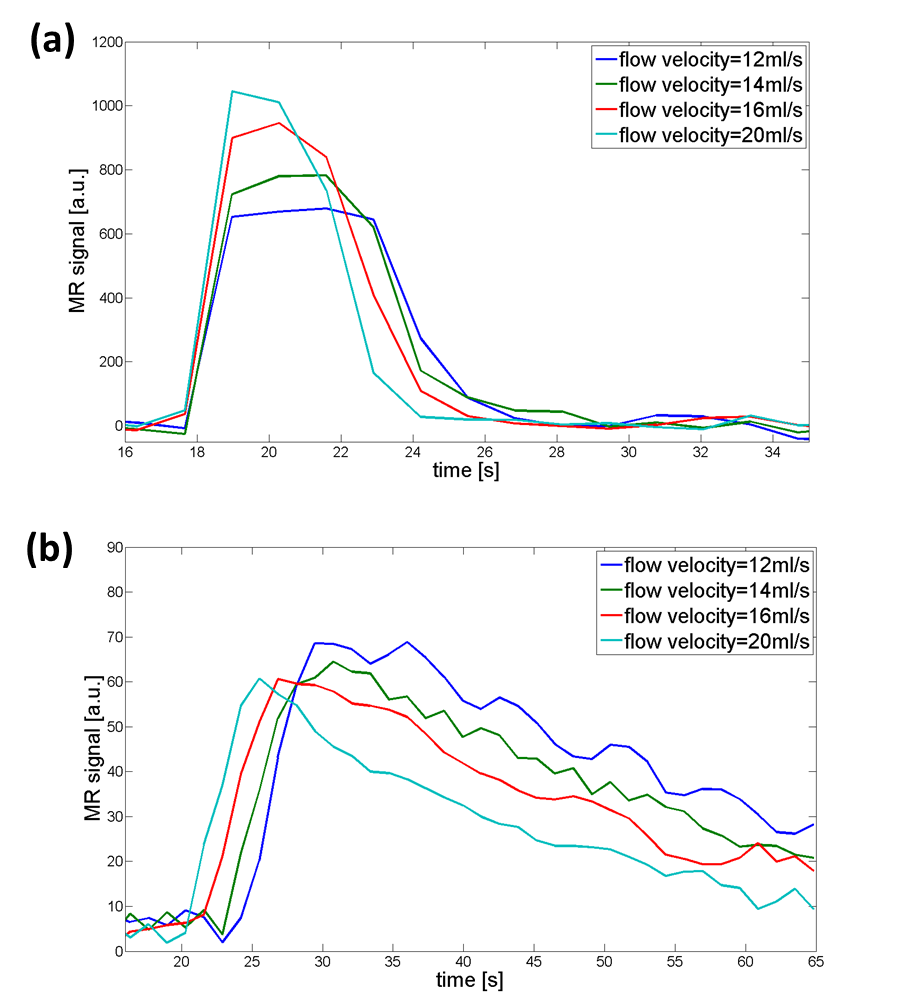
typical clearance function (clearance K=20 ml/min). The phantom generates AIFs and tissue functions
with characteristic first pass and typical wash-out slope for all tested flow
velocities. For lower velocities, curves start with a delay compared to higher
velocities and exhibit a broader distribution (Fig. 3). For the quantification
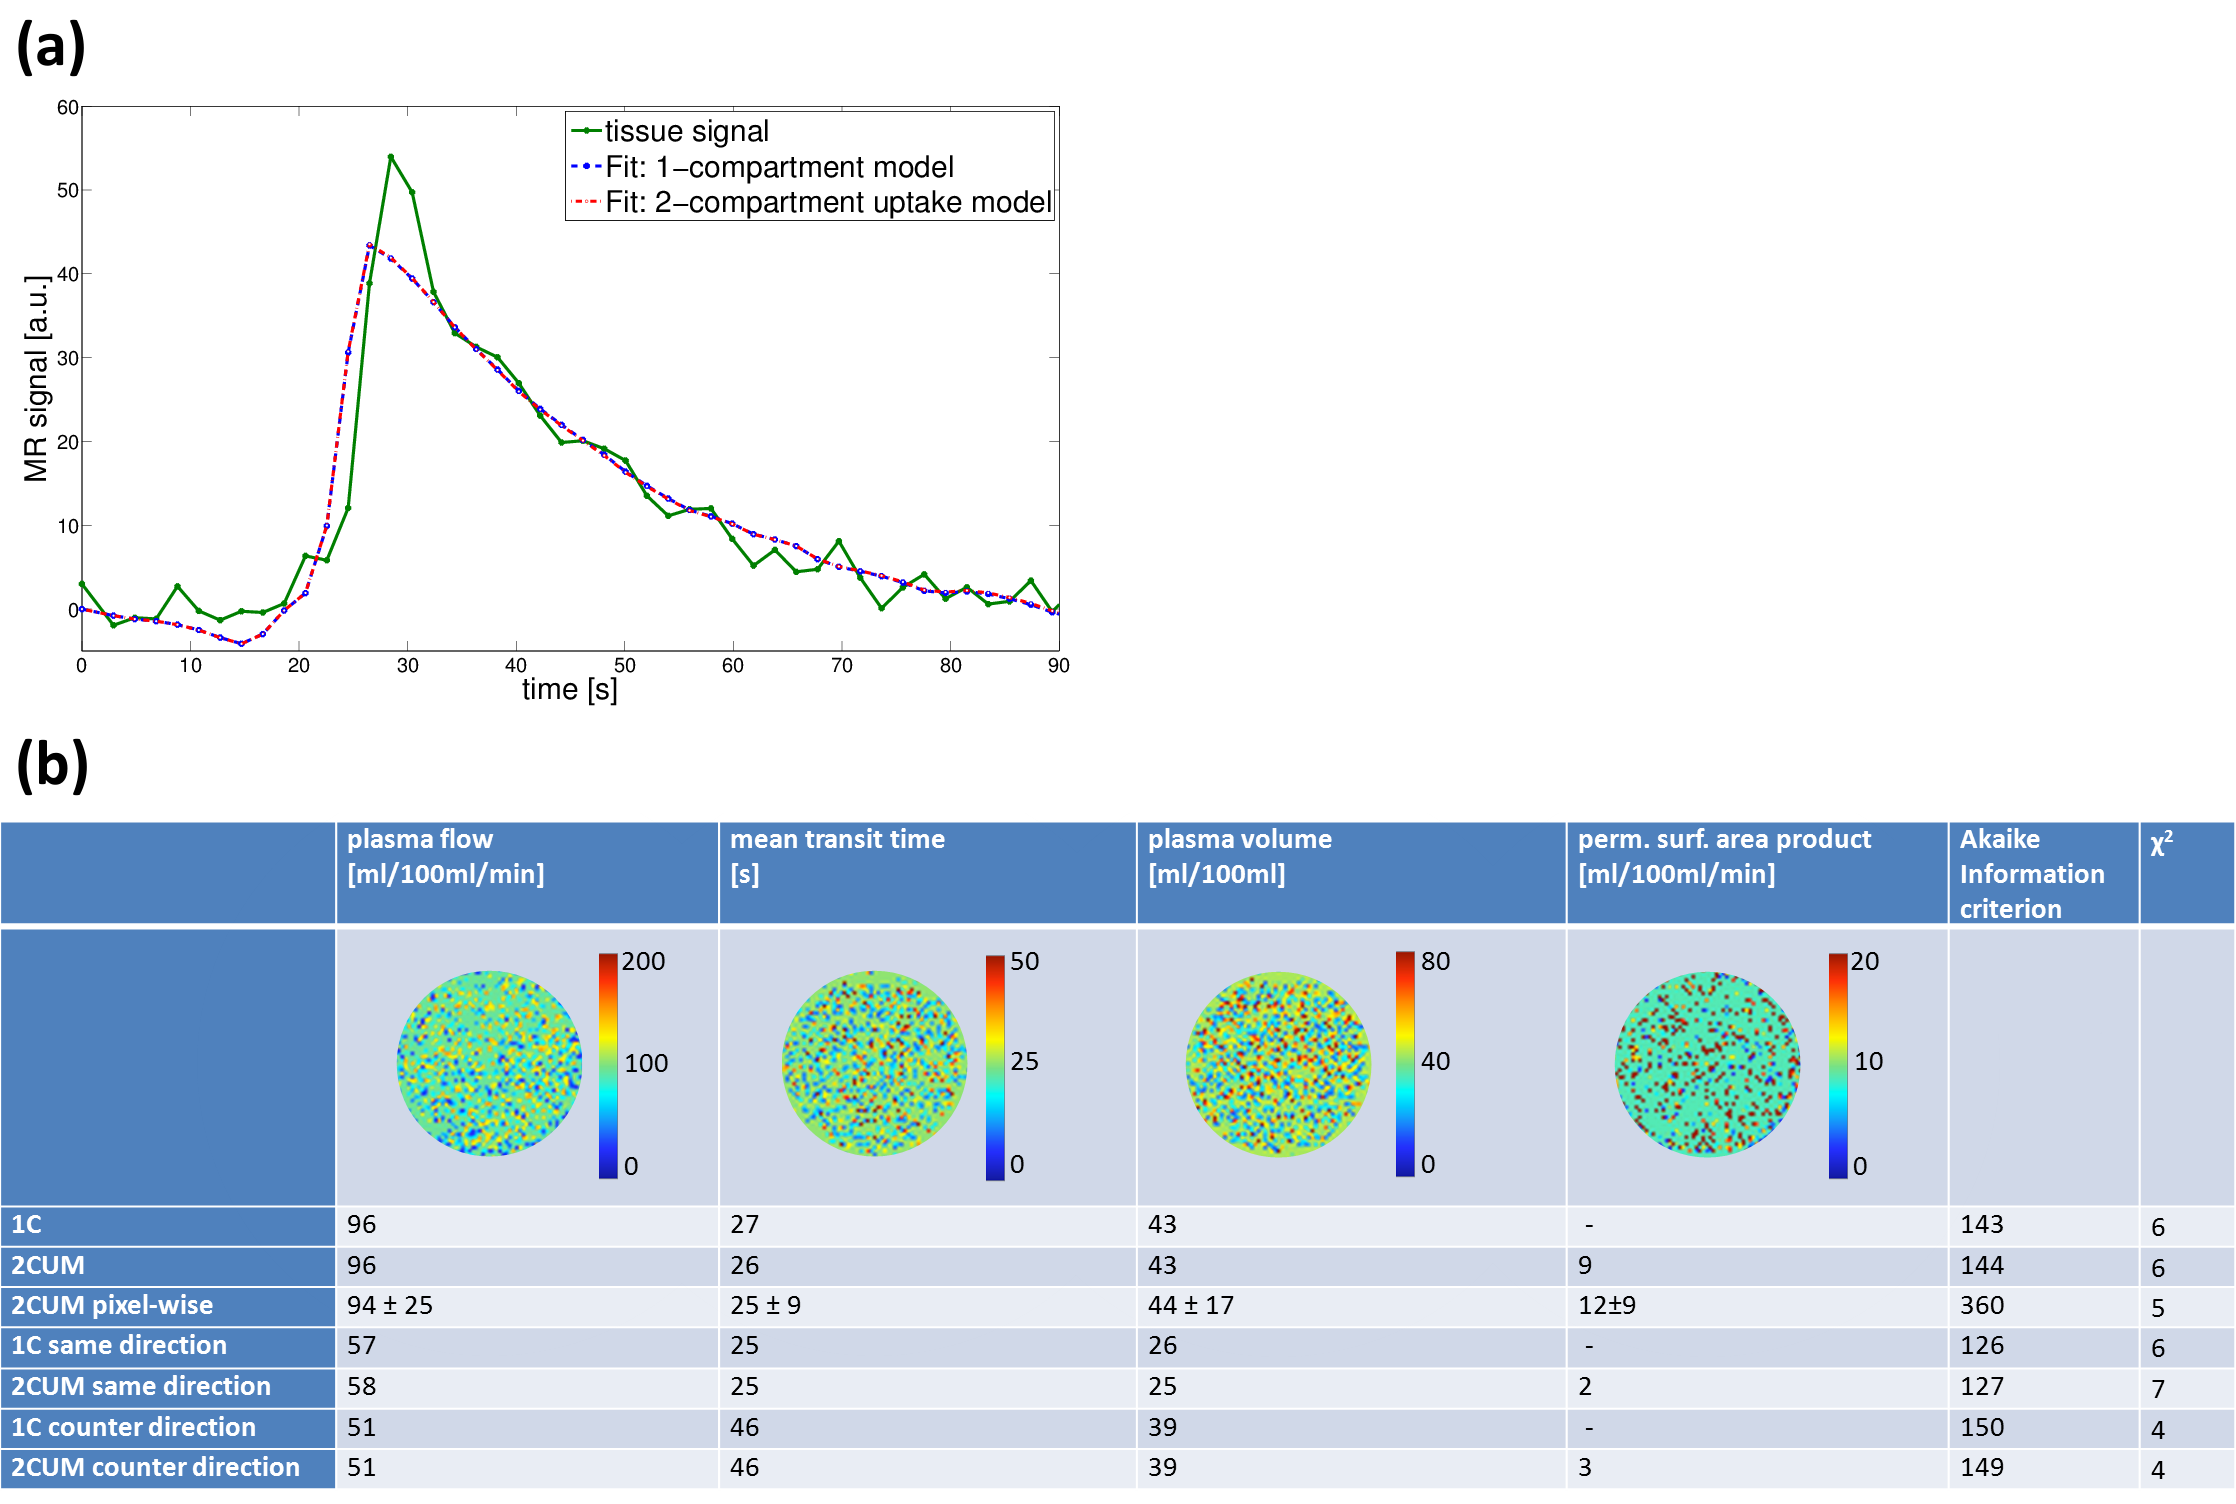
of setup 2 and 3, the 1CM and 2CUM were applied. Fit quality measured for both models
(Akaike information criterion and χ2) shows good and similar
results. Pixel-wise maps for plasma flow (PF), mean transit
time (MTT) and plasma volume (PV) reveal homogeneous results (Fig. 4a). The 2CUM
provides additional information about the extravasation of the CA into the
dialysate circuit where the permeability surface-area (PS) has been calculated.
Variability between the compartment models and between pixel-wise and ROI-based
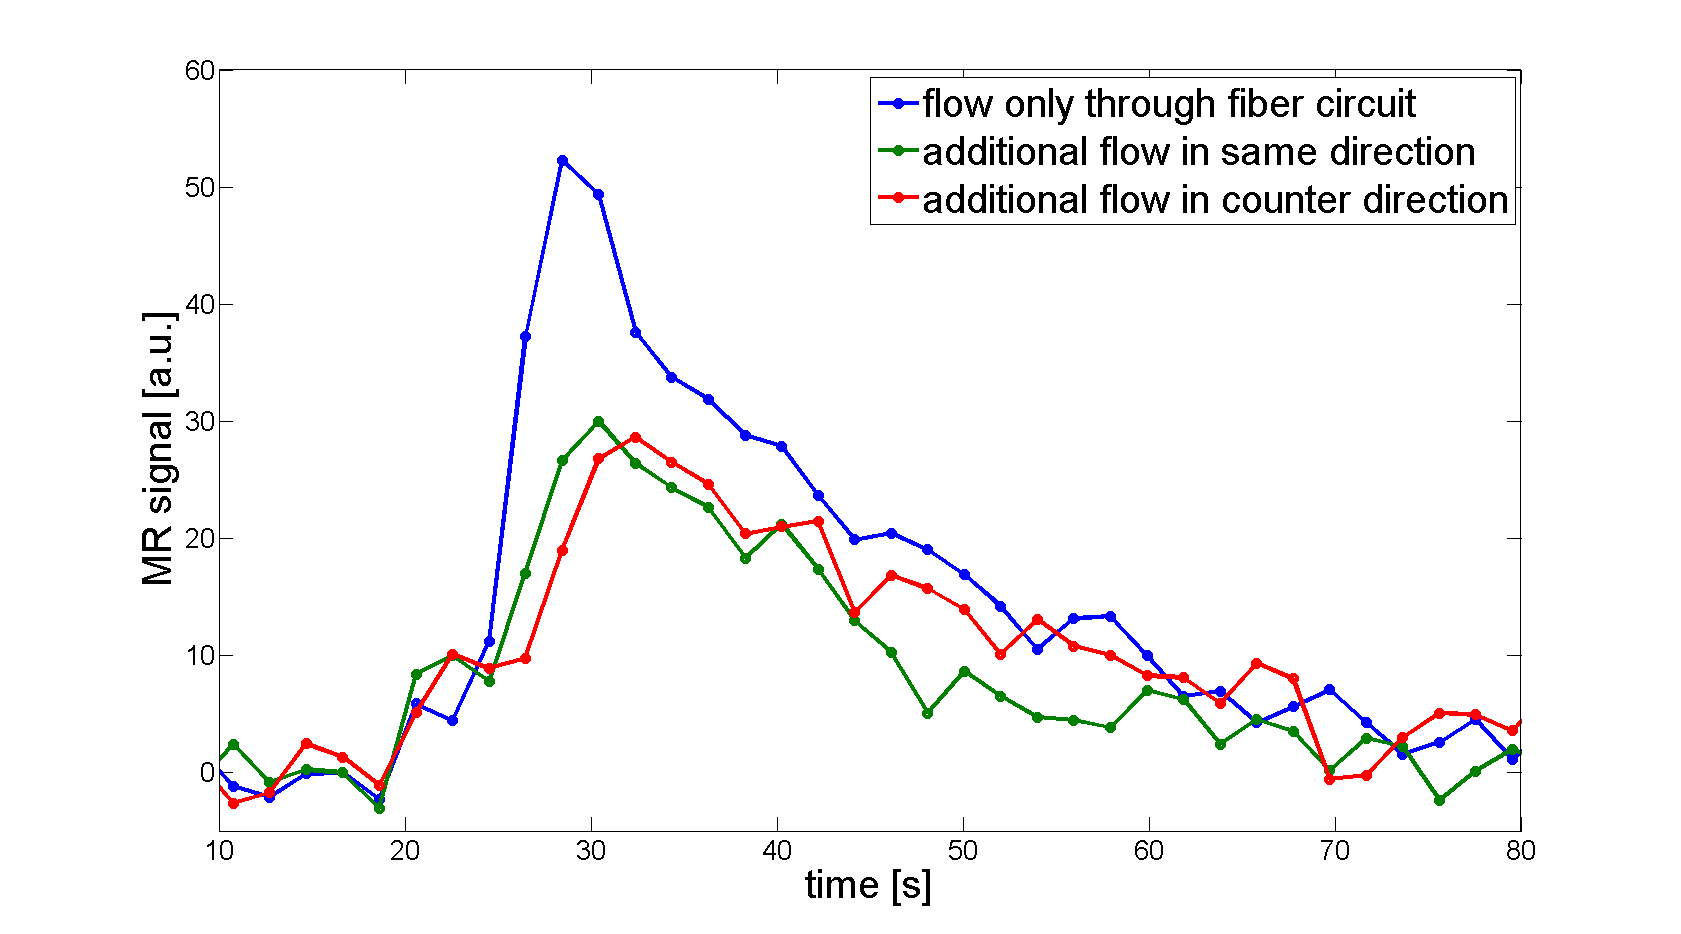
model is neglectable (Fig. 4b). Setup 3 showed identical effects for both additional flow in same
direction and counter direction. An additional flow in the dialysate circuit
leads to reduced signal and faster decay (Fig. 5). PF is reduced as well as the
extravasation parameter, MTT and PV show similar results compared to setup 2.Conclusion
The
initial findings of this study show that the perfusion phantom may serve as a
tissue mimicking device, able to produce typical signal curves for both AIF and
tissue function. The semipermeable membrane of the fibers enables the
simulation of two-compartment kinetics and can thus serve as imitation of
capillaries and interstitium as found in the human body. Quantitative perfusion
parameters were determined for two models, in which the 2CUM could provide
additional information about extravasation properties of the phantom capillaries.
Additional flow in the dialysate circuit could possibly be used as a model for
tumor tissue with high vascularization. The influences on PF and PS have to be
further examined in future as well as the development to a three-dimensional
setup with different tissue types.Acknowledgements
This research project is part of the Research Campus M²OLIE and funded by the German Federal Ministry of Education and Research (BMBF) within the Framework “Forschungscampus: public-private partnership for Innovations” under the funding code 13GW0092D.References
[1] F. Zöllner, T. Gaa, F. Zimmer, M. Ong, P. Riffel, D. Hausmann, S. Schoenberg and M. Weis. Quantitative Perfusion Imaging in Magnetic Resonance Imaging. Radiologe, 2016, 56 (2), pp.113-123
[2] Kompan et al. (2015). A Simple and Cheap Perfusion Phantom, Proc. Intl. Soc. Mag. Reson. Med. 23
[3] Nichols, Wilmer W., Michael F. O'Rourke, and M. McDonald’s. "Blood flow in arteries." Lea and Fiberger, Philadelphia, PA (1990): 270-281.
[4] F. Zöllner, M. Daab, S. Sourbron, L. Schad, S. Schoenberg and G. Weisser. An open source software for analysis of dynamic contrast enhanced magnetic resonance images: UMMPerfusion revisited. BMC Med Imaging, 2016, 16 (7), pp.1-13
Figures