1921
Assessment of hydrodynamics and T2 alterations in spontaneously hypertensive rat under short-term hyperhydration1Biomedical Engineering and Environmental Science, National Tsing Hua Unerversity, Hsinchu, Taiwan, 2Nuclear Medicine, Chang Gung Memorial Hospital, Taoyuan, Taiwan, 3Graduate Institute of Applied Physics, National Chengchi University, Taipei, Taiwan, 4Department of Radiology, Taipei Medical University Hospital, Taipei, Taiwan
Synopsis
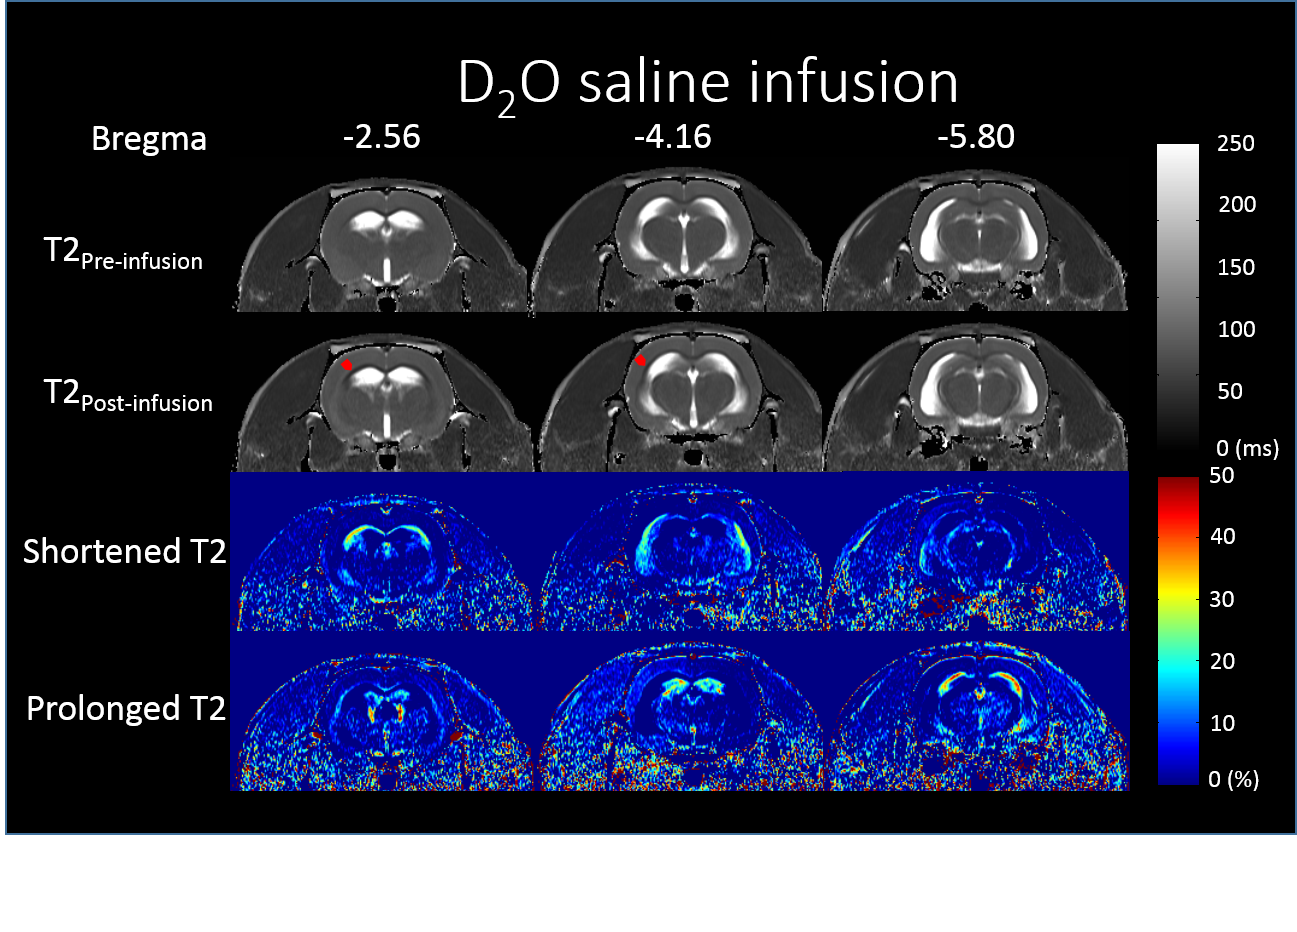
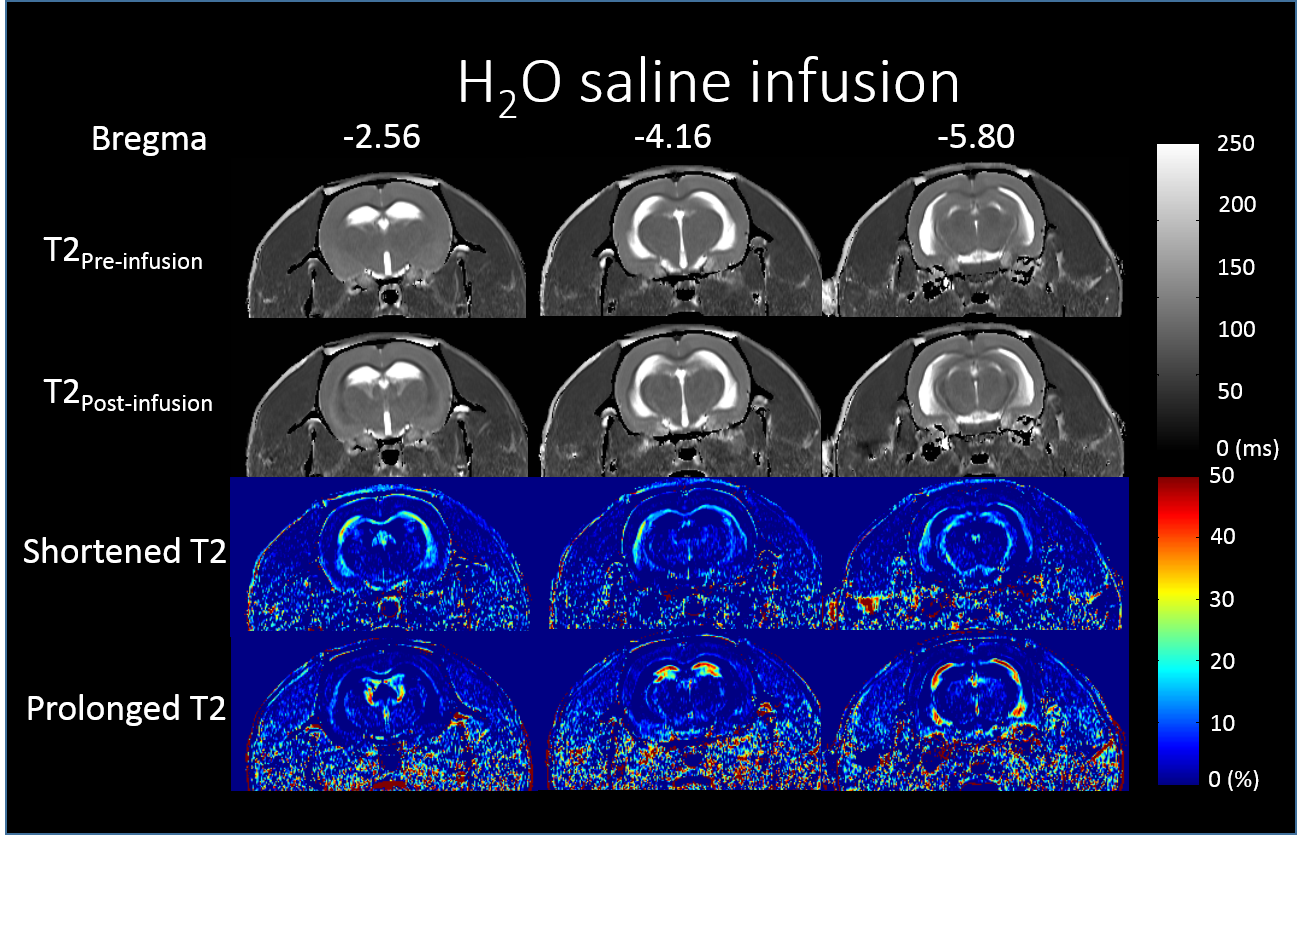
With a fluid infusion of 2% of body weight in the D2O perfusion imaging experiment, the tissues are expected in a hyperhydration state. In this study, we conduct both D2O and H2O infusion experiments on spontaneously hypertension rat (SHR). Fast and slow flow of brain were analyzed by a two-compartmental parallel model. Pre- and post-infusion T2 maps were acquired. The slow flow matched the T2 prolonged regions, which could be due to the CSF production and flow.
Introduction
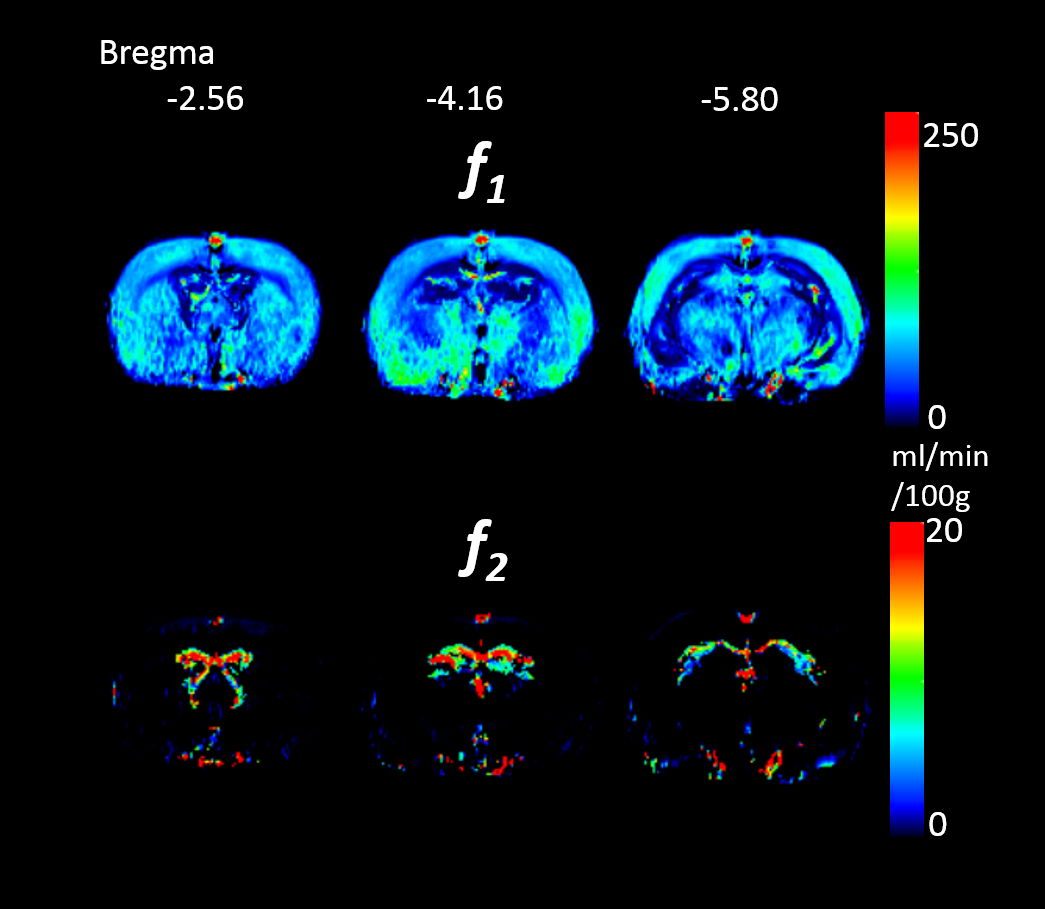
In previous study, a D2O perfusion imaging method was report to use two compartmental model to quantitative measure the fast (f1) and slow (f2) perfusion of tissue.1 According to the spatial distribution, the slow compartment was anticipated as the perfusion of CSF and interstitial fluid. In literature, brain volume can be influenced intentionally by dehydration and a following hyperhydration.2 The extension of ventricles and shrinkage of white matter in some regions have been observed in the dehydration state.3, 4 With a fluid infusion of 2% of body weight in the previous D2O perfusion imaging experiment, the tissues are expected in a hyperhydration state. In this study, we conducted both D2O and H2O infusion experiments on spontaneously hypertension rat (SHR). In order to observe the fluid induced tissue change, the T2 relaxometry was conducted before and after fluid infusion.Materials and Methods
SHR rats were scanned by D2O and H2O infusion. The SHR is a widely used model for neurodegenerative disorder such as dementia. The SHR has extension of ventricles, which has advantageous for observation of CSF characteristics. All rats were anesthetized by 1.5 % isoflurane and injected with isotonic D2O or H2O (2ml/100g) via tail vein at 7T Bruker Clinscan MRI scanner. 80 measurements were acquired by the following parameters: turbo-spin-echo (TSE) with TR/TE = 2000/14ms, matrix size = 256x128, FOV = 35mm, turbo factor = 3, slice number = 3, slice thickness = 1.5mm, distant factor = 10%, sampling interval = 34s. Spin echo images at identical slices were acquired before and right after infusion, with the following parameters: TR =2000ms, TE: from 20 to 200ms with an interval of 20ms.Results
Discussion
The T2 alteration is clearly observed after massive fluid infusion on SHR rat. The T2 prolonged region spatially correlated with the slow flow f2. It is anticipated to be due to the extra CSF production and enlarged slow flow in these region. The reason of T2 shortening effect is not clear yet. We speculated that myelin water fraction might be increased by blood supply, and then leads to the T2 decrease. Further investigations by diffusion imaging and voxel-based morphometry may help for validation. The T2 change of D2O and H2O are almost identical. Therefore, the effect of negative relaxivity of D2O should be negligible. The D2O perfusion imaging method with massive fluid infusion may alter the tissue T2 in some specific regions, and the measured perfusion parameters may be influenced and reflect the physiology under hyperhydration. The challenge of hyperhydration may provide further information of hydrodynamics in brain, which could be related to the emerging studies of aquaporin function and glymphatic system. Therefore, the D2O perfusion imaging may have potential for the future studies on neurodegenerative disorders, neuroinflammation, and developing brain.
Acknowledgements
No acknowledgement found.References
1. Li CH et. al., Simultaneously trace blood perfusion and glymphatic passage by analyzing deuterium oxide profusion imaging with a two-compartmental parallel model. ISMRM proceedings. 2016.
2. Duning T et. al., Dehydration confounds the assessment of brain atrophy. Neurology 2005; 64:548-550.
3. Kempton MJ et. al., Effects of acute dehydration on brain morphology in healthy humans. Human Brain Mapping 2009; 30:291-298.
4. Streitburger DP et. al., Investigating structural brain changes of dehydration using voxel-based morphometry. PLoS ONE 2012; 7(8):e44195.
Figures