Liyuan Song1, Lizhi Xie2, and Junfang Xian1
1Department of Radiology, Beijing Tong Ren Hospital,Capital Medical University, Beijing, People's Republic of China, 2GE Healthcare, MR Research China, Beijing, People's Republic of China
Synopsis
This work assessed the feasibility of quantitative parameters
derived from dynamic contrast enhanced MR imaging (DCE-MRI) and evaluated the
value of quantitative dynamic contrast enhanced MR imaging in the differential
diagnosis between lymphoma and inflammatory pseudotumor
in the orbit.
From the results we can see that it is feasible
that quantitative parameters of DCE-MRI can
be applied in the differential diagnosis between lymphoma and inflammatory
pseudotumor in the orbit. Thus, it can probably be used as imaging biomarkers to
predict prognosis and aggressiveness of orbital lymphoma.
Purpose
To assess the feasibility of quantitative
parameters derived from dynamic contrast enhanced MR imaging (DCE-MRI) and
evaluate the value of quantitative dynamic contrast enhanced MR imaging in the
differential diagnosis between lymphoma and inflammatory pseudotumor in the
orbit.Materials and Methods
83 patients with orbital masses (39 orbital
lymphomas and 44 orbital inflammatory pseudotumors) confirmed by pathology were
enrolled in the study
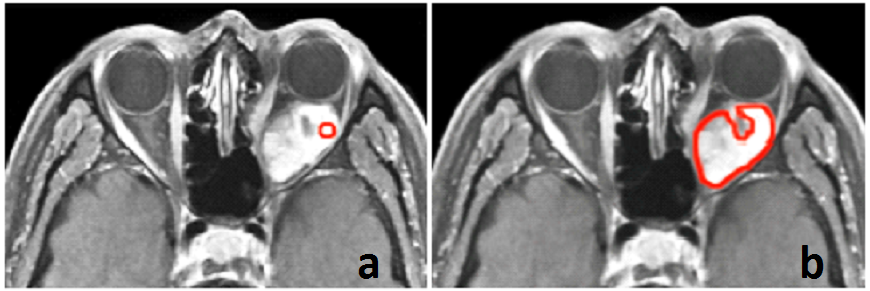
[1,2]. Two methods of selecting regions of
interest (ROI) were compared to obtain quantitative parameters: (
a) a
round or ovoid region of 8mm
2 covering the earliest and most
enhanced area, and (
b) covering the lesion excluding the hemorrhage and necrosis
on the largest slice (
Figure 1)
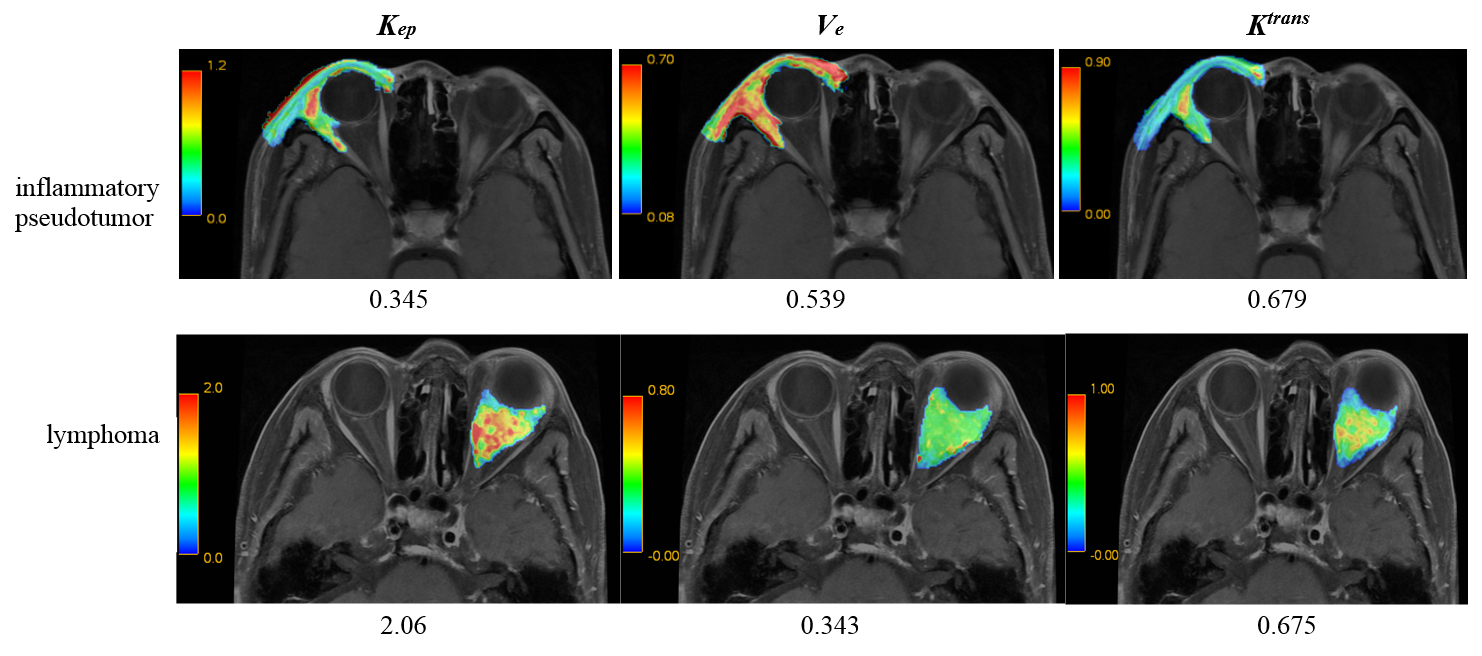
[3-4]. Parametric maps were obtained for quantitative parameters
including
Ktrans,
Ve and
Kep (
Figure 2)
[5]. Quantitative parameters that distinguish orbital lymphoma from
orbital inflammatory pseudotumor were analyzed by using independent rank sum
test, independent T-test, receiver operating characteristic curves (ROC) and Z
test. P value of less than 0.05 was considered to represent a significant
difference.
Results
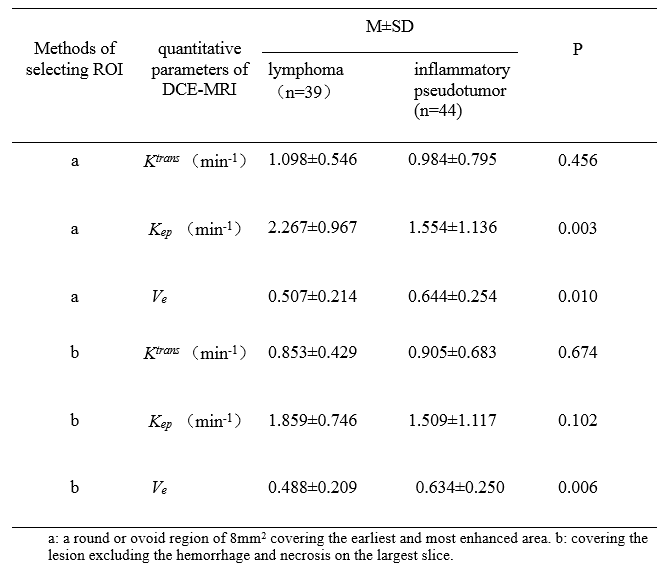
Kep values were significantly higher in orbital lymphoma
than in orbital inflammatory pseudotumor. In contrast,
Ve values were significantly lower in orbital
lymphoma than in orbital inflammatory pseudotumor (p<0.05). However,
Ktrans showed no difference
between orbital lymphoma and orbital inflammatory pseudotumor (p>0.05) (
Table
1). Two methods of selecting ROI showed no difference in distinguishing
lymphoma from inflammatory pseudotumor of orbit (p>0.05).
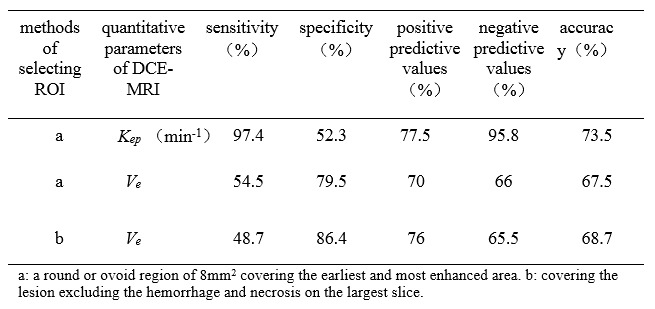
Kep
(method
a of selecting ROI) distinguished lymphoma from inflammatory
pseudotumor in the orbit with sensitivity, specificity, positive predictive
value, negative predictive value and accuracy of 97.4%, 52.3%, 77.5%, 95.8%,
73.5% respectively.
Ve (method
a
of selecting ROI) distinguished lymphoma from inflammatory pseudotumor in the
orbit with sensitivity, specificity, positive predictive value, negative
predictive value and accuracy of 54.5%, 79.5%, 70%, 66%, 67.5% respectively.
Ve (method
b of selecting ROI)
distinguished lymphoma from inflammatory pseudotumor in the orbit with
sensitivity, specificity, positive predictive value, negative predictive value
and accuracy of 48.7%, 86.4%, 76%, 65.5%, 68.7% respectively (
Table 2).
Conclusions
It is feasible that quantitative parameters
of DCE-MRI can be applied in the differential diagnosis between lymphoma and
inflammatory pseudotumor in the orbit. Thus, it can probably be used as imaging
biomarkers to predict prognosis and aggressiveness of orbital lymphoma.
Acknowledgements
We
would like to thank the
support of National Natural Science Foundation of China(81571649) , Beijing Municipal Administration of Hospitals Clinical Medicine Development of Special Funding Support (ZYLX201704) , High Level Health Technical Personnel of Bureau of Heath in Beijing(2014-2-005) and “Key Talent Project”of Beijing (2014001).References
[1] Tailor TD, et, al. Radiographics 2013;
33:1739-58.
[2] Yuan Y, et, al. Eur J Radiol 2013;
82:1506-11.
[3] Xian J, et, al. European Radiology, 2010,
20: 1692-1702.
[4] Lee FK et, al. European Journal of
Radiology, 2012, 81: 784-788.
[5] Xian J, et, al. Chinese Medical Journal,
2014, 127: 2259-2264.