1919
Whole Brain Dynamic Contrast-Enhanced MRI Study of Blood-Brain Barrier Disruption in Systemic Lupus Erythematosus Patients: Implications on the Choice of Tracer Kinetic Model1Clinical Imaging Research Centre, Singapore, Singapore, 2Division of Rheumatology, National University Hospital, Singapore
Synopsis
Current evidence suggests that blood-brain barrier (BBB) integrity is one of the potential biomarkers to diagnose neuropsychiatric systemic lupus erythematosus patients. We use DCE MRI and performed tracer kinetic analysis using both a distributed parameter (DP) model and the modified Tofts (MT) model. More Leaky BBB in SLE patients with anti-NR2 in their sera than the controls was detected by the permeability related parameters from both models. However, Ktrans of MT model, which is commonly used in DCE MRI of cancer studies, might be less reliable than DP model permeability parameters in this study.
Introduction
Disruption of the blood-brain barrier is integral to the neuropathology of SLE1. Antibodies reactive with N-methyl-D-aspartate (NMDA) receptor NR2 (anti-NR2) have been implicated in the etiopathogenesis of cognitive dysfunction in systemic lupus erythematosus (SLE). Cognitive dysfunction is a common manifestation of neuropsychiatric SLE (NPSLE) which carries significant morbidity and socioeconomic burden. To date, there is no method in the available literature for the reliable diagnosis of cognitive dysfunction. This is the perfusion/permeability imaging part of a larger ongoing study to examine neurotoxic mechanisms of anti-NR2 through in vitro and imaging methods. Here, DCE MRI was used to detect blood–brain barrier (BBB) leakage, which is recently being shown to be a biomarker for NPSLE2.
Materials and Methods
Dynamic contrast-enhanced MRI was performed on 11 SLE patients with anti-NR2 in their sera and 5 healthy controls negative for anti-NR2. DCE-MRI scans were performed with a whole-body 3T Biograph mMR (Siemens Healthcare, Germany). Dynamic acquisition was performed with a spoiled 3D FLASH, FA=15°, FOV 200x200mm, 32 slices to cover whole brain, 4.2 mm slice thickness, and temporal resolution 3.7 s per frame. Concentration time curves were analyzed using the distributed parameter (DP)3 and the modified Tofts (MT) models4. Model fitting was performed by using a nonlinear optimization algorithm, lsqcurvefit (Matlab, Mathworks, Natick, MA), and discarded pixels with fitting failure as determined by low fraction of modeling information5 with a threshold of 0.995. We analysed brain regions that were co-registered from FreeSurfer (Athinoula A. Martinos Center for Biomedical Imaging).
Results
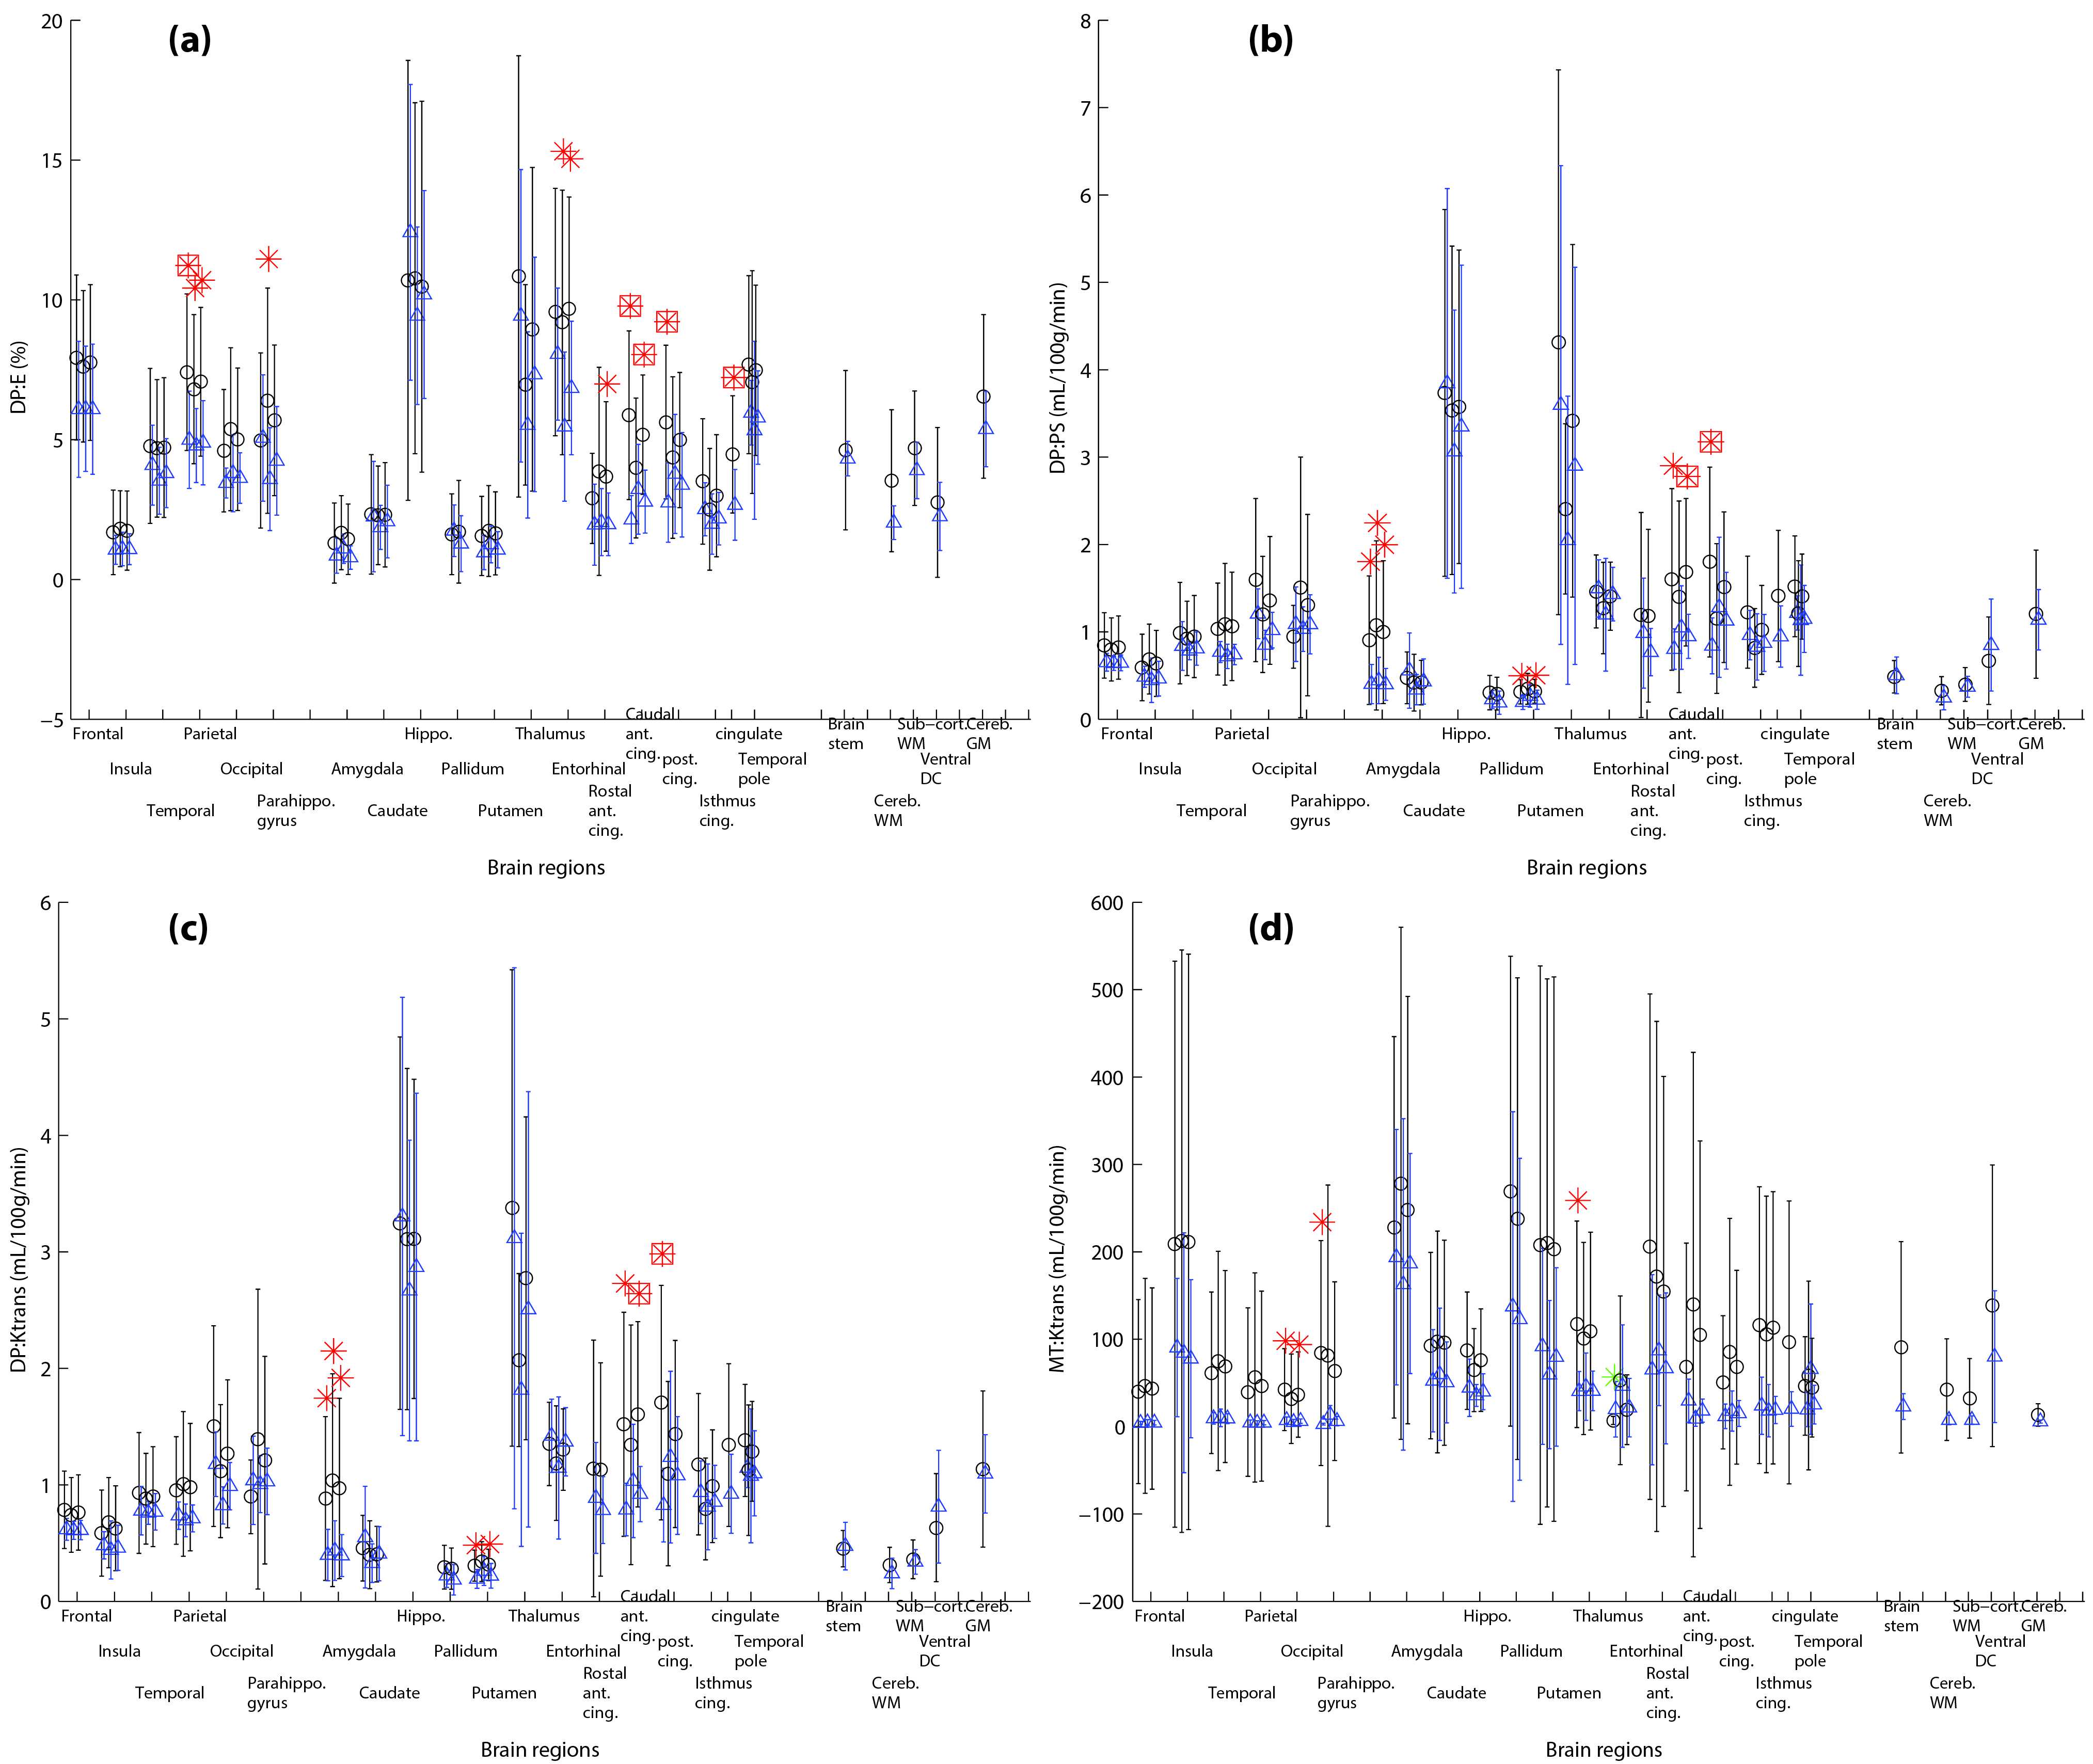
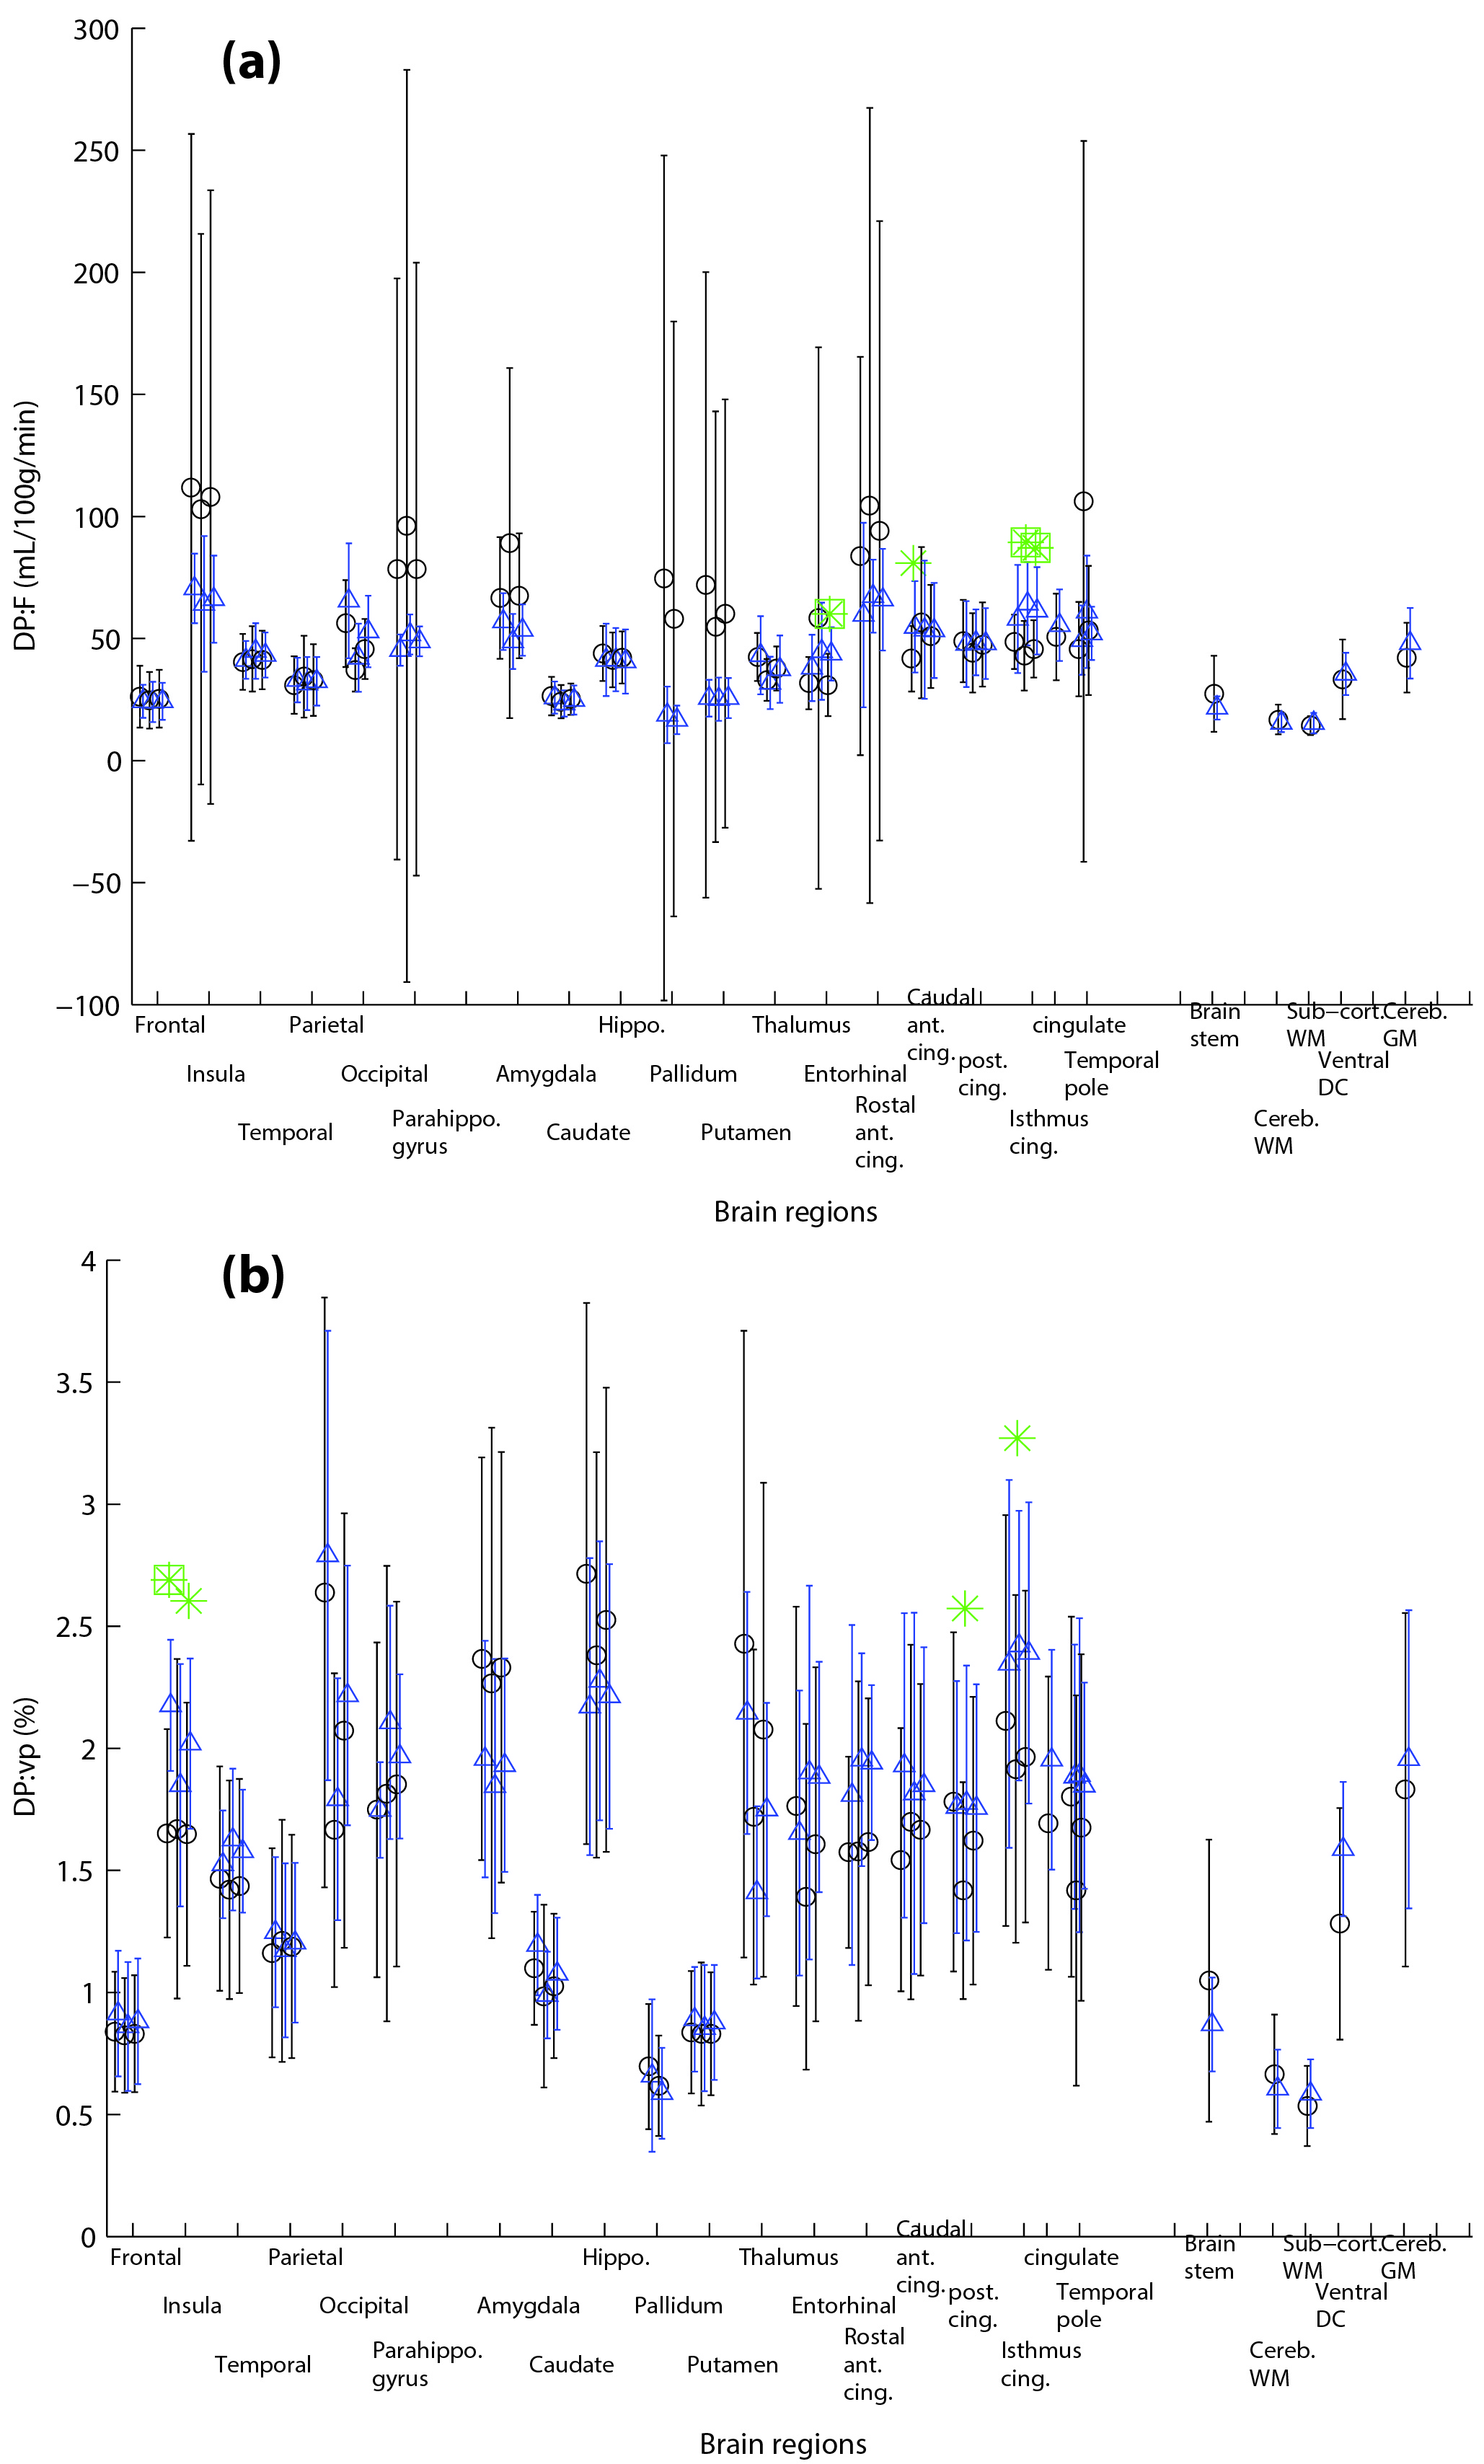
Figure 1 shows the results of permeability related parameters: from DP model: First pass extraction ratio (DP:E), Permeability surface area product (DP:PS), an estimation of Ktrans (DP:Ktrans = E*F); and from MT model: Transfer constant (MT:Ktrans). Figure 2 shows the results of perfusion and fractional vascular volume from the DP model.
Although BBB of only a few regions were found to have significant higher leakiness at significant level (P<0.05, Figure 1 red squared-asterisks), most regions in SLE patients have higher leakiness than the control subjects (Figure 1 circles). When we considered a lower significant level (P<=0.1), regions in SLE patients with significant higher leakiness are Parietal (DP:E), Caudal anterior cingulate (DP:E), cingulate (DP:E), Entorhinal (DP:E), Rostal anterior cingulate (DP:E), Amygdala (DP:PS and Ktrans), Putamen (DP:PS and Ktrans), Occipital (MT:Ktrans). Some regions where only one side has significant higher leakiness are Right Posterior cingulate (DP:E, PS and Ktrans), Left Parahippocampal gyrus (DP:E), Right Parahippocampal gyrus (MT:Ktrans), and Right Thalumus (MT:Ktrans).
Among the four leakiness related parameters, DP:E showed more regions with significant higher leakiness in SLE patients. DP:PS and DP:Ktrans (=ExF) behaved very similarly. On the other hand, at P<0.05 significant level, no region had significant higher MT:Ktrans in SLE patients. In addition, its range of values were more spread out than DP:Ktrans, and even above DP:F.
Discussions
Our preliminary DCE results reveal that BBB in a number of brain regions of our SLE patients with anti-NR2 in their sera were indeed more permeable. MT:Ktrans is commonly used as a measurement of permeability in cancer studies. However, it might not be suitable in measuring permeability in SLE or normal brain. As explained by Tofts et al.6, depending on the tissue environment, Ktrans in Tofts models may represent perfusion when F<<PS, or permeability when PS<<F. Although PS<<F in the brain, we suspect there are still substantial contributions of perfusion in this parameter that could have made it less reliable as a permeability parameter. On the other hand, DP:E, which is independent on the magnitude of F, has good potential to detect BBB disruptions.
Conclusion
DCE MRI data analysed with the DP model may be used to measure BBB integrity where DP:E might be a potential biomarker for NPSLE.Acknowledgements
This work is funded by CIRC grant CIRC/P/2014/005.References
1. Abbott NJ, Mendonca LL, Dolman DE. The blood-brain barrier in systemic lupus erythematosus. Lupus. 2003;12:908–915.
2. Tay SH and Mak A. Anti-NR2A/B Antibodies and Other Major Molecular Mechanisms in the Pathogenesis of Cognitive Dysfunction in Systemic Lupus Erythematosus. Int. J. Mol. Sci. 2015;16:10281-10300; doi:10.3390/ijms160510281.
3. Koh TS, Cheong LH, Hou Z et al. A physiologic model of capillary-tissue exchange for dynamic contrast-enhanced imaging of tumor microcirculation. IEEE Trans. Biomed. Eng. 2003;50(2):159–167.
4. Tofts PS. Modeling tracer kinetics in dynamic Gd-DTPA MR imaging. J Magn Reson Imaging. 1997;7:91–101.
5. Balvay D, Frouin F, Calmon G et al. New Criteria for Assessing Fit Quality in Dynamic Contrast-Enhanced T1-Weighted MRI for Perfusion and Permeability Imaging. 2005;54:868–877.
6. Tofts PS, Brix G, Buckley DL, et al. Estimating kinetic parameters from dynamic contrast-enhanced T1-weighted MRI of a diffusable tracer: standardized quantities and symbols. J Magn Reson Imaging. 1999;10:223–232.
Figures