1918
The Vanishing Shutter-Speed Limit1Section on Quantitative Imaging and Tissue Sciences, DIBGI, NICHD, National Institutes of Health, Bethesda, MD, United States, 2Advanced Imaging Research Center, Oregon Health & Science University, Portland, OR, United States
Synopsis
Dynamic-contrast-enhanced MRI (DCE-MRI) has been widely used to characterize microvasculature permeability. Recently, it was shown to reveal metabolic activity using the shutter-speed pharmacokinetic paradigm (SSP), in which steady-state intra/extracellular water exchange kinetics was incorporated into DCE-MRI data analysis. Interesting insights into DCE-MRI signals come from modeling the extravascular tissue MR signal. The questions addressed here are, “When can extravascular 1H2O longitudinal magnetization recovery from inversion/saturation still be described by a single-exponential process, and when can the intra/extracellular water exchange kinetics be accurately determined?”
Purpose
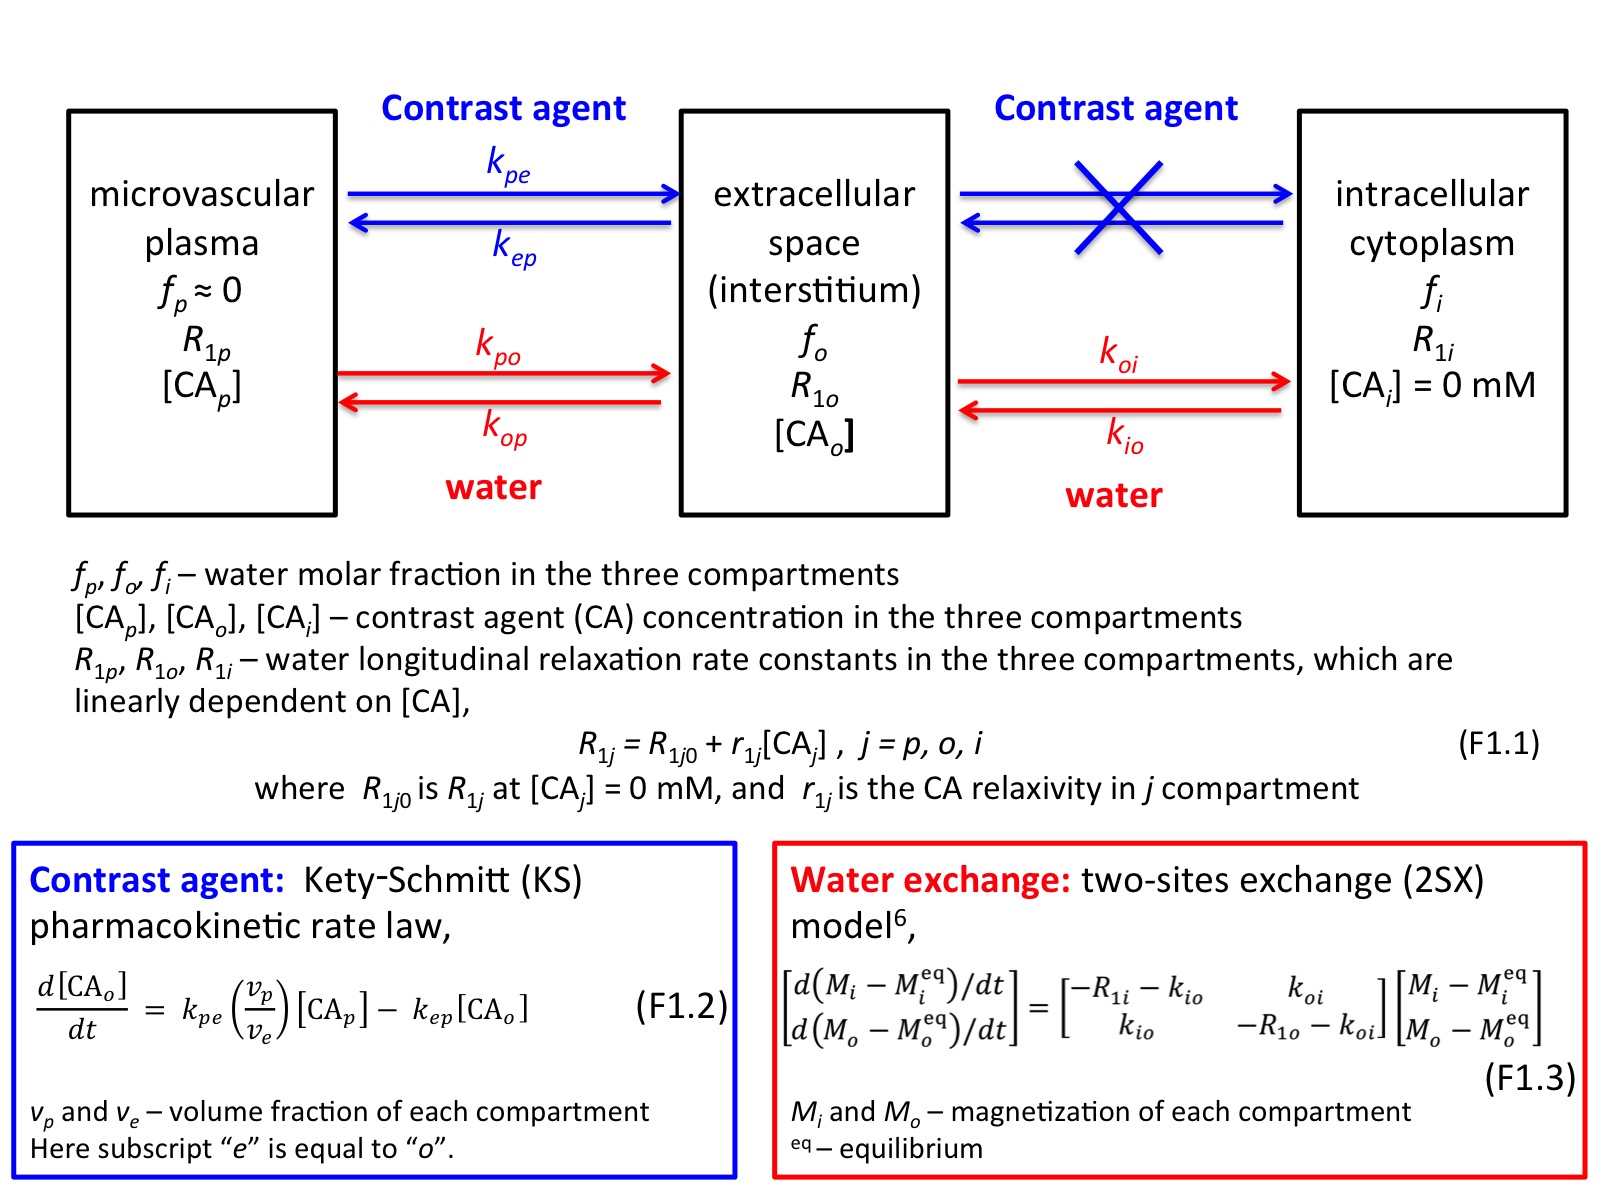
Dynamic-contrast-enhanced MRI (DCE-MRI) is a widely used clinical imaging tool.1 A quantitative DCE-MRI protocol is a pharmacokinetic study. A paramagnetic contrast agent (CA) is injected intravenously and transiently extravasates only to the extracellular tissue spaces, a process described by Kety-Schmitt (KS) pharmacokinetic law (Figure 1). Interesting aspects of the analysis of DCE-MRI signals come from modeling the extravascular tissue MR signal. Typically, a tracer pharmacokinetic paradigm (TP) has been used,2 where longitudinal magnetization, M, recovery from inversion/saturation is assumed to be described by an empirical single exponential process with apparent relaxation rate, . However, this ignores an important feature of water compartmentalization, i.e., finite steady-state exchange of intra- and extracellular water molecules.3
In 1999, two-site-exchange (2SX) expressions for steady-state intra/extracellular water exchange kinetics (Figure 1) were incorporated into DCE-MRI data analysis, via the shutter-speed pharmacokinetic paradigm (SSP).3 SSP-based analysis not only characterize microvasculature, like TP, but also reveal cellular metabolic activity.4,5 In SSP models, M is described with a bi-exponential function, which could admit two MR signals with different apparent relaxation rate constants. The questions addressed here are the conditions when M relaxation can still be described as a single-exponential process and when the intra/extracellular water kinetics can still be accurately determined under SSP.
Methods
To illustrate the effects of varying [CAo] during DCE-MRI, simulations with the following 2SX parameters (Figure 1): fi = 0.80, R1o0 = 0.55 s-1, and r1o = 3.94 s-1mM-1. The values were varied from 0 to 3 s-1, with 0.5 s-1 steps, and the [CAo] values were varied from 0 to 6 mM. The simulations were run at two different intrinsic intracellular 1H2O relaxation rate constants: R1i = 0.55 and 2.00 s-1. In all simulations, the small microvascular plasma (and blood) signal was ignored.
The 2SX model describes intra- and extracellular M with an empirical bi-exponential function,
$$$\frac{M_{0}-M(t_{1})}{M_{0}}=(1-\cos\alpha)\left[f_{ sm}^{'}e^{-R_{1sm}^{'}t_{1}}+(1-f_{sm}^{'})e^{-R_{1lar}^{'}t_{1}} \right]$$$ (1)
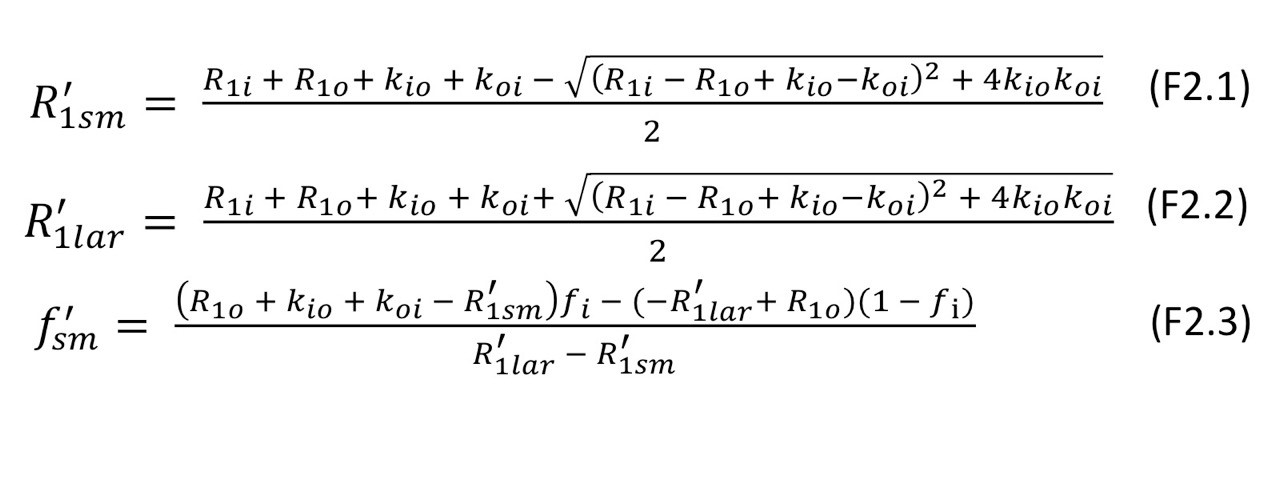
where$$$M(t_{1}) $$$ is the magnetization at recovery time $$$t_{1}$$$, $$$M_{0}$$$, at equilibrium, α the effective flip angle of the inversion/saturation pulse, and $$$R_{1sm}^{'}$$$ and $$$R_{1lar}^{'}$$$ are the small and large apparent relaxation rate constants, respectively, and $$$f_{ sm}^{'}$$$ is the apparent fractional intensity of the signal with $$$R_{1sm}^{'}$$$. The analytical expressions for Eq. (1) quantities given in terms of physical quantities are described in Figure 2.6
Results
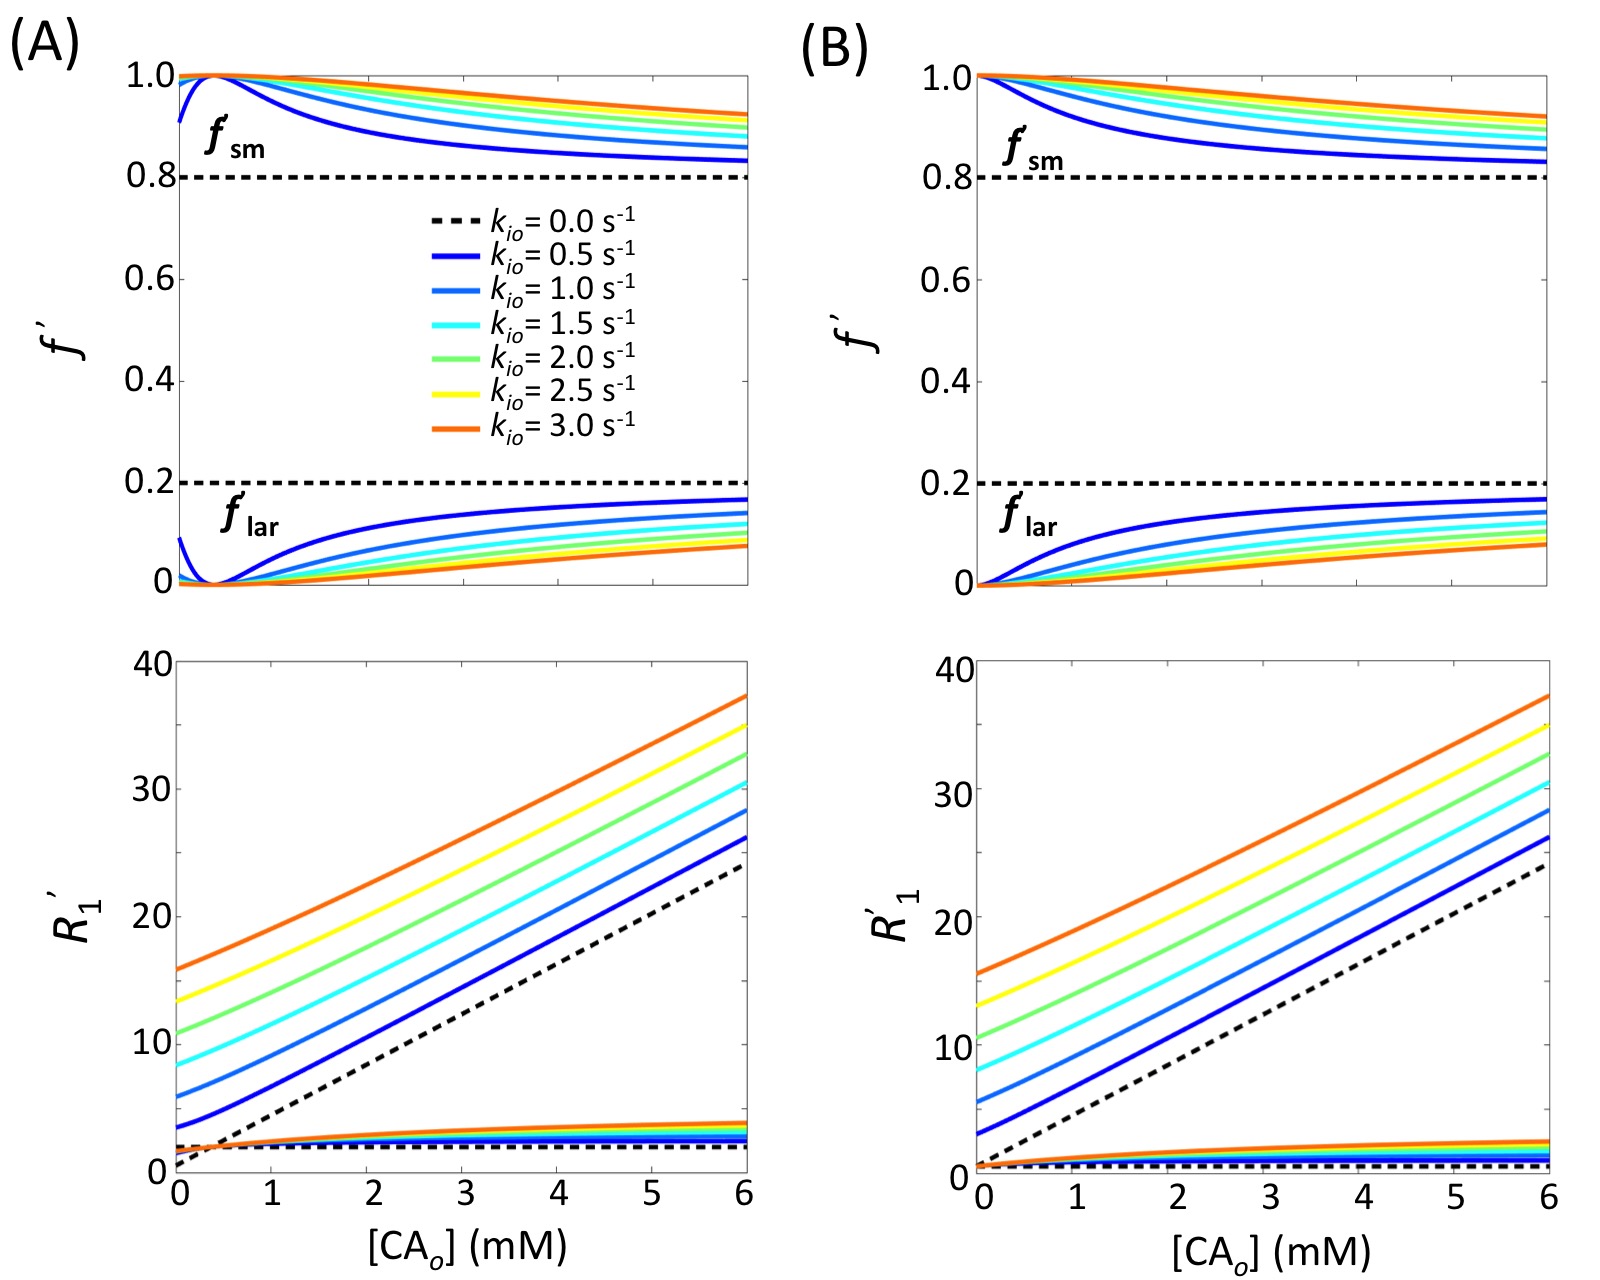
The analytical 2SX solutions for $$$f_{ sm}^{'}$$$, $$$R_{1sm}^{'}$$$, and $$$R_{1lar}^{'}$$$ as functions of [CAo] and kio are illustrated in Figure 3. Without any exchange, both $$$f_{ sm}^{'}$$$ and $$$R_{1sm}^{'}$$$ are [CA]‑independent (horizontal dashed lines). With exchange, both parameters are strongly dependent on [CAo] and kio values. For $$$R_{1i}-R_{1o0}=0$$$ s-1, $$$f_{ sm}^{'}$$$ is equal to 1.0 at [CAo] = 0 mM for any finite kio value. For $$$R_{1i}-R_{1o0}=1.45$$$ s-1, $$$f_{ sm}^{'}$$$ approaches 1.0 at [CAo] = 0.37 mM ($$$R_{1i}-R_{1o}=0$$$ s-1) for any finite kio value. In both cases, the recovery time-course could be well approximated with the single-exponential expression Eq. (1) with $$$R_{1}^{'}$$$.Discussions
Figure 3 illustrates important theoretical features of the 2SX model. The abscissa is a measure of the longitudinal shutter-speed ($$$\kappa_{1}\equiv \mid{R_{1i}-R_{1o}}\mid$$$) for this system.7 For simulations at $$$R_{1i}-R_{1o0}=0$$$ and 1.45 s-1, $$$f_{lar}^{'}$$$ approaches 0 as $$$\kappa_{1}$$$ approaches zero. This has been traditionally called the fast‑exchange-limit [FXL]. However, the FXL term comes from NMR in chemistry, where reactions can be accelerated or slowed, i.e., $$$k_{io}$$$ can be increased or decreased, respectively. Figure 3 makes clear the $$$f_{lar}^{'}$$$ vanishing is independent of the $$$k_{io}$$$ value at finite $$$k_{io}$$$. Thus, the FXL label is misleading. It is more descriptive to refer to the left ordinate as the vanishing-shutter-speed-limit [VSSL]. This is important because the TP represents a special case of the SSP – in the limit of a short SS. It has been shown algebraically that as $$$\kappa_{1}$$$ vanishes, $$$R_{1sm}^{'}$$$ approaches the f-weighted R1i, R1o average $$$[\equiv R_{1}^{'}]$$$.8 Any DCE-MRI model within the TP is the special VSSL case of the analogous shutter-speed model.7,9
In most practical situations, ($$$R_{1i}-R_{1o0}$$$) is small in tissue but > 0 and [CAo]max rarely exceeds 2 mM.8,10 In these cases, $$$f_{lar}^{'}$$$ is very small, and its signal also likely suffers disproportionate transverse relaxation quenching $$$(R_{2lar}^{*}>R_{2sm}^{*})$$$.7 Thus, the component can reasonably be neglected. In this very common regime, the recovery is mono-exponential, but the relaxation rate constant is $$$R_{1sm}^{'}$$$ (Figure 2), not $$$R_{1}^{'}$$$ defined in TP model
$$$R_{1}^{'}$$$ = r1o[CAo] + $$$R_{10}^{'}$$$ (2)
This can be called the vanishing shutter-speed regime [VSSR]. Measurements in blood suggests the VSSR extends to [CAo] past 20 mM; most likely due to transverse quenching.8 This is important because $$$k_{io}$$$ is only accessible in the VSSR but not the VSSL.
Acknowledgements
This work was supported by the Intramural Research Program (IRP) of the Eunice Kennedy Shriver National Institute of Child Health and Human Development, National Institutes of Health. Charles S. Springer, Jr. is supported by the National Institutes of Health under Awards No. UO1-CA154602 and R44-CA180425References
1. Padhani AR. Dynamic contrast-enhanced MRI in clinical oncology: Current status and future directions. J Magn Reson Imaging. 2002;16(4):407-422.
2. Sourbron SP, Buckley DL. Classic models for dynamic contrast-enhanced MRI. NMR Biomed. 2013;26(8):1004-1027.
3. Landis CS, Li X, Telang FW, et al. Equilibrium transcytolemmal water-exchange kinetics in skeletal muscle in vivo. Magn Reson Med. 1999;42(3):467-478.
4. Zhang Y, Poirier-Quinot M, Springer CS, Balschi J a. Active trans-plasma membrane water cycling in yeast is revealed by NMR. Biophys J. 2011;101(11):2833-2842.
5. Springer CS, Li X, Tudorica LA, et al. Intratumor mapping of intracellular water lifetime: metabolic images of breast cancer? NMR Biomed. 2014;27:760-773
6. Bai R, Benjamini D, Cheng J, Basser PJ. Fast, accurate 2D-MR relaxation exchange spectroscopy (REXSY): Beyond compressed sensing. J Chem Phys. 2016;145(15):154202.
7. Li X, Cai Y, Moloney B, et al. Relative sensitivities of DCE-MRI pharmacokinetic parameters to arterial input function (AIF) scaling. J Magn Reson. 2016;269:104-112.
8. Wilson GJ, Woods M, Springer CS, Bastawrous S, Bhargava P, Maki JH. Human whole-blood (1)H2O longitudinal relaxation with normal and high-relaxivity contrast reagents: influence of trans-cell-membrane water exchange. Magn Reson Med. 2014;72(6):1746-1754.
9. Ackerman JJH. The shutter-speed paradigm: not your father’s DCE-MRI. NMR Biomed. 2016;29(1):4-5.
10. Landis CS, Li X, Telang FW, et al. Determination of the MRI contrast agent concentration time course in vivo following bolus injection: effect of equilibrium transcytolemmal water exchange. Magn Reson Med. 2000;44(4):563-574.
Figures