1917
Quantification of tracer kinetic and hemodynamic parameters of human breast tumor and fibro-glandular tissue using DCE-MRI data1Centre for Biomedical Engineering, Indian Institute of Technology Delhi, Delhi, India, 2Fortis Memorial Research Institute, Gurgaon, India, Delhi, India, 3Department for Biomedical Engineering, AIIMS Delhi, New Delhi, India.
Synopsis
Objective of current study was to develop a framework for computing tracer kinetic parameters using GTKM model and hemodynamic parameters using first pass analysis of human breast tissue for characterizing of breast lesion; and also differentiation of the histological grade II and III of breast cancer. A significant difference between benign, malignant and fibroglandular tissues; and also between grade II and III of breast cancer were observed.
INTRODUCTION:
Quantitative DCE analysis plays an important role in breast cancer diagnosis as well as monitoring treatment responses.Tracer kinetic parameters were used for diagnosis of benign and malignant lesions as previously reported1,2. Among the tracer kinetic parameters, Ktrans and Kep showed the better sensitivity and specificity in the differentiation of benign and malignant lesions; and also among grade I and grade III. It was reported that tracer kinetic parameters were not able to differentiate among grades II and III3.Previously, hemodynamic parameters using first pass analysis were reported for brain MRI data and also worked well for differentiating different grades of brain cancer4. The purpose of this study was to develop a framework for computing tracer kinetic and hemodynamic parameters of human breast tissue and to evaluate their performance in terms of characterizing breast lesions into malignant or benign; and differentiation of the histological grade-II and III of breast cancer.METHODS:
All the MRI experiments were performed at 3T whole body Ingenia MRI system(Philips Healthcare, The Netherlands) using a7 channel biopsy compatible breast coil. Twenty four female subjects(10-benign, and 14-breast cancer(grade-II(n=6) and grade-III(n=8)),were scanned for MRI data.
MRI Data acquisition:Fat saturation was based upon DIXON method. After a localizer, T1, T2, PD weighted(W) and dynamic 4D images with fat saturation were acquired using turbo spin echo pulse sequence. Multiple slices, covering entire breast tissue with slice thickness of 3mm were acquired for all four data types. For PD-W and T2-W images echo train length(ETL) of 20 and for T1-W images ETL of 5 was used.FOV = 338 *338mm2 and matrix size = 512*512 were used.For PD-W, TR of 2974 ms and TE of 30 ms was used. For T2-W, TR of 2974 ms and TE of 100 ms was used. For T1-W, TR of 603 ms and TE of 10 ms was used. DCE-MRI was performed using a 3-dimensional fast field echo (3D-FFE) sequence (TR/TE = 3.0/1.5 ms, flip angle = 12 degree). Gd-BOPTA (Multihance, Bracco, Italy) in a dose of 0.1 mmol/kg body weights was administered intravenously with the help of a power injector at a rate of 3.0 mL/sec, followed by a bolus injection of a 30-mL saline flush. Forty time points were acquired with a temporal resolution approximately of 9 seconds for each time point.
Data Processing:Pre-processing was performed on PD,T1 and T2-W images for background noise removal followed by automatic segmentation of breast tissue.Further segmentation into fibro-glandular, fatty and tumor tissue was also performed using MATLAB-R2013a.Estimation of T1 mapping4 was performed using fast spin echo(conventional T1,T2 and PD-W images) for conversion of signal intensity time curve to concentration time curve.Tracer kinetic parameters2 and hemodynamic parameters using first pass analysis4 were also computed. The permeability(Ktrans),rate constant(Kep),extravascular extracellular volume fraction(Ve),plasma volume(Vp),Blood flow(BF),Blood volume(BV) and leakage corrected Blood volume(BV-corrected) were calculated.These parameters were compared between benign and malignant breast lesions; and also among differential grades(II and III) of breast cancer.T-test was used for statistical analysis.
RESULTS:
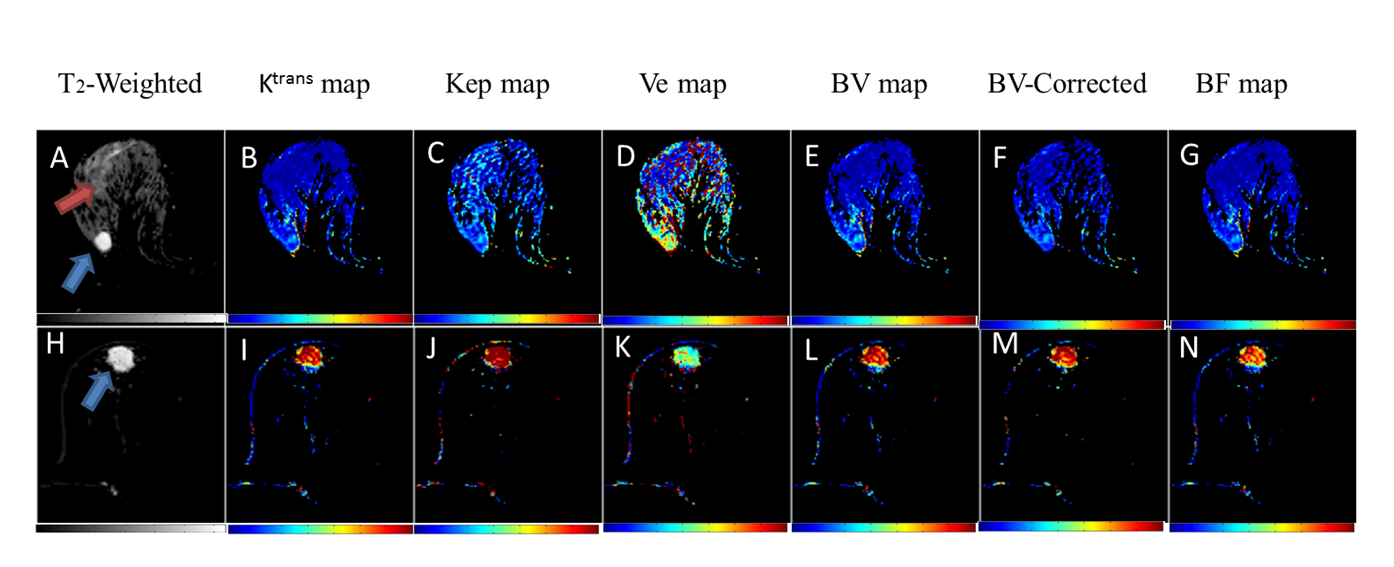
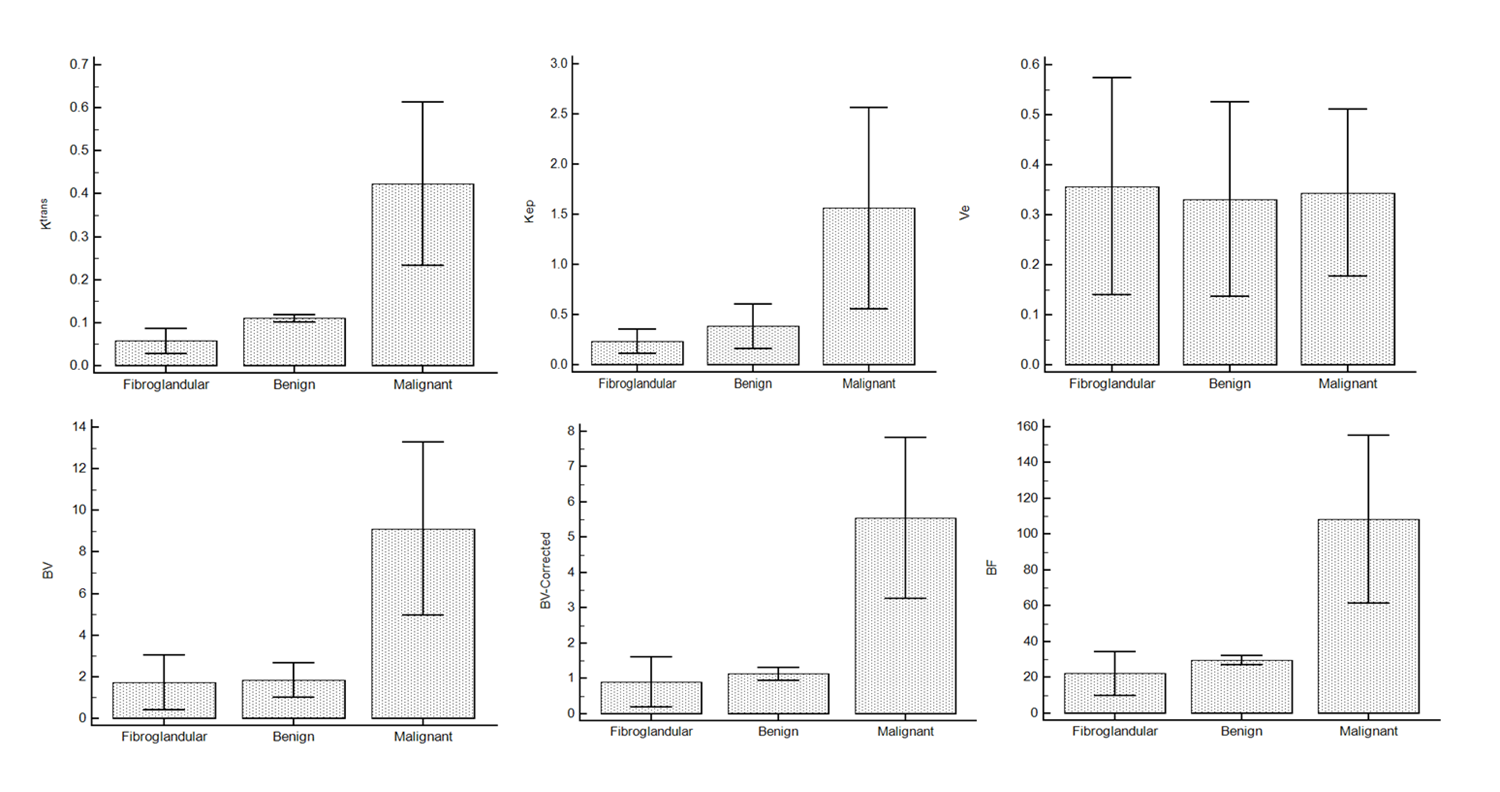
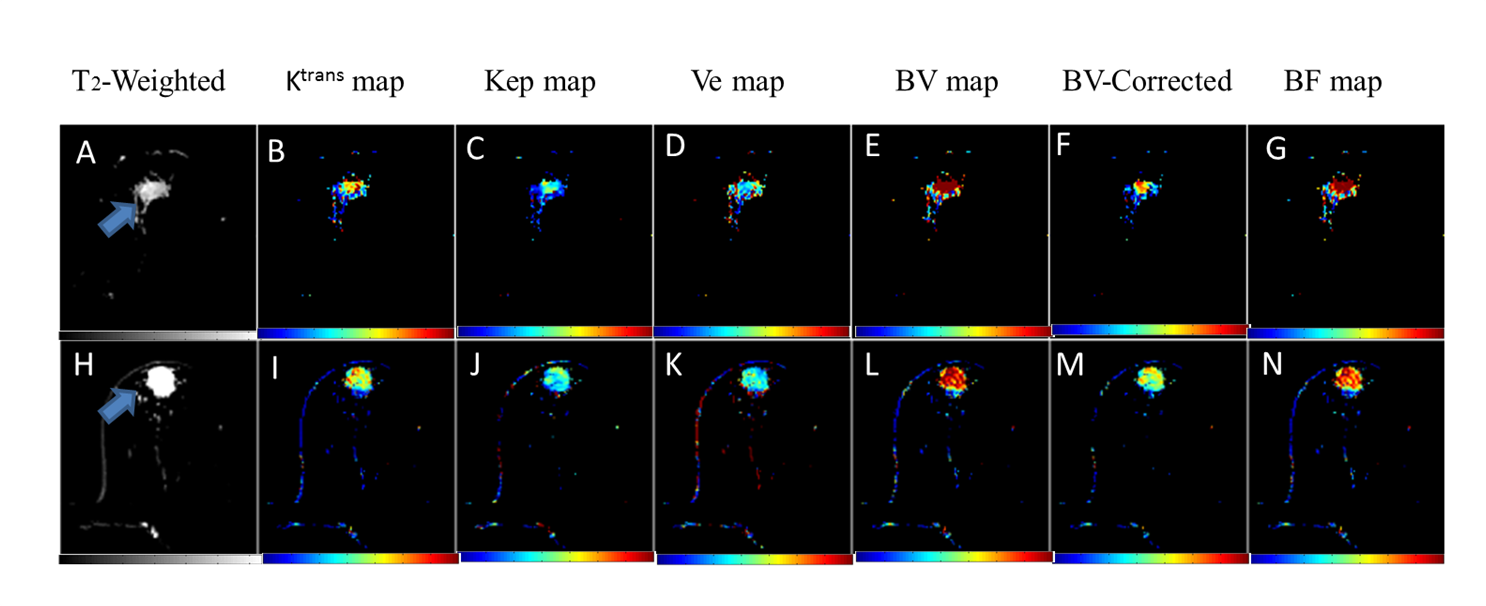
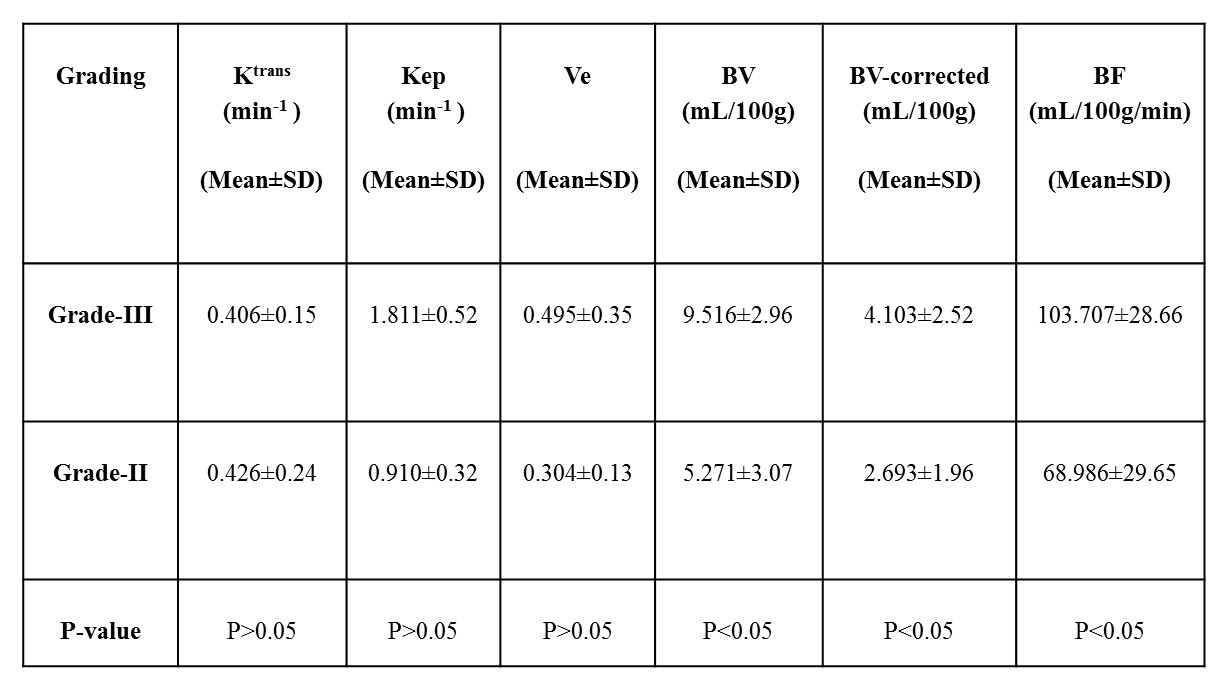
All parameters were computed successfully for 24-subjects.The parameters Ktrans,Kep,BV,BV-Corrected and BF between benign and malignant tumors were statistically significant(P<0.05)except Ve and Vp.Similarly, these parameters also showed statistically significant difference between malignant and fibro-glandular(P<0.05).In case of benign and fibro-glandular tissue,all parameters except Kep,Ve,Vp also showed a significance difference.MRI images of benign and malignant along with color maps of various parameters using GTKM are shown in Figure-1.Higher mean value of Ktrans,Kep,BV,BV-corrected and BF in case malignant as compared to fibro-glandular and benign can be seen in Figure-2.The differences in BV, BV-corrected and BF between grade-II and grade-III were statistically significant as shown in Table-1.The mean±sd of blood volume of grade-II and III were 5.271±3.07 and 9.516±2.96 respectively.The mean of blood volume corrected and blood flow were higher in grade-III than grade-II(4.103±2.52Vs2.693±1.96 and 103.707±28.66Vs68.986±29.65 respectively).MRI images of grade-II and III along with color maps of various parameters are shown in Figure-3.DISCUSSION:
Tracer kinetic parameters worked well for differentiating between benign and malignant lesions.Similar results have been reported in literature.This study further analyzed the tracer kinetic parameters for different grades-II and III of breast cancer.It was found that the differences in Ktrans,Kep,Ve between grade-II and grade-III were not statistically significant(P>0.05) which is also in agreement with previously reported study3.Hemodynamic parameters provide good differentiation between grade(II and III) of breast cancer.These are preliminary results with small number of patients.More data sets should be investigated in future studies.CONCLUSION:
In conclusion, tracer kinetic (Ktrans,Kep) and hemodynamic parameters (BV-corrected,BV,BF) provide differentiation between benign, malignant and fibroglandular tissues. It was also shown that hemodynamic parameters provide differentiation between histological grade(II and III) of breast cancer.Acknowledgements
The authors acknowledge internal grant from IIT-Delhi and technical support of Philips India Limited in MRI data acquisition. We thanks Prof. RKS Rathore for technical support in DCE-perfusion analysis; Dr. Prativa Sahoo and Dr. Indrajit for providing technical support for MRI data acquisition.References
1. Baek HM, Chen JH, Nie K, et al.: Predicting pathologic response to neoadjuvant chemotherapy in breast cancer by using mr imaging and quantitative 1h mr spectroscopy. Radiology 251: 653-662, 2009.
2.Riham H. El Khouli et al.:3-T Dynamic Contrast-Enhanced MRI of the Breast: Pharmacokinetic Parameters Versus Conventional Kinetic Curve Analysis.American Journal of Roentgenology,Volume 197, Issue 6 .
3. Zhen-Shen Ma et al. “Quantitative analysis of 3-Tesla magnetic resonance imaging in the differential diagnosis of breast lesions” EXPERIMENTAL AND THERAPEUTIC MEDICINE 9: 913-918, 2015.
4. Singh A, Haris M, Rathore D et al.. Quantification of physiological and hemodynamic indices using T1 dynamic contrast enhanced MRI in intracranial mass lesions. J. Magn. Reson. Imaging 2007;26:871–880. doi:10.1002/jmri.21080.
Figures