1914
Vastly accelerated linear least squares fitting with numerical optimization for dual delay compensated quantitative liver perfusion mapping1Cornell University, Ithaca, NY, United States, 2Weill Cornell Medicine, New York, NY, United States
Synopsis
Accurate liver perfusion quantification requires correction for dual arterial and portal venous input delays, but such dual delay correction in current nonlinear perfusion methods is computationally too expensive to apply in perfusion mapping. We realize that the kinetic equation is a linear differential equation that would allow fast linear processing. Accordingly, we propose to use linear least squares (LLS) fitting to this kinetic equation with fast conjugate gradient search for processing dynamic contrast enhanced MRI data. Our proposed LLS vastly (~300 times) accelerate computation in perfusion quantification, enabling for the first time accurate liver perfusion mapping with dual delay corrections.
Introduction
Dynamic contrast-enhanced magnetic resonance imaging
(DCE-MRI) provides temporal profiles for estimating perfusion parameters through
either model-free deconvolution, which involves estimation of tissue residue
function, or fitting enhancement curves to the kinetic model solution using a nonlinear
least squares (NLLS) technique. These current DCE perfusion approaches are
computationally expensive, particularly with estimating and correcting input
function delay, ignoring which introduces large errors in the estimated
perfusion parameters (up to 35% underestimation of flow, and up to 60%
overestimation of mean transit time)(1).
We propose to solve the differential tracer-kinetic equation
directly in a linear least squares (LLS) approach for calculating perfusion
parameters. This differential approach has become feasible with the
advent of very high temporal resolution (4 frames per second) acquisition techniques for adequate
temporal derivative evaluation (2).
Methods
In this study of liver perfusion, we incorporate a dual arterial and portal vein input ($$$ C_{a},C_{p}$$$) single compartment model with both arterial and portal vein delays ($$$ \tau_{a},\tau_{p}$$$) in fitting DCE MRI data to the tracer kinetic equation as follow:
\[\underset{k_{a},k_{p},k_{2},\tau_{a},\tau_{p}}{argmin}\sum_t\parallel\frac{dC_{t}(t)}{dt}-k_{a}C_{a}(t-\tau_{a})-k_{p}C_{p}(t-\tau_{p})+k_{2} C_{t}(t)\parallel_2^2\](1)
Here the spatial dimension is implied in the L2 norm and data is assumed to have time-invariant Gaussian noise. Once rate constants ($$$k_{a},k_{p},k_{2}$$$) are calculated, we estimate arterial fraction ($$$AF=k_{a}/(k_{a}+k_{p})$$$), extracellular volume ($$$ECV=(k_{a}+k_{p})/k_{2}$$$) and mean transit time ($$$MTT=1/k_{2}$$$) as follow:
\[\underset{AF}{argmin}\parallel{(k_{a}+k_{p})AF}-k_{a}\parallel_2^2, \underset{ECV}{argmin}\parallel{k_{2}ECV-(k_{a}+k_{p})}\parallel_2^2, \underset{MTT}{argmin}\parallel{k_{2}MTT-1}\parallel_2^2\](2)
To identify optimum delays in nonconvex Eq.1, we search over a physiological delay range between 0 up to 20 seconds with 5 frame intervals for both aorta and portal vein. For a particular delay ($$$\tau_{a},\tau_{p}$$$) combination, perfusion parameters and corresponding enhancement curves are calculated. L2 norm between measured and calculated enhancement curves are used to determine residual. The minimum residual and corresponding delays are selected as the optimum. All L2 minimizations including those in Eqs.1&2 were solved efficiently using the conjugate gradient method.
To compare LLS and NLLS fitting methods, de-identified DICOM images from time-resolved 3D hepatic MRI during injection of gadoxetate (10ml) in 7 healthy liver donors and 7 patients with liver disease were loaded into platform for medical imaging (PMI 0.4) (3) to perform NLLS analysis. As NLLS is implemented using voxel-wise operation, a voxel-wise LLS is also implemented to exam computation cost. LLS algorithms calculations were implemented in MATLAB (Mathworks, Natick, MA) and the reference standard NLLS approach using PMI was implemented in IDL.
Results
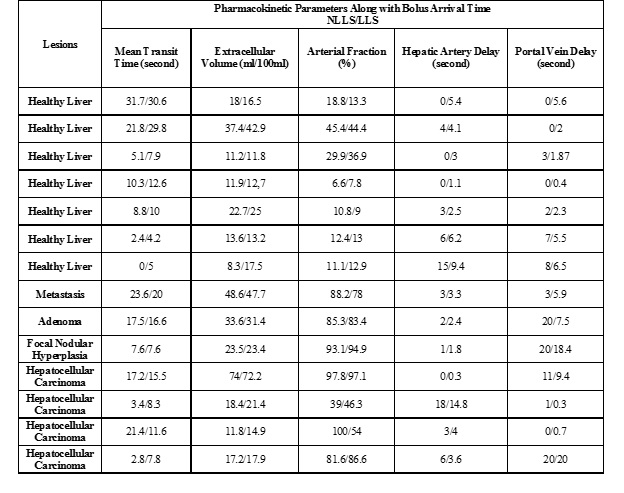
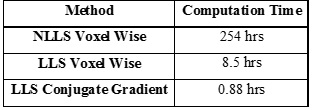
Table 1 compares perfusion parameters between traditional NLLS and proposed LLS methods. Accuracy and precision of these two methods have been studied under different scenarios including varying temporal resolution and contrast-to-noise ratio. This table shows that overall there is good agreement in perfusion parameters between both fitting methods in most subjects suggesting the proposed LLS method can be an alternative approach to the NLLS approach. In Table 2 computation time for one slice with 256×256 voxels with 288 time frames are compared in each method, demonstrating a drastic 288 fold time reduction from traditional NLLS to the proposed LLS.
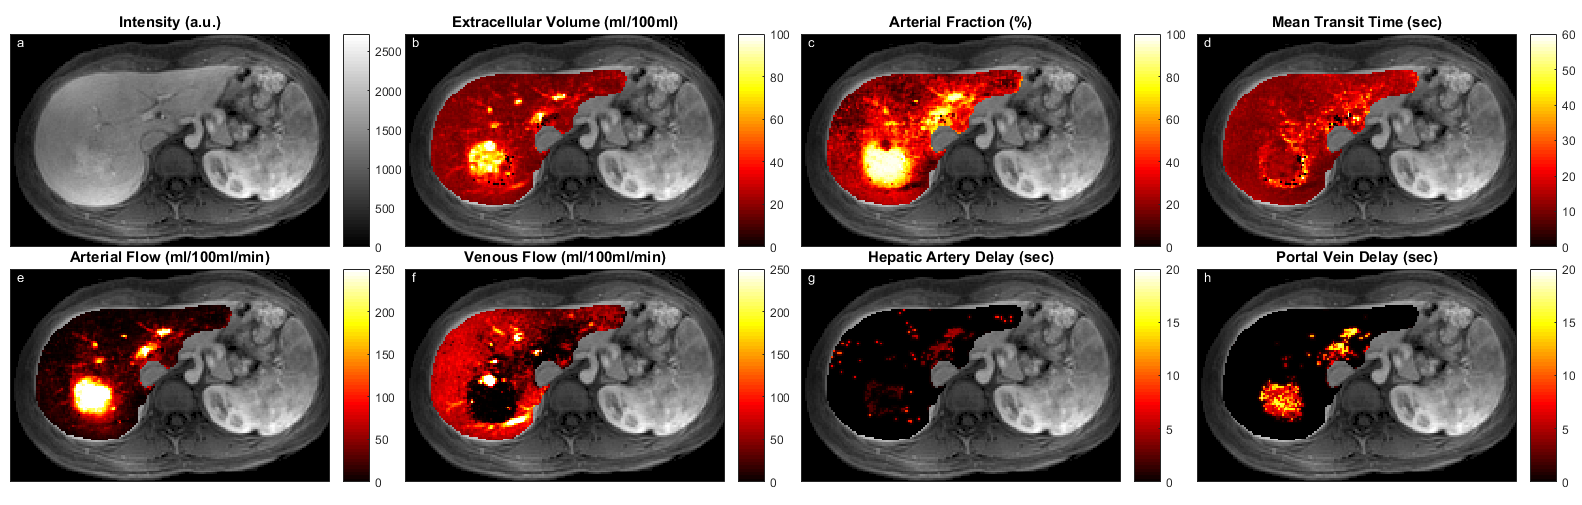
Input function delay maps along with perfusion parameters for a diseased (hepatocellular carcinoma) case superimposed on T1-weighted images are represented in Figure 1. HCC (marked with arrow) in Figure 1.a has similar mean transit time to normal-appearing surrounding liver except at the lesion rim which has larger values. In Figure 1.b extracellular volume is about 5 times larger in tumor compared to the liver parenchyma. Arterial fraction in Figure 1.c is largest at the center of the tumor and slightly decreases toward periphery with values ranging from 98 to 90 percent suggesting the hepatic artery is the main supplier of blood. Arterial (portal Venous) flow is higher (lower) inside tumor and lower (higher) in normal-appearing liver in Figure 1.e (1.f). While liver parenchyma shows no significant hepatic artery and portal vein delays (Figures 1.g,1.h) blood from hepatic artery arrives at the tumor with minimal delay and tends to take longer (5-15sec) in portal vein.
Discussion
Our fast LLS fitting method for quantitatively mapping perfusion parameters vastly reduces computation time by a factor of about 300 comparing to current method. Estimation of the optimum arterial and portal venous input delays is a critical step in quantitative perfusion (1) but consumes most of the computation time. Our LLS method of efficient computation has for the first time made this task possible in practice, allowing physicians to study perfusion parameter maps that reflect local pathological changes more informatively than the current limited ROI analysis.Conclusion
A Linear Least Squares perfusion quantification method is presented to vastly accelerate computation in delay corrected perfusion quantification, enabling liver perfusion mapping with corrected dual arterial and portal venous delays.Acknowledgements
This research was supported by NIH grants R01CA181566, R01NS072370, R01NS090464, and R01NS095562.References
1. Calamante F, Gadian DG, Connelly a. Delay and dispersion effects in dynamic susceptibility contrast MRI: simulations using singular value decomposition. Magn. Reson. Med. 2000;44:466–473. doi: 10.1002/1522-2594(200009)44:3<466::AID-MRM18>3.0.CO;2-M.
2. Cooper M a, Nguyen TD, Xu B, Prince MR, Elad M, Wang Y, Spincemaille P. Patch based reconstruction of undersampled data (PROUD) for high signal-to-noise ratio and high frame rate contrast enhanced liver imaging. Magn. Reson. Med. [Internet] 2014;0:1587–1597. doi: 10.1002/mrm.25551.
3. Sourbron S, Biffar A, Ingrisch M, Fierens Y LR. PMI: platform for research in medical imaging. Magn Reson Mater Phy. 2009;22:539.
Figures