1913
Patlak analysis of dynamic gadoxetic acid-enhanced MR imaging is an effective and simpler alternative to compartmental pharmacokinetic modelling for assessing liver function1CRUK Cancer Imaging Centre, Division of Radiotherapy and Imaging, Institute of Cancer Research, Sutton, United Kingdom, 2Departent of Radiology, Royal Marsden NHS Foundation Trust, Sutton, United Kingdom, 3Siemens Healthcare, Erlangen, Germany
Synopsis
Liver perfusion and function can be assessed using gadoxetic acid combined with DCE-MRI imaging and pharmacokinetic (PK) modelling. Whilst compartmental PK models give a good account of the contrast changes over the first five minutes of enhancement, the Patlak graphical approach is a simpler alternative that is more easily implemented. Patlak evaluation requires the specification of a delay time after which the initial transients in the uptake curves have decayed, so the purpose of this abstract is to present a preliminary evaluation of the sensitivity of liver uptake rate estimates to the Patlak delay time.
Background
Liver perfusion and function can be assessed using the hepatobiliary contrast agent gadoxetic acid combined with DCE-MRI imaging and pharmacokinetic (PK) modelling. One such PK model has been proposed by Sourbron et al.1 and adds an additional compartment to the standard dual-input one-compartment liver model to describe one-way transport from the extra-cellular space into the intra-cellular space. This model gives a good account of the contrast changes seen in liver over the first five minutes or so of enhancement, and makes the assumption that in this time there is negligible loss of contrast from the imaged tissue due to biliary transport. The graphical approach developed by Patlak et al.2 makes the same assumptions and is a simpler and more easily implemented technique than non-linear model fitting. Patlak evaluation requires the specification of a delay time after which the initial transients in the uptake curves have decayed – the slope of the Patlak plot after this time is the hepatic uptake rate parameter that is of use in clinical liver function assessment. The purpose of this abstract is to present a preliminary evaluation of the sensitivity to the delay time of the liver uptake rate estimation from Patlak analysis.Methods
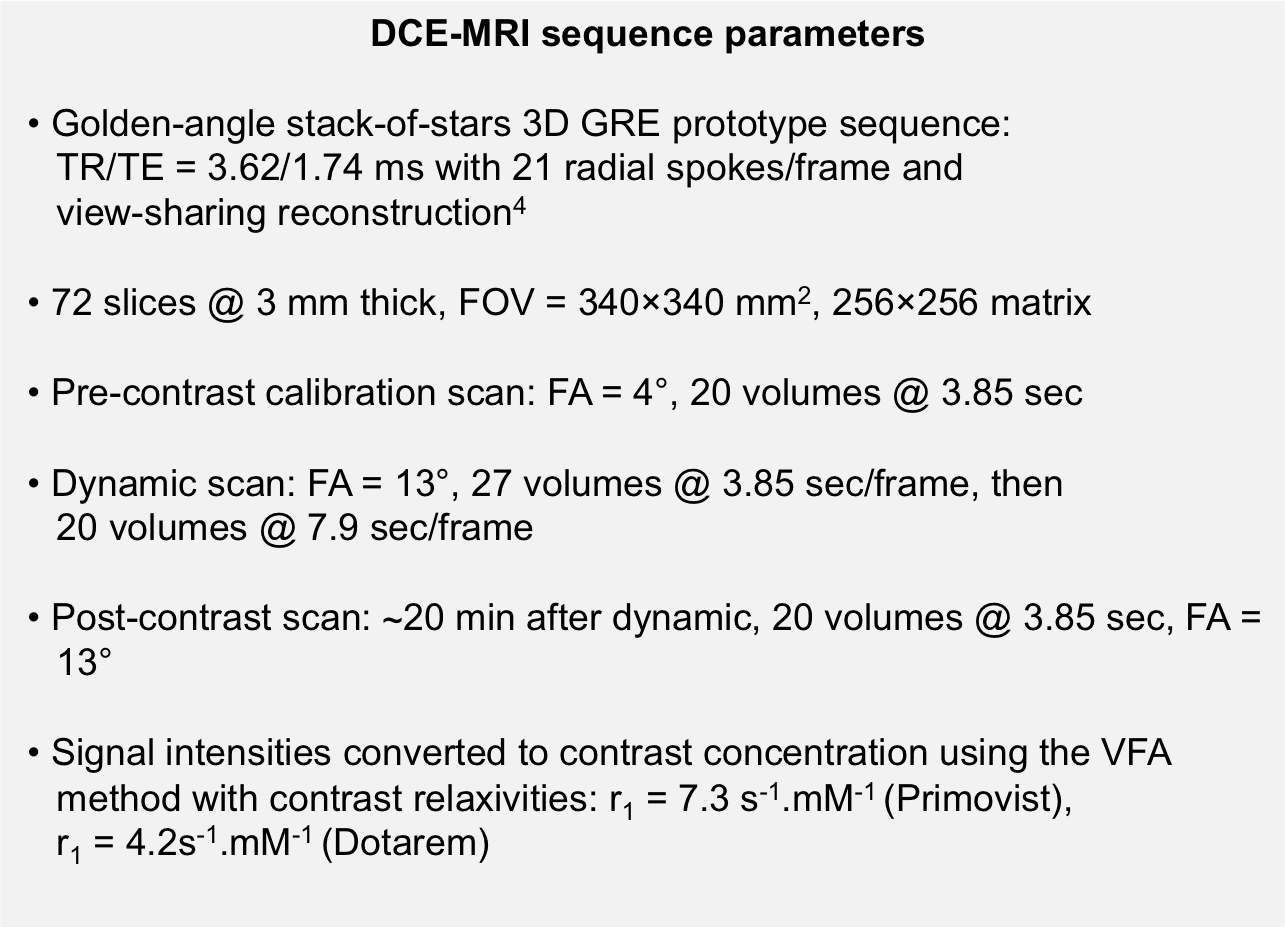
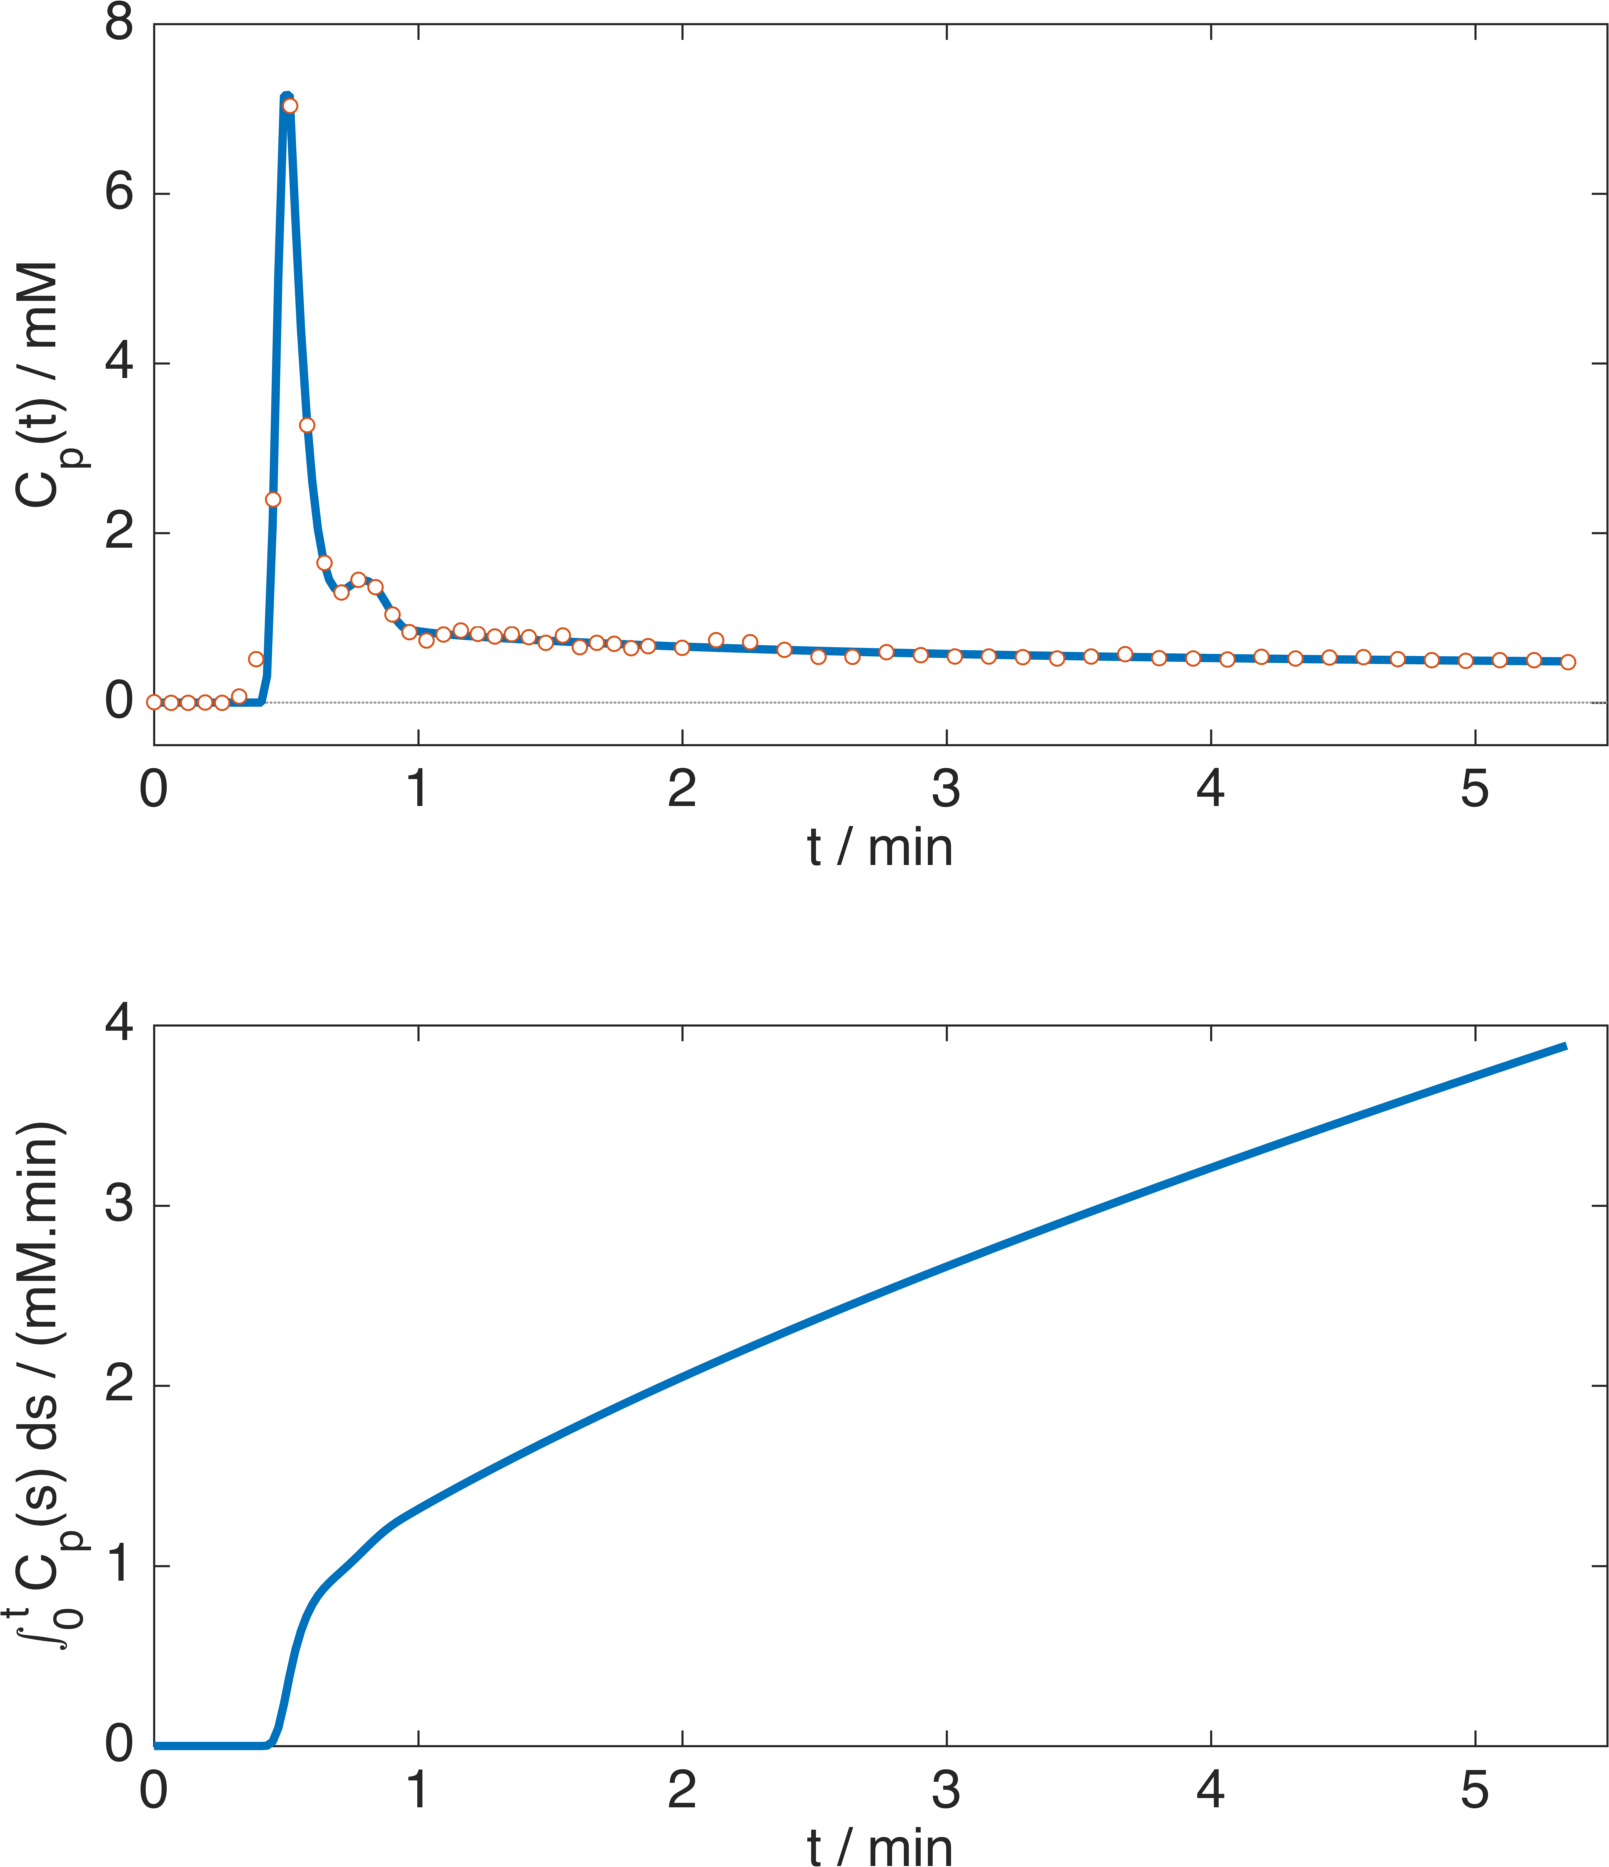
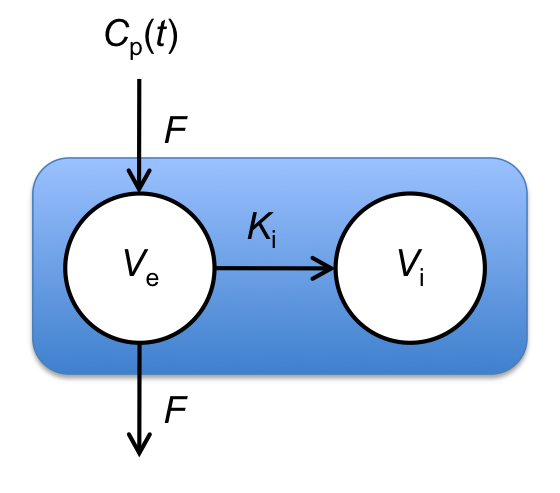
Four consented patients were imaged at 1.5T using a MAGNETOM Aera (Siemens Healthcare, Erlangen, Germany) with a prototype sequence with view-sharing reconstruction, described in Figure 1. Three patients received gadoxetic acid (Primovist at 0.1ml/kg at 1ml/sec then 20ml saline at 1ml/sec), and one received gadoteric acid (Dotarem at 0.2ml/kg, same delivery). Gadoteric acid is not taken up by the liver, so this patient acted as a negative control. Arterial input function (AIF) data were obtained from the aorta, and flip-angle corrections (to account for in-flow effects) were used to ensure a pre-contrast blood T1 of 1200ms in each patient. To reduce the effect of noise, arterial data were fitted with a previously described AIF model3, and plasma concentrations were obtained assuming a haematocrit of 0.42, see Figure 2 for an example. Algebraic integration of the AIF was used in the Patlak computation, which performs linear regression of$$$\;C_\mathrm{t}(t)\;/\;C_\mathrm{p}(t)\;$$$onto$$$\;\left[\int_0^tC_\mathrm{p}(s)\;ds\right]\;/\;C_\mathrm{p}(t)\;$$$for$$$\;t\;$$$greater than some time$$$\;t^*,\;$$$from which the slope and intercept are estimates of$$$\;K_\mathrm{i}\;$$$(min-1, liver uptake rate parameter) and the distribution volume fraction respectively. The delay term$$$\;t^*\;$$$was set to 0.25,$$$\;$$$0.5,$$$\;$$$1 and 2 minutes after the contrast arrival time. The Patlak model assumes a single input function, whereas the Sourbron PK model considers a dual input to account for contrast arriving from the hepatic portal vein. To make the comparison more direct the PK model was simplified to consider only a single input, see Figure 3.
Results
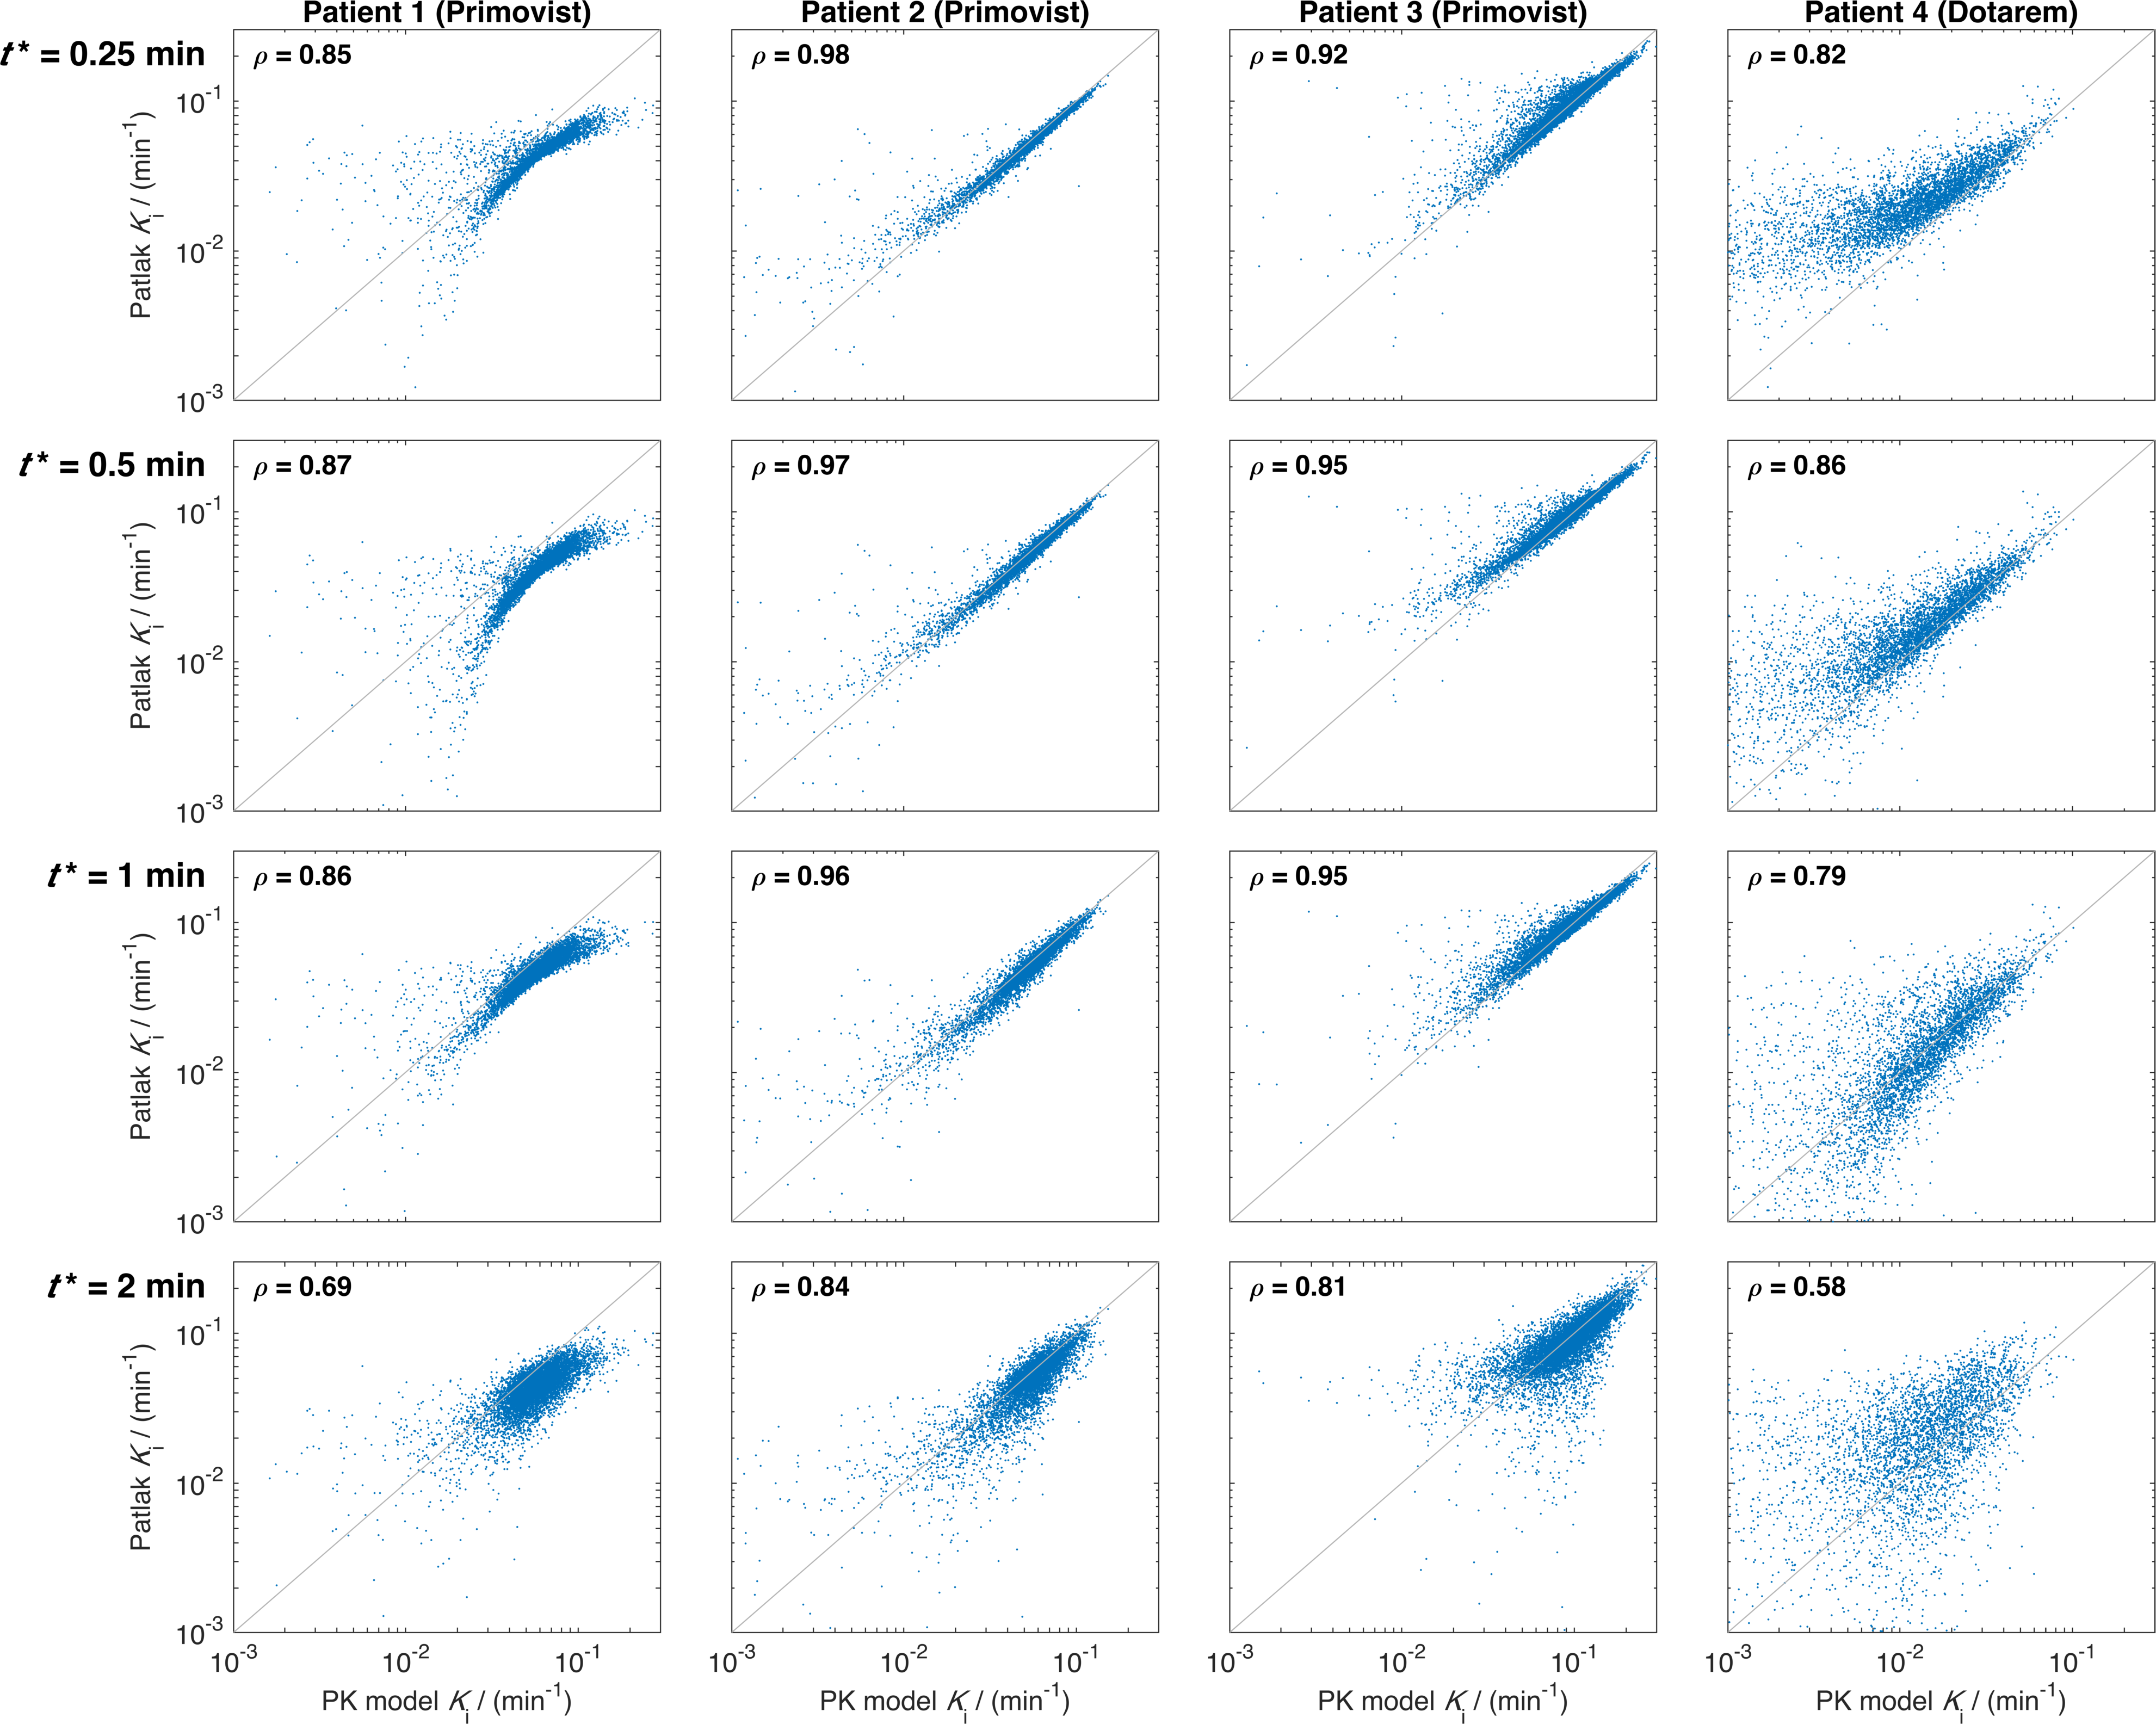
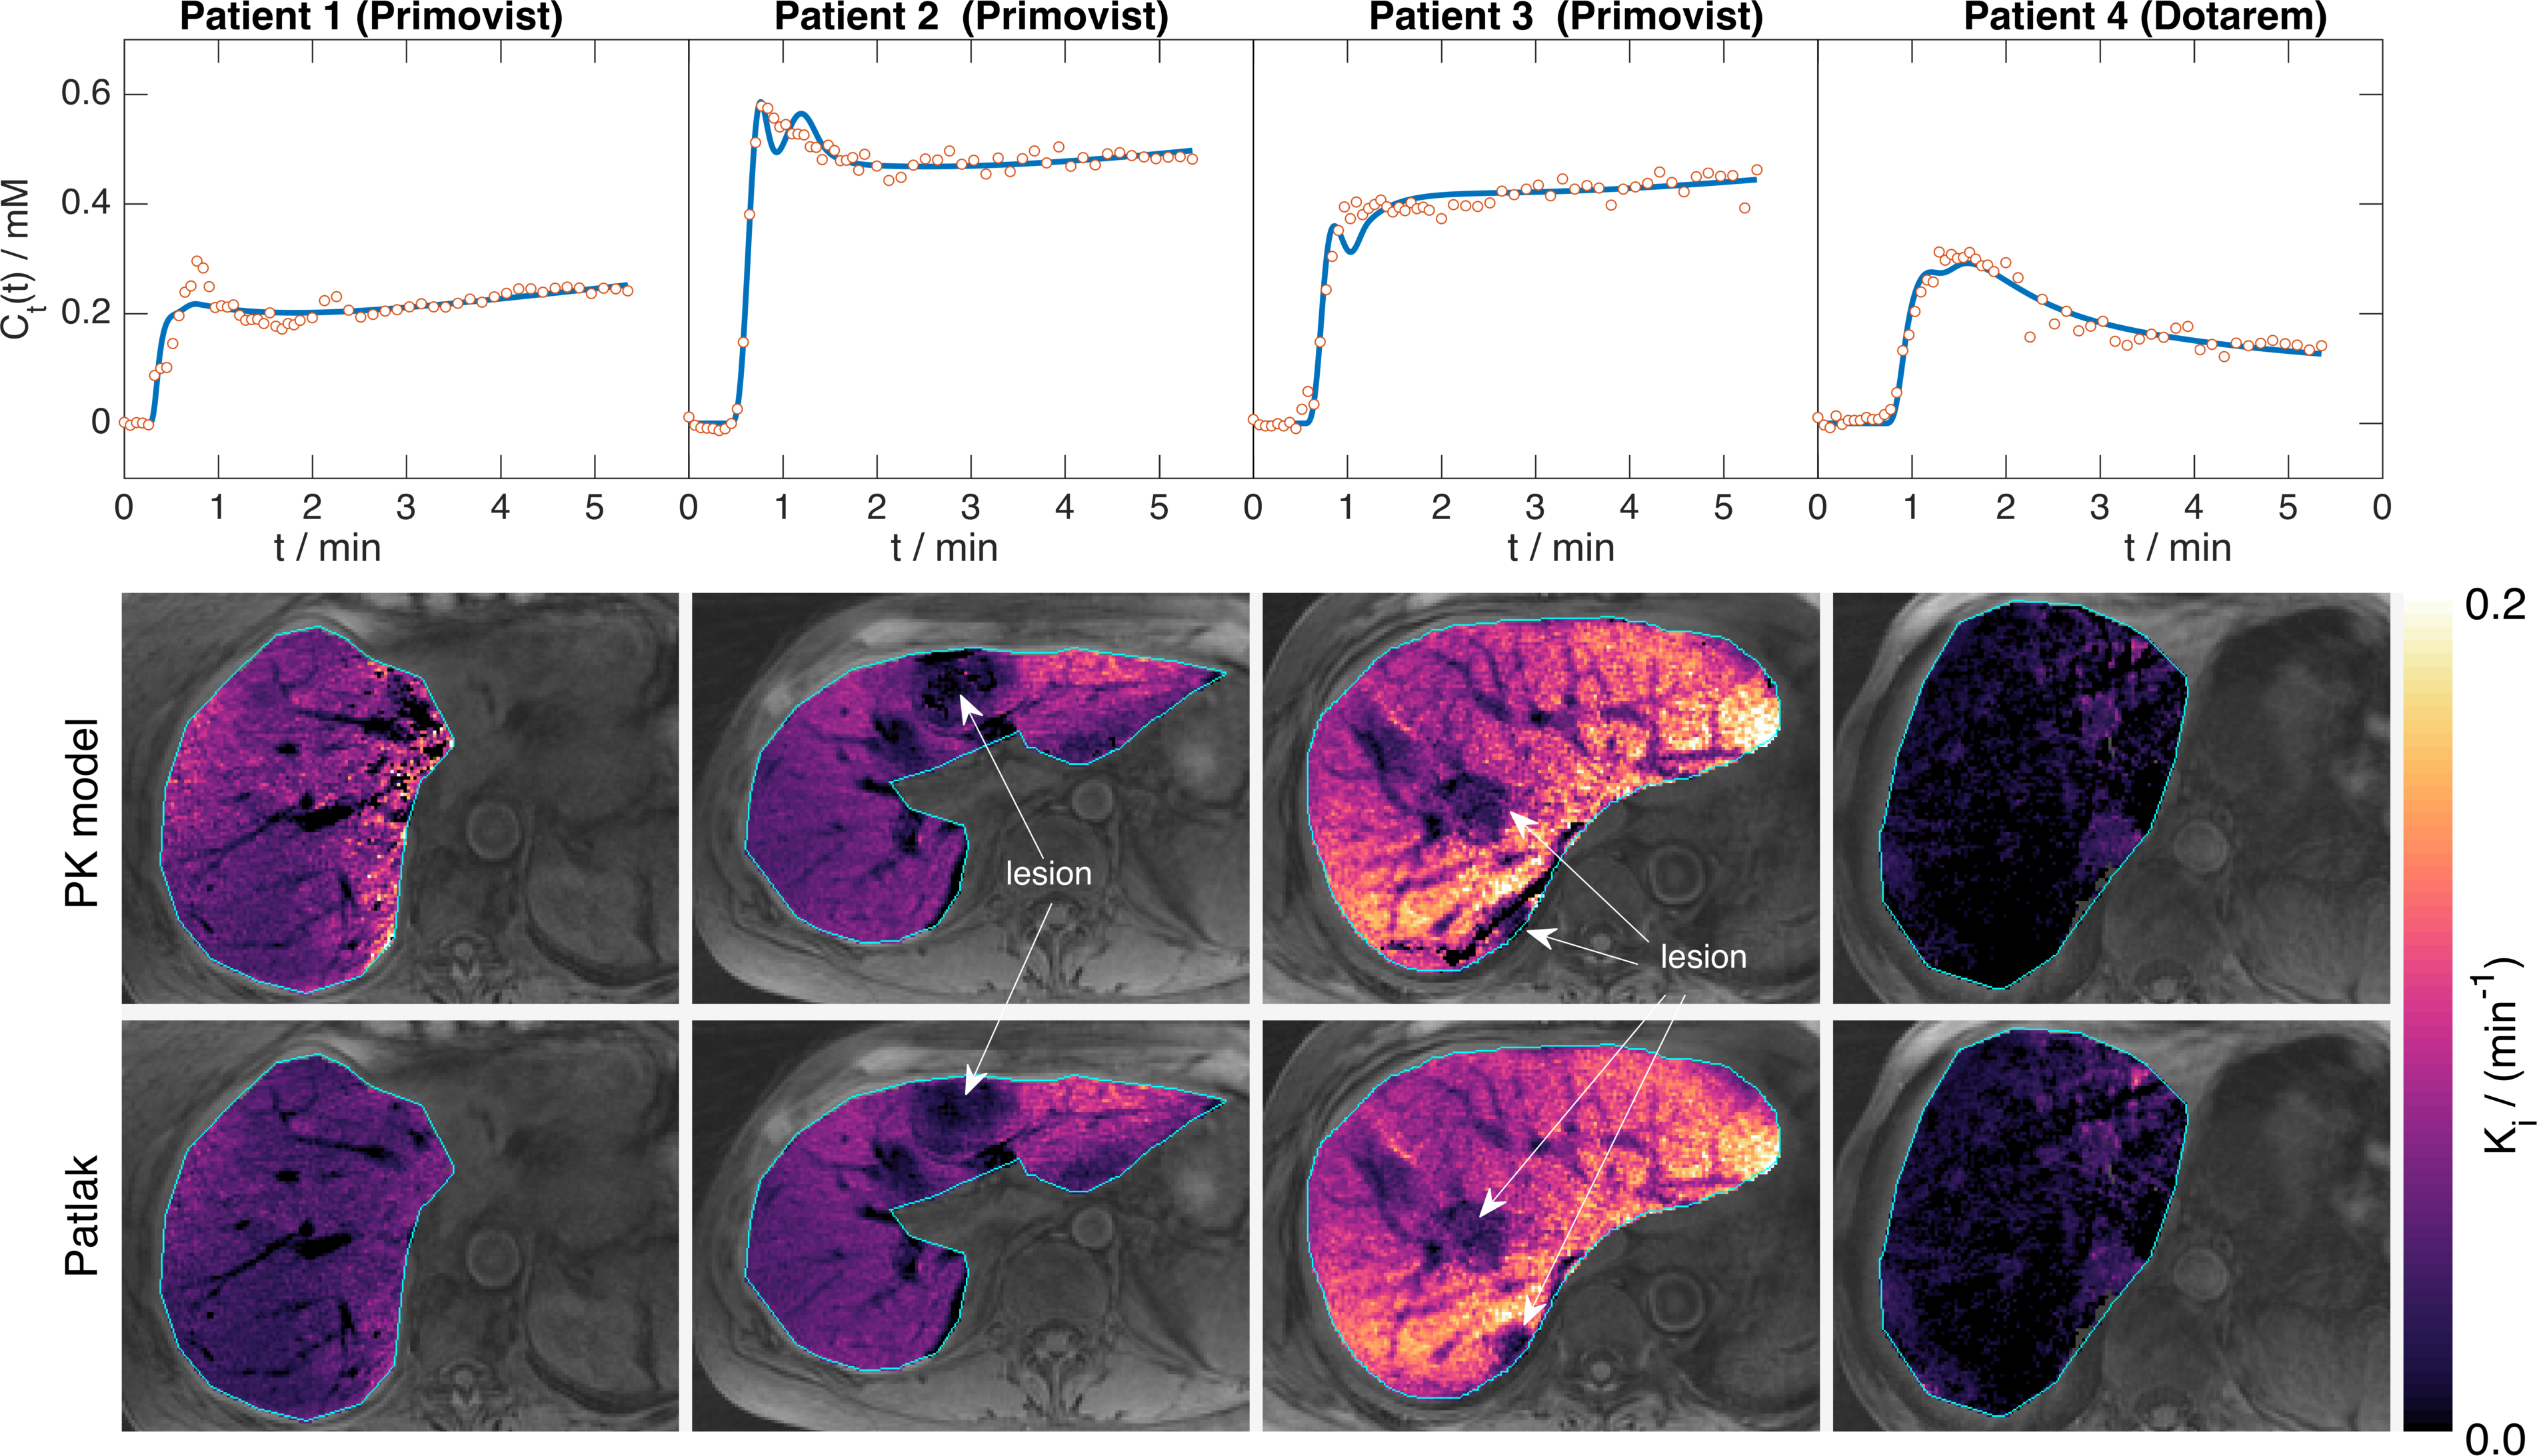
Figure$$$\;$$$4 shows good visual correlation between PK and Patlak estimates of$$$\;K_\mathrm{i}\;$$$ for the three Primovist patients, which is largely reflected in the Spearman’s$$$\;$$$ρ statistics. For patients$$$\;$$$2 and$$$\;$$$3 there is very little difference in the correlations for all$$$\;t^*\leq\;$$$1$$$\;$$$min, while for patient$$$\;$$$1 the scatter plots indicate an increasingly non-linear relationship as$$$\;t^*\;$$$decreases (probably linked to the long initial transient seen in the uptake curve, see Figure 5). Estimates of$$$\;K_\mathrm{i}\;$$$in the Dotarem patient are lower than the other patients (median$$$\;K_\mathrm{i}\;$$$from PK estimates:$$$\;$$$Primovist (patients 1-3):$$$\;$$$0.034,$$$\;$$$0.038,$$$\;$$$0.087$$$\;$$$min-1; Dotarem (patient 4):$$$\;$$$0.011$$$\;$$$min-1), and the correlation between PK and Patlak estimates is also weaker in this patient. Figure$$$\;$$$5 shows maps of$$$\;K_\mathrm{i}\;$$$from the PK and Patlak estimates with$$$\;t^*=\;$$$0.5$$$\;$$$showing a very strong visual correspondence. The graphs in this Figure show a wide range of average curve shapes, and particularly highlight the continued contrast uptake in the Primovist patients that is absent in the Dotarem patient. Visualisation of the gall bladder in the final dynamic volume confirmed that contrast had not reached this organ during the scan for all patients, and so the no-loss assumption for the Patlak analysis is satisfied.Discussion
These data suggest that$$$\;t^*=\;$$$0.5$$$\;$$$min may be a suitable value for Patlak analysis in future studies, although the non-linear relationship between PK and Patlak estimates for all$$$\;t^*\;$$$in patient$$$\;$$$1 suggest that PK analysis may be necessary in some circumstances. The non-linear relationship was not observed for$$$\;t^*=\;$$$2$$$\;$$$min in this patient at the expense of greater errors, suggesting that$$$\;t^*\geq\;$$$2 mins may be necessary to reduce the non-linearity. However, this would potentially require longer scan times to reduce the Patlak analysis error to acceptable levels. Further work is needed to assess the impact of a dual-input model – it is anticipated that the Patlak approach will be invariant to the presence/absence of a portal input function since$$$\;t^*\;$$$can$$$\;$$$be chosen to be at a time where the arterial and portal plasma concentrations are equal. This study suggests that Patlak analysis is an effective method of quantifying liver function from DCE-MRI data.Acknowledgements
CRUK and EPSRC support to the Cancer Imaging Centre at The Institute of Cancer Research and The Royal Marsden Hospital in association with the MRC and Department of Health (England) (C1060/A10334, C1060/A16464) and NHS funding to the NIHR Biomedical Research Centre and the Clinical Research Facility in Imaging at The Royal Marsden and the ICR.References
1. Sourbron S, Sommer WH, Reiser MF, Zech CJ. Combined quantification of liver perfusion and function with dynamic gadoxetic acid-enhanced MR imaging. Radiology. 2012; 263(3):874-83.
2. Patlak CS, Blasberg RG, Fenstermacher JD. Graphical evaluation of blood-to-brain transfer constants from multiple-time uptake data. J Cereb Blood Flow Metab. 1983; 3(1):1-7.
3. Rata M, Collins DJ, Darcy J, Messiou C, Tunariu N, Desouza N, Young H, Leach MO, Orton MR. Assessment of repeatability and treatment response in early phase clinical trials using DCE-MRI: comparison of parametric analysis using MR- and CT-derived arterial input functions. Eur Radiol. 2016; 26(7):1991-8.
4. Winkelmann S, Schaeffter T, Koehler T, Eggers H, Doessel O. An optimal radial profile order based on the Golden Ratio for time-resolved MRI. IEEE Trans Med Imaging. 2007; 26(1):68-76.
Figures