1911
Nested tracer-kinetic model-based DCE-MRI reconstruction from under-sampled data1Electrical Engineering, University of Southern California, Los Angeles, CA, United States, 2Biomedical Engineering, Case Western Reserve University, Cleveland, OH, United States, 3GE Healthcare, Calgary, Canada
Synopsis
We propose a novel nested tracer-kinetic (TK) model based constrained reconstruction method for DCE-MRI reconstruction from under-sampled data. This approach models the concentration time profiles as a sparse linear combination of temporal bases constructed from TK models of varying complexity. Subspaces from the models of plasma volume, Patlak, and the extended-Tofts are constructed. A spatial mask determining the TK model complexity at every pixel location is derived. Reconstruction involves iteration between data consistency and pixel wise projection of the concentration profiles on one of the three subspaces. We demonstrate its utility in retrospective under-sampled reconstruction of brain tumor DCE-MRI datasets.
Purpose
DCE-MRI is a powerful technique that provides a quantitative measure of vascular permeability and interstitial volumes. Sparse sampling and constrained reconstruction methods have shown to improve imaging trade-offs in DCE-MRI 1-5. Recently, tracer-kinetic (TK) models have been applied as temporal constraints to enable reconstruction from under-sampled data6-8. This has shown improved fidelity of TK mapping over the use of off-the-shelf constraints4-5. Here, we extend the approach to include TK models of varying complexity on a pixel-by-pixel basis10. We develop a nested model framework with the plasma volume (vp), Patlak, and the extended-Tofts (e-Tofts) models. We demonstrate its utility in retrospective under-sampled reconstruction of brain tumor DCE-MRI.Methods
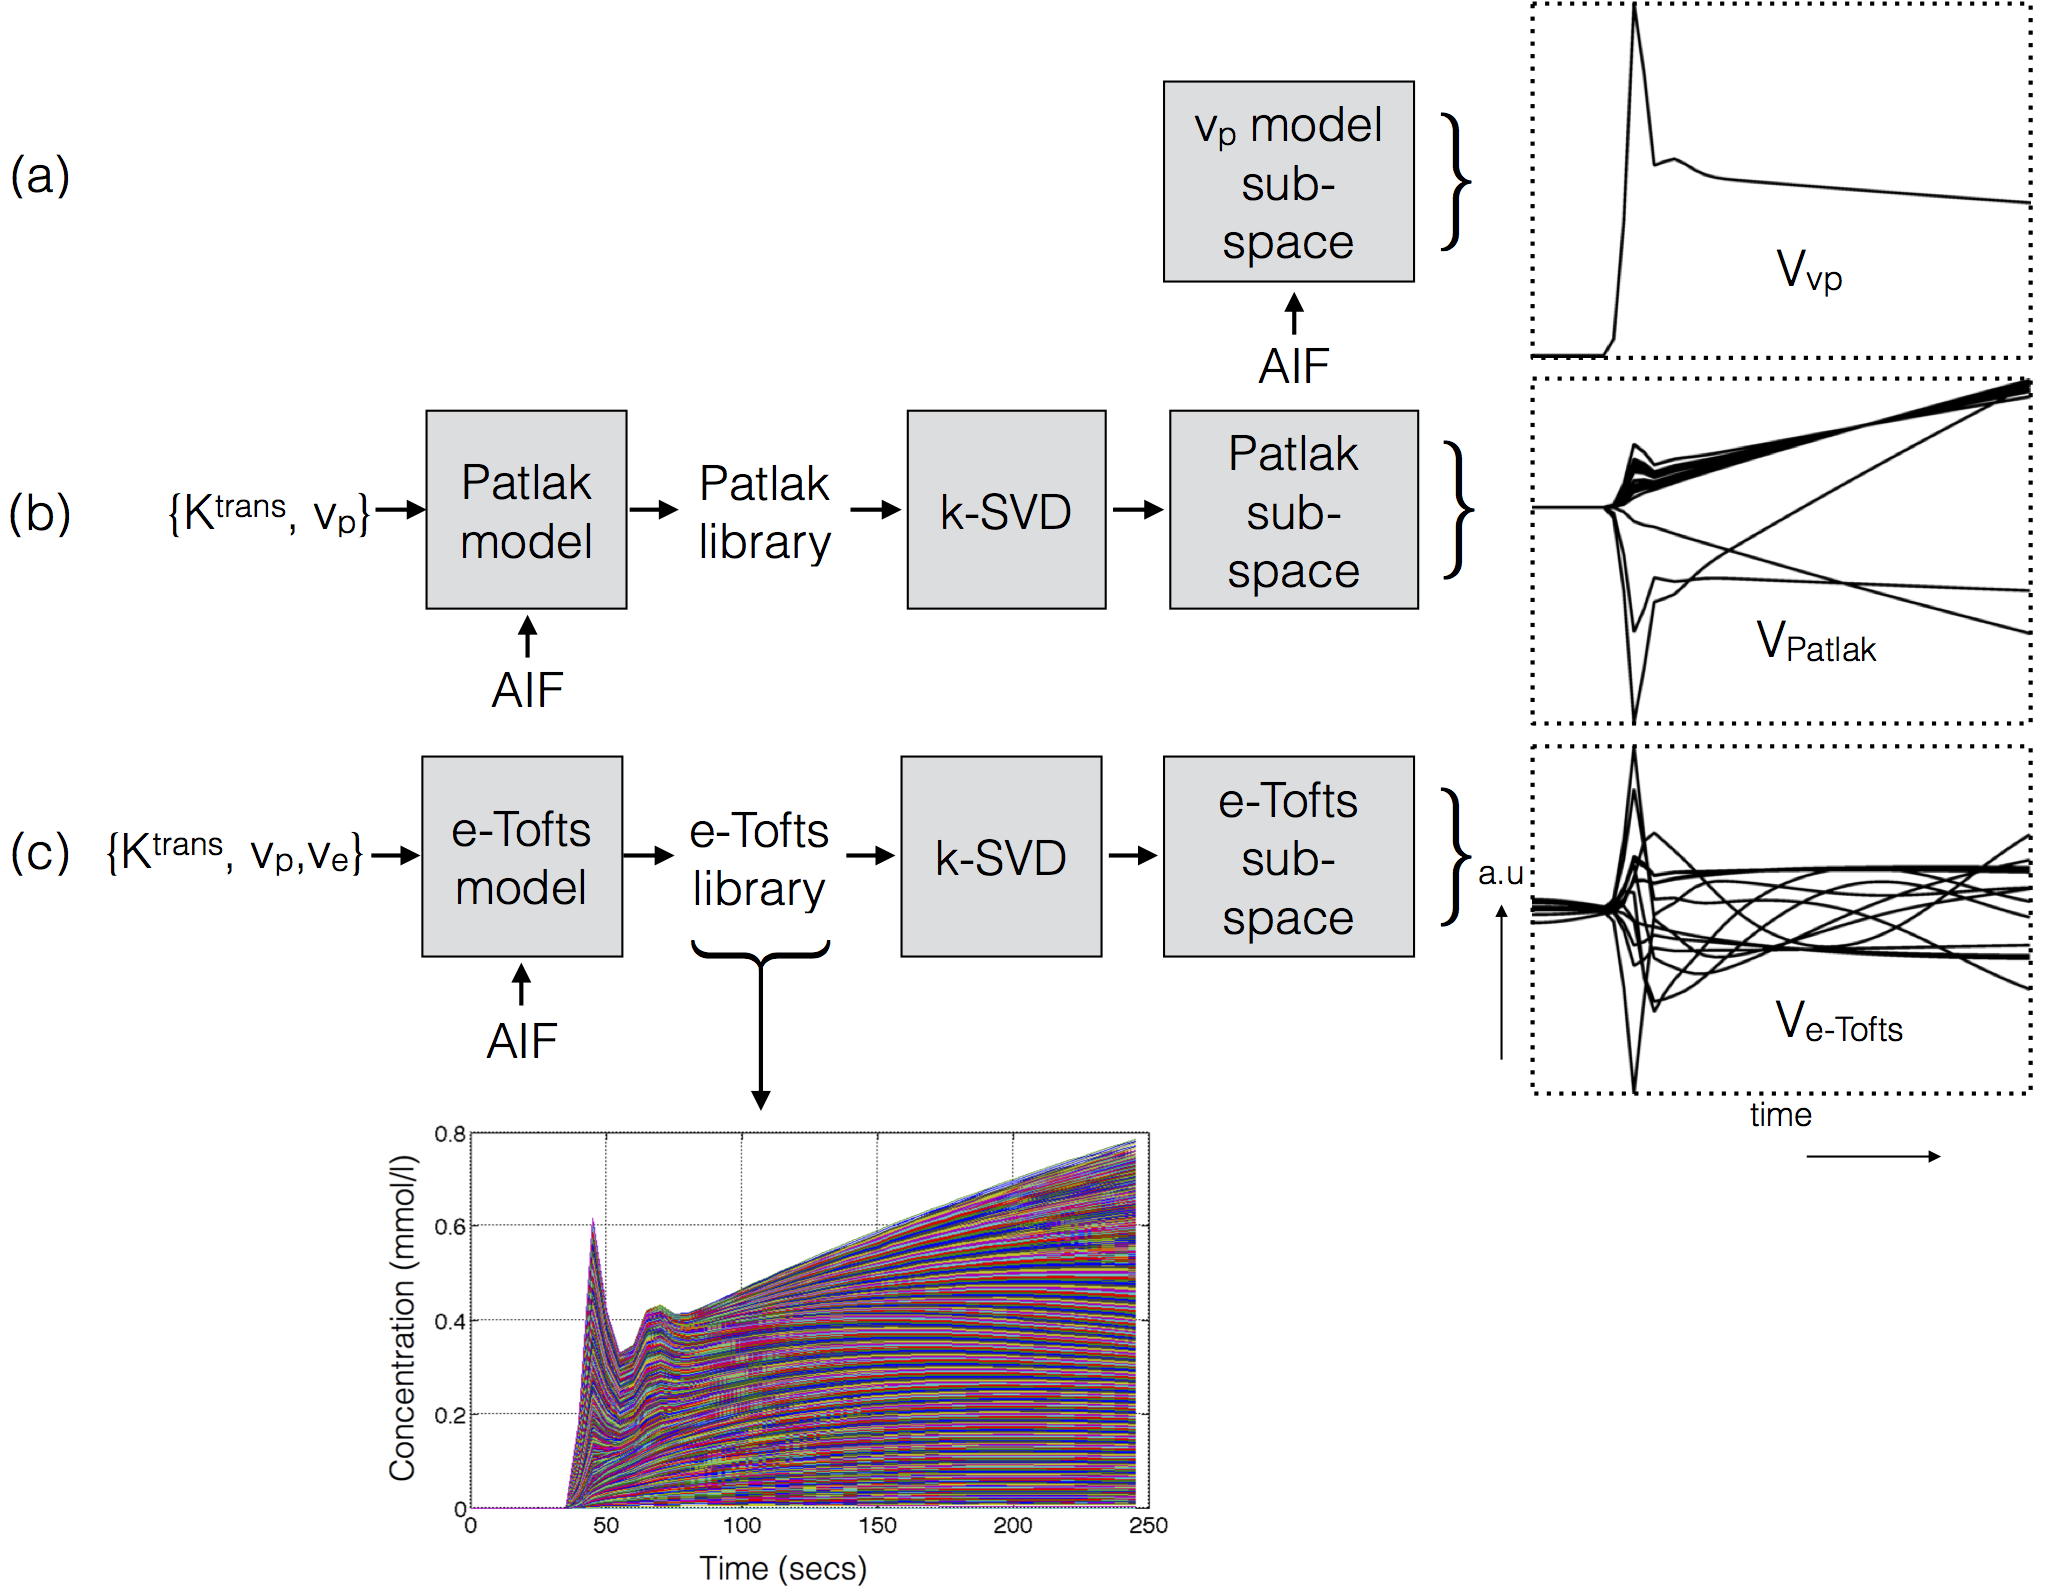
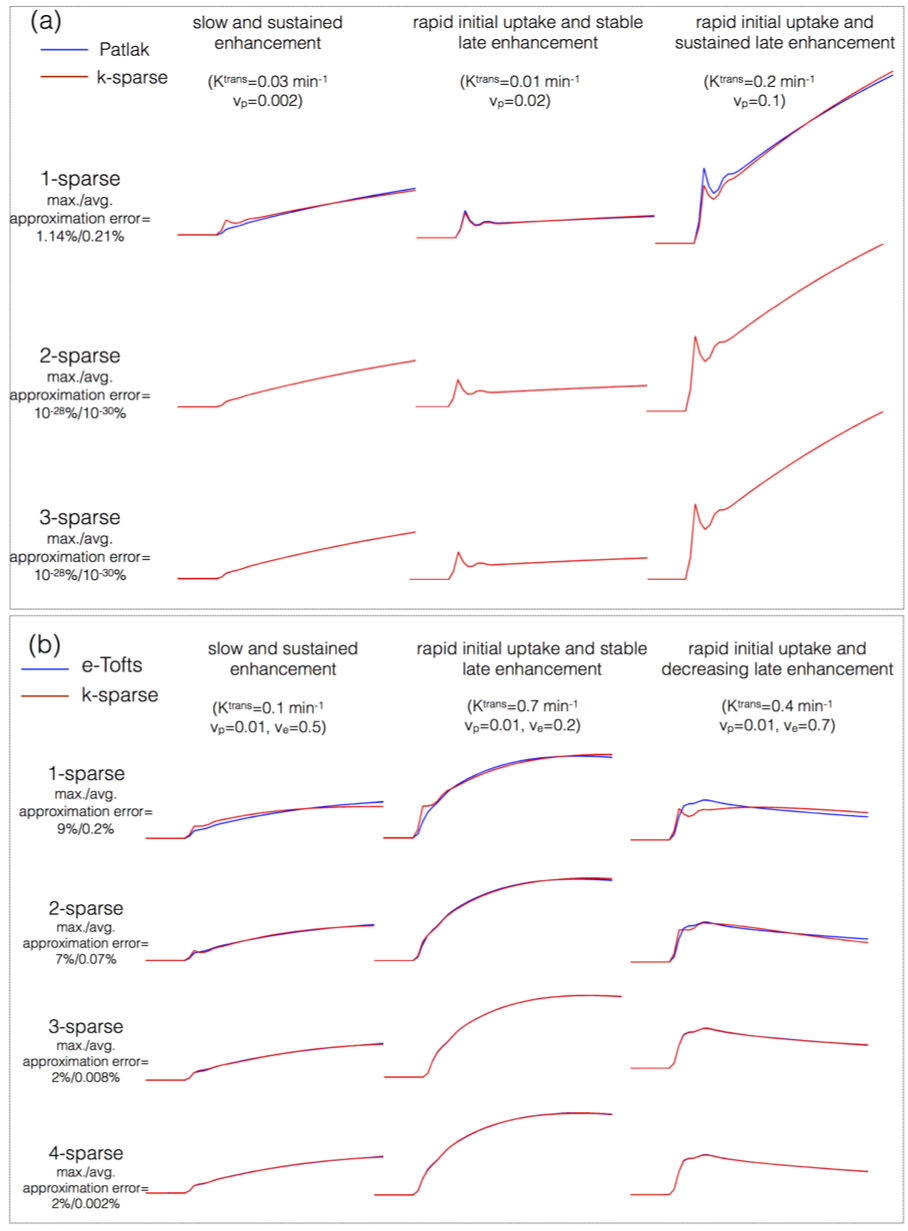
Construction of TK model subspaces: The pipeline of constructing temporal sub-spaces from different TK models is shown in Figure 1. For the vp model, we use a known arterial input function (AIF) as the subspace. For the Patlak, and the e-Tofts models, libraries of concentration-time profiles are simulated in the range of Ktrans=0-0.8 min-1, vp=0-60%, and ve=0-80%. A broad range of parameters is chosen to ensure coverage of the physiological kinetic parameter space. k-SVD 9 is used to derive subspaces (denoted by $$$V_{r \times N}$$$ ), where any time profile in the library is modeled as a “k-sparse” combination of bases from the sub-space. Here $$$r$$$ represents the number of temporal bases and $$$N$$$ the number of time instances. Previous studies showed that k=2 and 3 respectively was adequate for modeling time profiles from the Patlak and e-Tofts models (also see Figure 2).
Nested TK model-based reconstruction: We pose the estimation of the concentration-profiles ( $$$\mathbf \Gamma_{M \times N}$$$ $$$M$$$- number of pixels; $$$N$$$ - number of time frames), and the sparse coefficient matrix $$$\mathbf U_{M \times r}$$$ from under-sampled k-t data $$$(\mathbf b)$$$ as:$$\begin{align} min_{\mathbf \Gamma, \mathbf U}\|A(\mathbf \Gamma)-\mathbf b\|_2^{2}; \\ s.t., \mathbf \Gamma=\mathbf U\mathbf V_{v_p}; \|u_p\|_0\leq 1; p \epsilon \{\psi_{\rm v_p}\} \\ s.t., \mathbf \Gamma=\mathbf U\mathbf V_{\rm Patlak}; \|u_p\|_0\leq 2; p \epsilon \{\psi_{\rm Patlak}\} \\ s.t., \mathbf \Gamma=\mathbf U\mathbf V_{\rm e-Tofts}; \|u_p\|_0\leq 3; p \epsilon \{\psi_{\rm e-Tofts}\} \end{align}$$
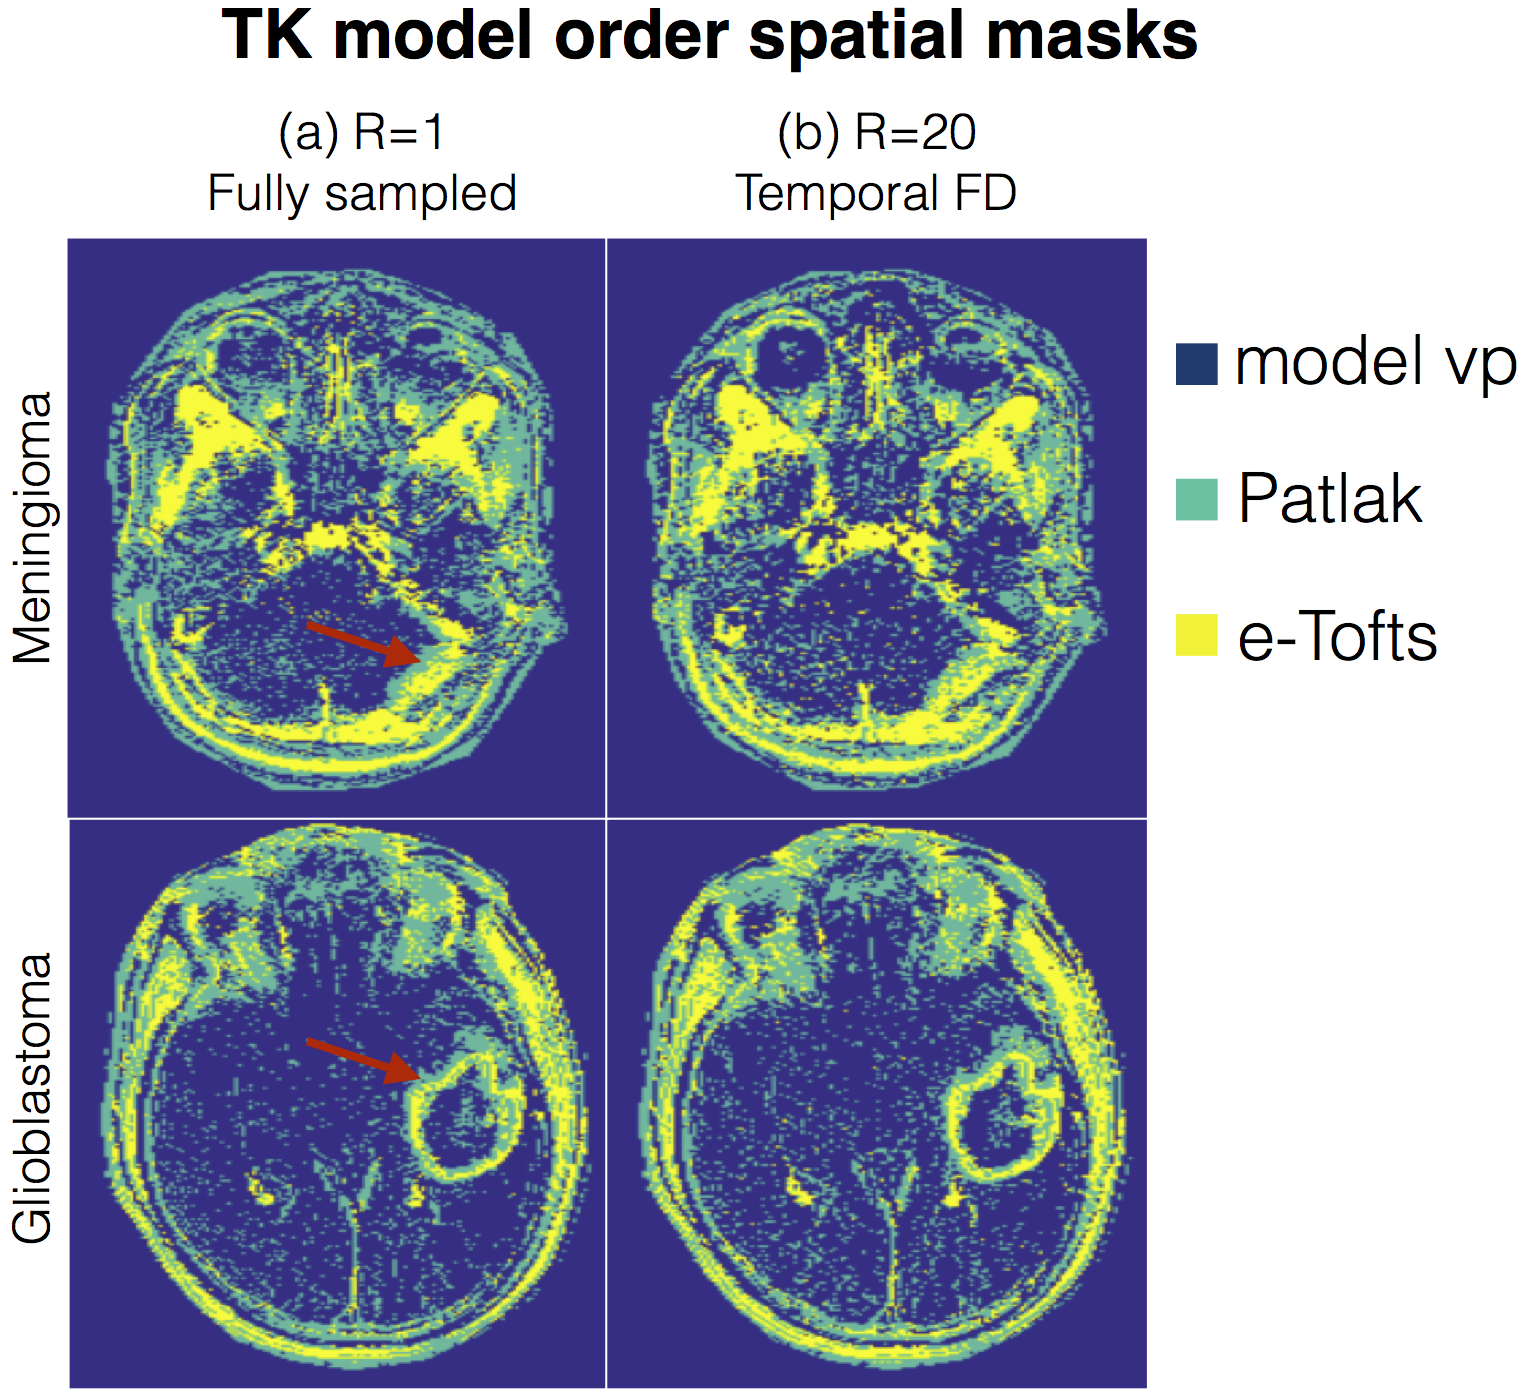
$$$p$$$ is indexed over pixels. $$$\{\psi_{\rm v_p}, \psi_{\rm Patlak}, \psi_{\rm e-Tofts}\}$$$ are sets that denote the pixel locations respectively where the plasma volume, Patlak, and the e-Tofts models are appropriate; this constitutes the TK model order mask. This is obtained from a temporal finite difference (tFD) reconstruction, where a F-test statistic at p=10-5 is used to determine if a higher model order is warranted (see Figure 3)10-11. $$$\gamma(\mathbf x,t)$$$ is constrained to be either a 1, 2, or a 3-sparse combination of bases respectively from the subspaces $$$\mathbf V_{\rm vp}, \mathbf V_{\rm Patlak}, \mathbf V_{\rm e-Tofts}$$$. $$$A$$$ encompasses Fourier under-sampling, coil-sensitivity encoding, and mapping from concentration to signal intensity. The above is solved by iterating between (a) updating $$$\mathbf U$$$ on a pixel-by-pixel basis using orthogonal matching pursuit projection9 onto the subspace as determined by the model order mask, and (b) enforcing data consistency. After the concentration-time profiles are obtained, TK parameters are estimated by fitting the profiles to the appropriate TK model.
Analysis: We perform retrospective under-sampling experiments on fully-sampled DCE-MRI data sets (3T, Cartesian T1-weighted spoiled gradient echo, FOV: 22x22x4.2cm3 resolution: 0.9x1.3x7 mm3; 5 sec temporal resolution) from two brain tumor patients. AIFs were identified from a major vessel in the fully-sampled data and were used during construction of the subspaces. Under-sampling was performed using a randomized golden angle trajectory at 20 fold reduction factor. We compare against the tFD reconstruction.
Results
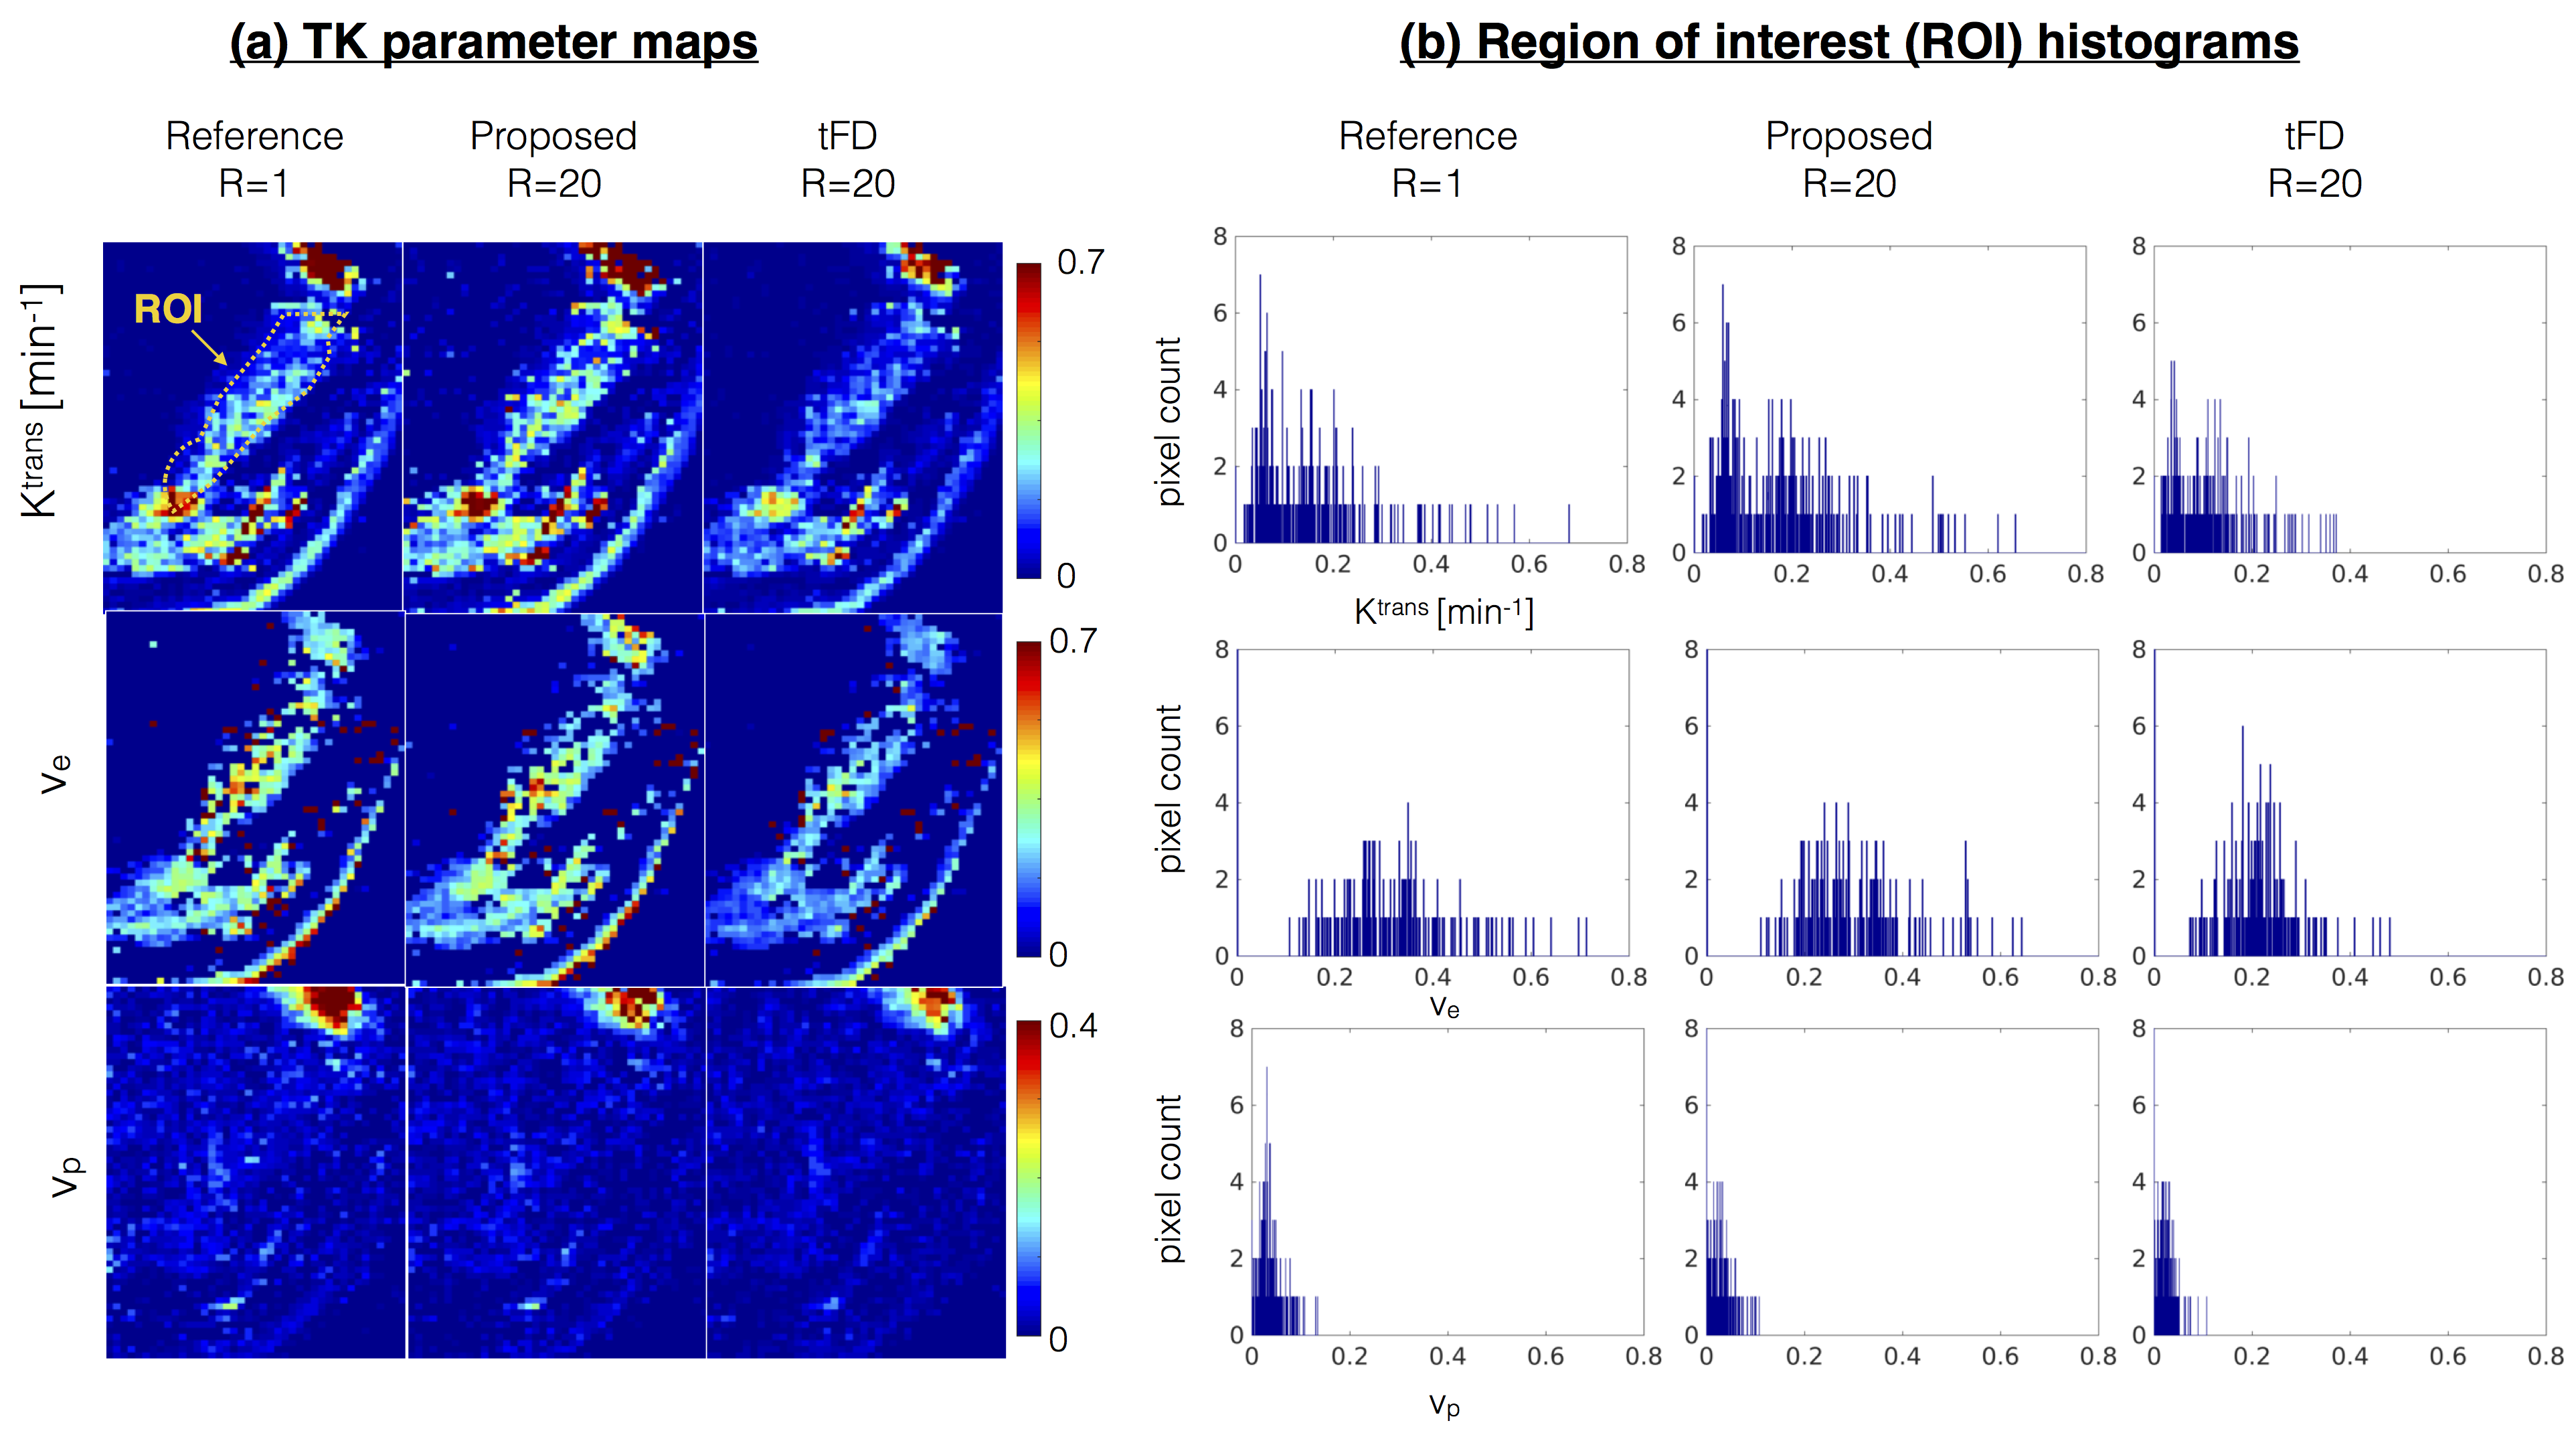
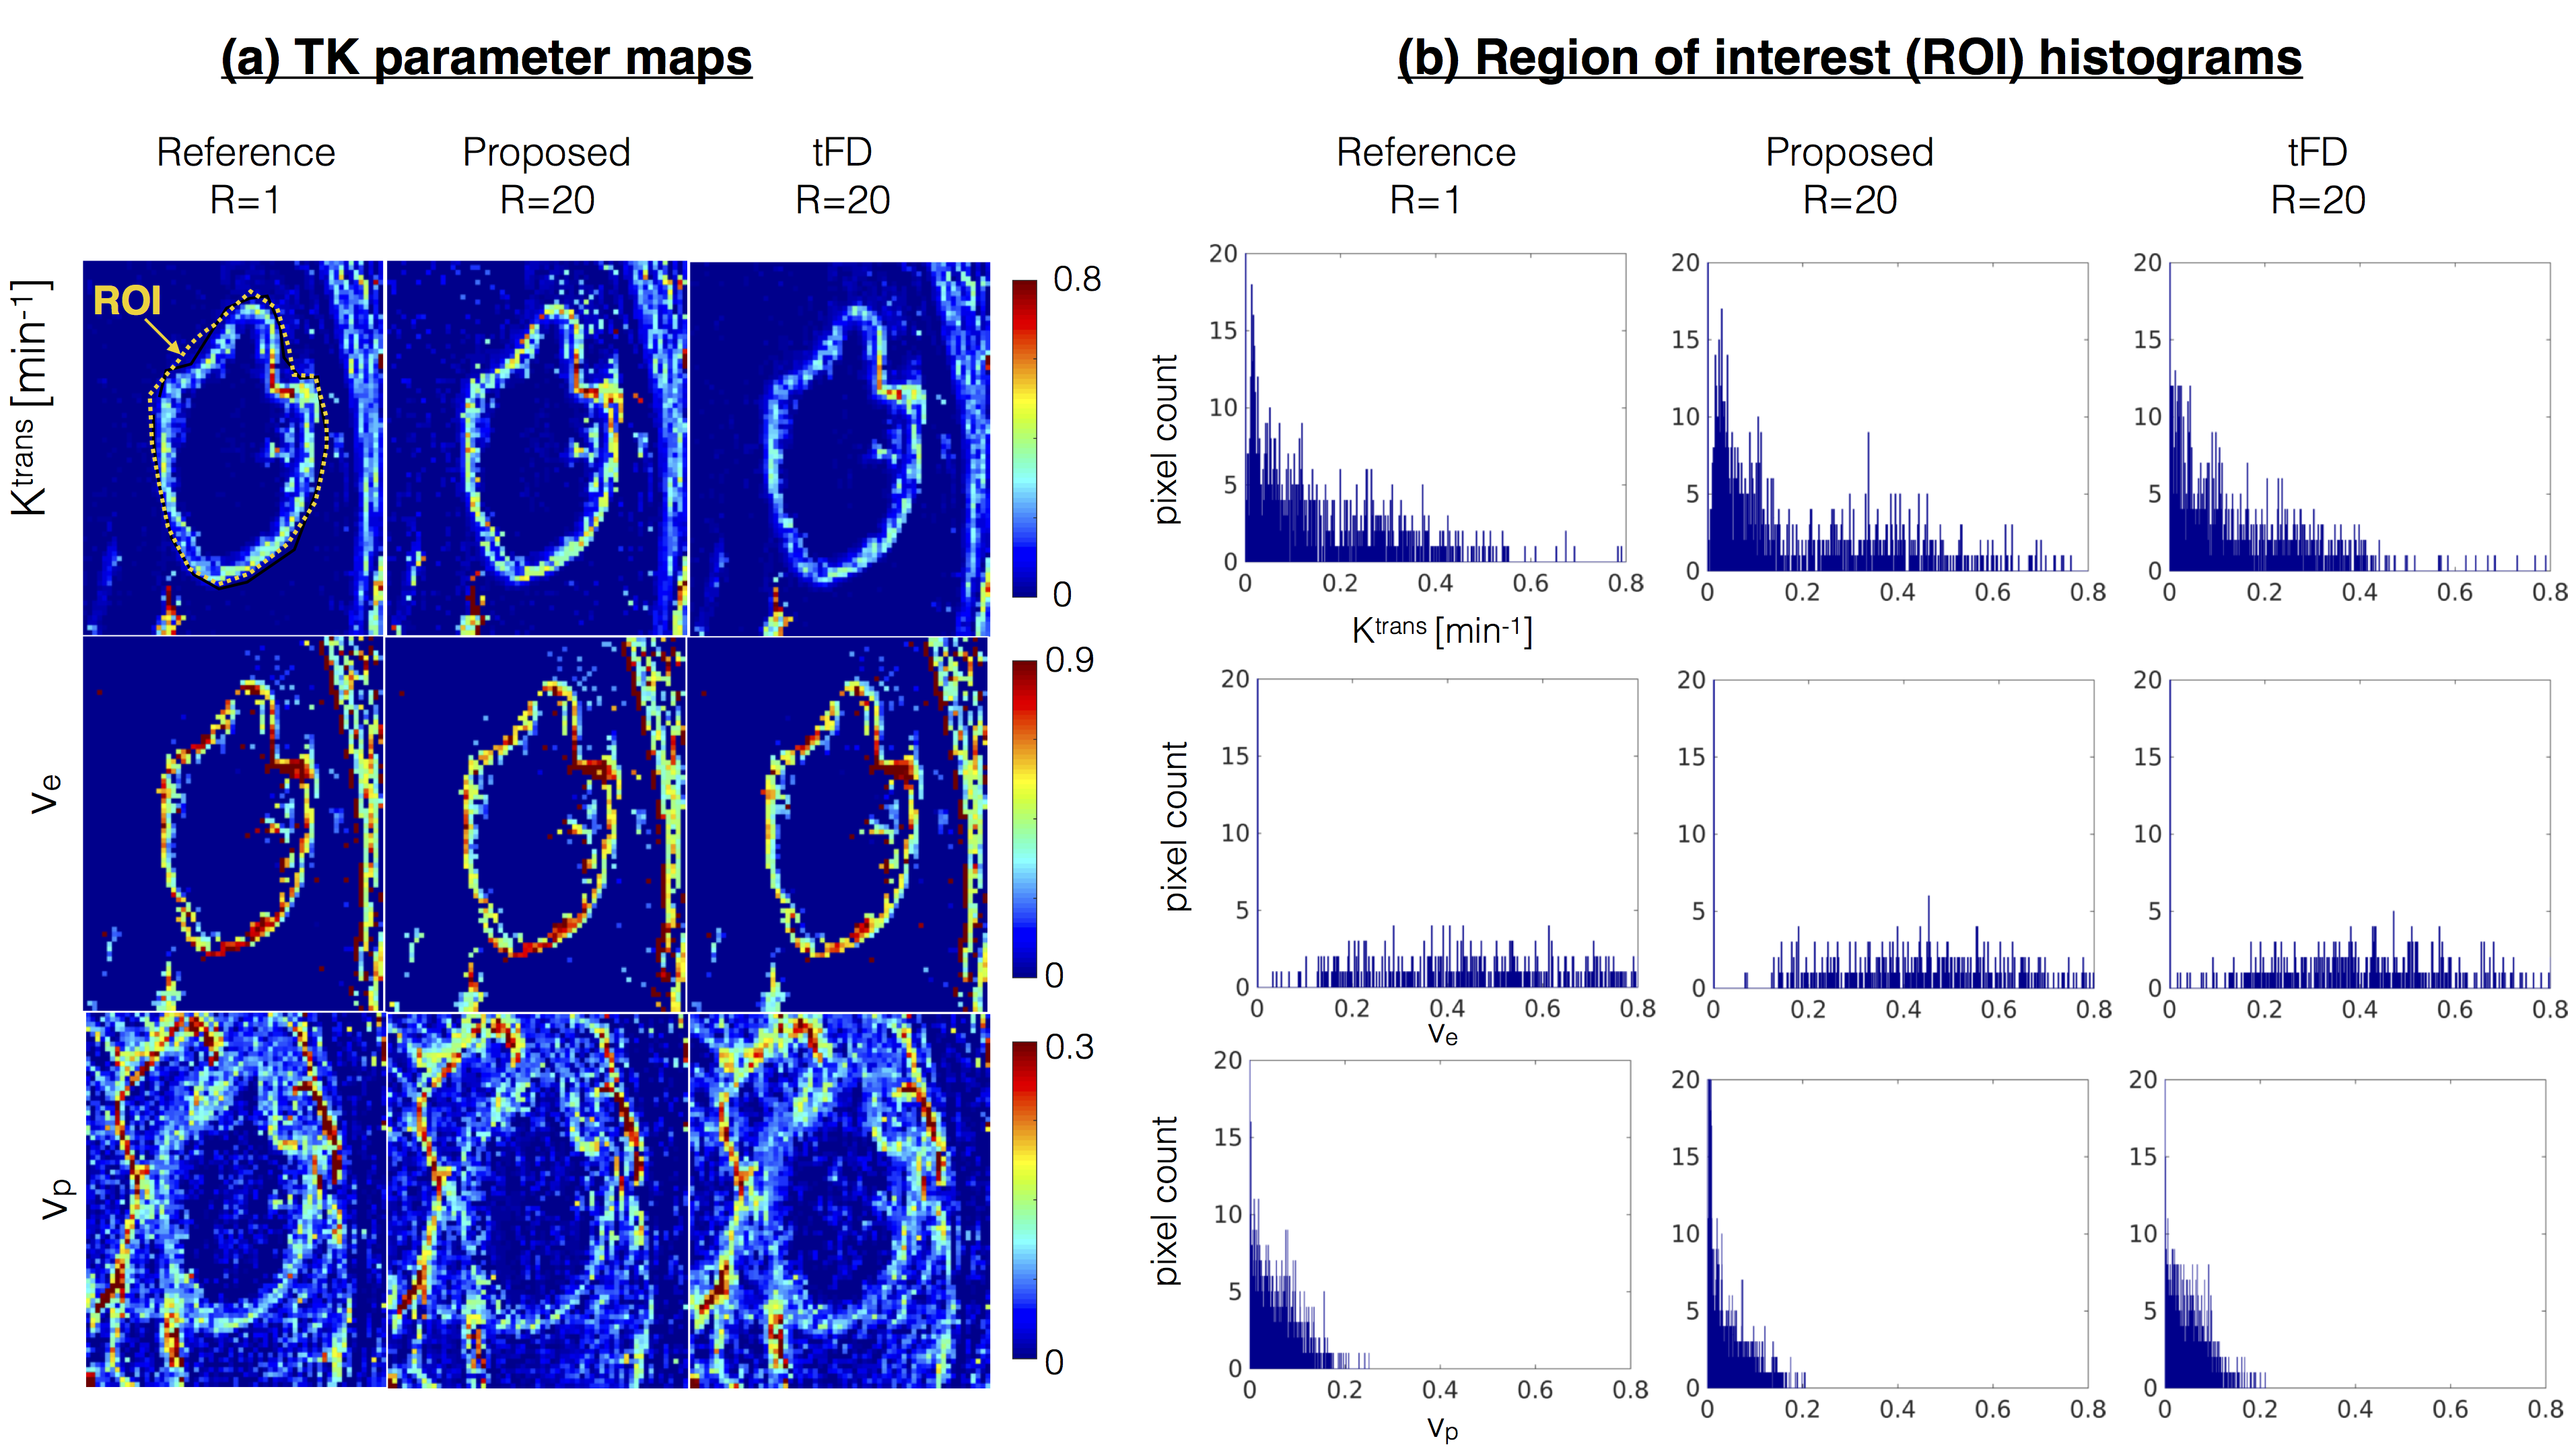
Figure 3 represents the model order mask. Both the cases demonstrate spatially similar patterns from the tFD and reference reconstructions. Figure 4 shows comparisons on the meningioma case. In comparison to the proposed approach, tFD approach under-estimated Ktrans and ve. The region of interest (ROI) histograms on tumor pixels reveal these differences between the two reconstructions. Figure 5 shows comparisons on the glioblastoma case. ve and vp maps are comparable between the two approaches. Ktrans from the proposed approach depict subtle noisy oscillations in the spatial maps, however the overall distribution in the ROI histogram is preserved.
Conclusion
We have successfully developed a nested DCE-MRI reconstruction framework that applies TK models as temporal constraints. This approach leverages the structured nature of temporal subspaces to characterize time intensity profiles from various TK models. In the small cohort of cases, TK mapping with the proposed approach was shown to be comparable or marginally better over an existing compressed sensing approach. Future studies involve leveraging additional constraints (eg. spatial constraints), investigation on a large cohort of clinical cases, and translation to prospective under-sampling studies.Acknowledgements
No acknowledgement found.References
1. Saranathan M, Rettmann DW, Hargreaves BA, Clarke SE, Vasanawala SS. DIfferential subsampling with cartesian ordering (DISCO): A high spatio-temporal resolution dixon imaging sequence for multiphasic contrast enhanced abdominal imaging. J. Magn. Reson. Imaging 2012;35:1484–1492. doi: 10.1002/jmri.23602.
2. Wieben O, Velikina J, Block WF, Perry J, Wu Y, Johnson KM, Korosec FK, Mistretta CA. Highly Constrained Back Projection ( HYPR ): Theory and Potential MRI Applications. Med. Phys. 2006;14:2006–2006.
3. Han S, Paulsen JL, Zhu G, Song Y, Chun S, Cho G, Ackerstaff E, Koutcher JA, Cho H. Temporal/spatial resolution improvement of in vivo DCE-MRI with compressed sensing-optimized FLASH. Magn. Reson. Imaging 2012;30:741–752. doi: 10.1016/j.mri.2012.02.001.
4. Lebel RM, Jones J, Ferre J-C, Law M, Nayak KS. Highly accelerated dynamic contrast enhanced imaging. Magn. Reson. Med. 2014;71:635–644. doi: 10.1002/mrm.24710.
5. Guo Y, Lebel RM, Zhu Y, Lingala SG, Shiroishi M, Law M, Nayak K. High-resolution whole-brain DCE-MRI using constrained reconstruction: Prospective clinical evaluation in brain tumor patients. Med. Phys. 2016;43:2013–2023.
6. SG Lingala, Y Guo, Y Zhu, N Nallapareddy, RM Lebel, M Law, KS Nayak. "Accelerated brain DCE-MRI using Contrast Agent Kinetic Models as Temporal Constraints." Proc. ISMRM 24th Scientific Sessions, Singapore, May 2016, p651.
7. SG Lingala, Y Guo, Y Zhu, S Barnes, RM Lebel, KS Nayak. "Accelerated DCE MRI Using Constrained Reconstruction Based On Pharmaco-kinetic Model Dictionaries." Proc. ISMRM 23rd Scientific Sessions, Toronto, June 2015, p196.
8. Y Guo, Y Zhu, SG Lingala, RM Lebel, KS Nayak. "Highly Accelerated Brain DCE MRI with Direct Estimation of Pharmacokinetic Parameter Maps." Proc. ISMRM 23rd Scientific Sessions, Toronto, June 2015, p573.
9. Aharon M, Elad M, Bruckstein A. k-SVD: An Algorithm for Designing Overcomplete Dictionaries for Sparse Representation. Signal Process. IEEE Trans. 2006;54:4311–4322.
10. Bagher-Ebadian H, Jain R, Nejad-Davarani SP, et al. Model selection for DCE-T1 studies in glioblastoma. Magn. Reson. Med. 2012;68:241–251. doi: 10.1002/mrm.23211.
11. Barnes SR, Ng TSC, Santa-Maria N, Montagne A, Zlokovic B V, Jacobs RE. ROCKETSHIP: a flexible and modular software tool for the planning, processing and analysis of dynamic MRI studies. BMC Med. Imaging [Internet] 2015;15:19. doi: 10.1186/s12880-015-0062-3.
12. Zhu Y, Guo Y, Lingala SG, Marc Lebel R, Law M, Nayak KS. GOCART: GOlden-angle CArtesian randomized time-resolved 3D MRI. Magn. Reson. Imaging 2015. doi: 10.1016/j.mri.2015.12.030.
Figures