1906
Robust reference-region DCE-MRI analysis with a vascular component and two-fit analysis1Medical Physics Unit, McGill University, Montreal, QC, Canada, 2Research Institute of the McGill University Health Centre, QC, Canada
Synopsis
The Extended Reference Region Model (ERRM) can quantify tumour perfusion without needing an arterial input function and includes a vascular term to account for the plasma volume. The addition of the vascular term also leads to larger variability in the estimated parameters. This study notes that one of the ERRM fitting parameters should be the same for all voxels. A two-fit approach is proposed that takes advantage of this constraint to reduce the number of fitting parameters from four to three. Evaluation in simulation and in-vivo found that the proposed two-fit approach resulted in a substantial decrease in variability for KTrans and kep estimates.
Purpose
Dynamic contrast enhanced (DCE) MRI is a tool to characterize the blood supply, or perfusion, in tumours via a tracer-kinetic model. Most DCE-MRI models require the time course of the tracer concentration in an arterial blood vessel, known as the arterial input function (AIF), but it is difficult to measure. An alternative approach is to use a reference region model (RRM) which uses the concentration in a healthy tissue as surrogate for the AIF (1). Conventional RRMs do not account for the blood plasma volume in the tissue of interest (TOI) (2) , which can be substantial in tumours, but an extended RRM (ERRM) has been proposed to account for this (3). The additional fitting parameters in the ERRM leads to larger variability in the ERRM's estimates.
In this study, a two-fit approach is proposed to reduce this variability, similar to the approach proposed for decreasing variability in conventional RRMs (4).
Theory
The ERRM (3) provides voxel-wise estimates for the relative transfer constant ($$$K^{Trans}/K^{Trans}_{RR}$$$), relative plasma volume ($$$v_p/K^{Trans}_{RR}$$$), and rate constants $$$k_{ep}$$$ & $$$k_{ep,RR}$$$.The parameters with subscript $$$RR$$$ describe the reference tissue, while the other parameters describe the voxel in the TOI. The number of fitting parameters can be reduced from four to three by noting that the $$$k_{ep,RR}$$$ parameter solely describes the reference tissue and should be the same for all fits on voxels in the TOI.
The proposed two-fit approach is named the Constrained Extended Reference Region Model (CERRM), and is as follows:
1. Fit all voxels in tissue of interest with the ERRM, with free parameters $$$K^{Trans}/K^{Trans}_{RR}$$$, $$$v_p/K^{Trans}_{RR}$$$, $$$k_{ep}$$$, and $$$k_{ep,RR}$$$
2. Calculate the interquartile mean of $$$k_{ep,RR}$$$ estimates from the ERRM
3. Refit all voxels with a reformulated version of the ERRM using the $$$k_{ep,RR}$$$ calculated in step 2 as a fixed parameter.
Methods
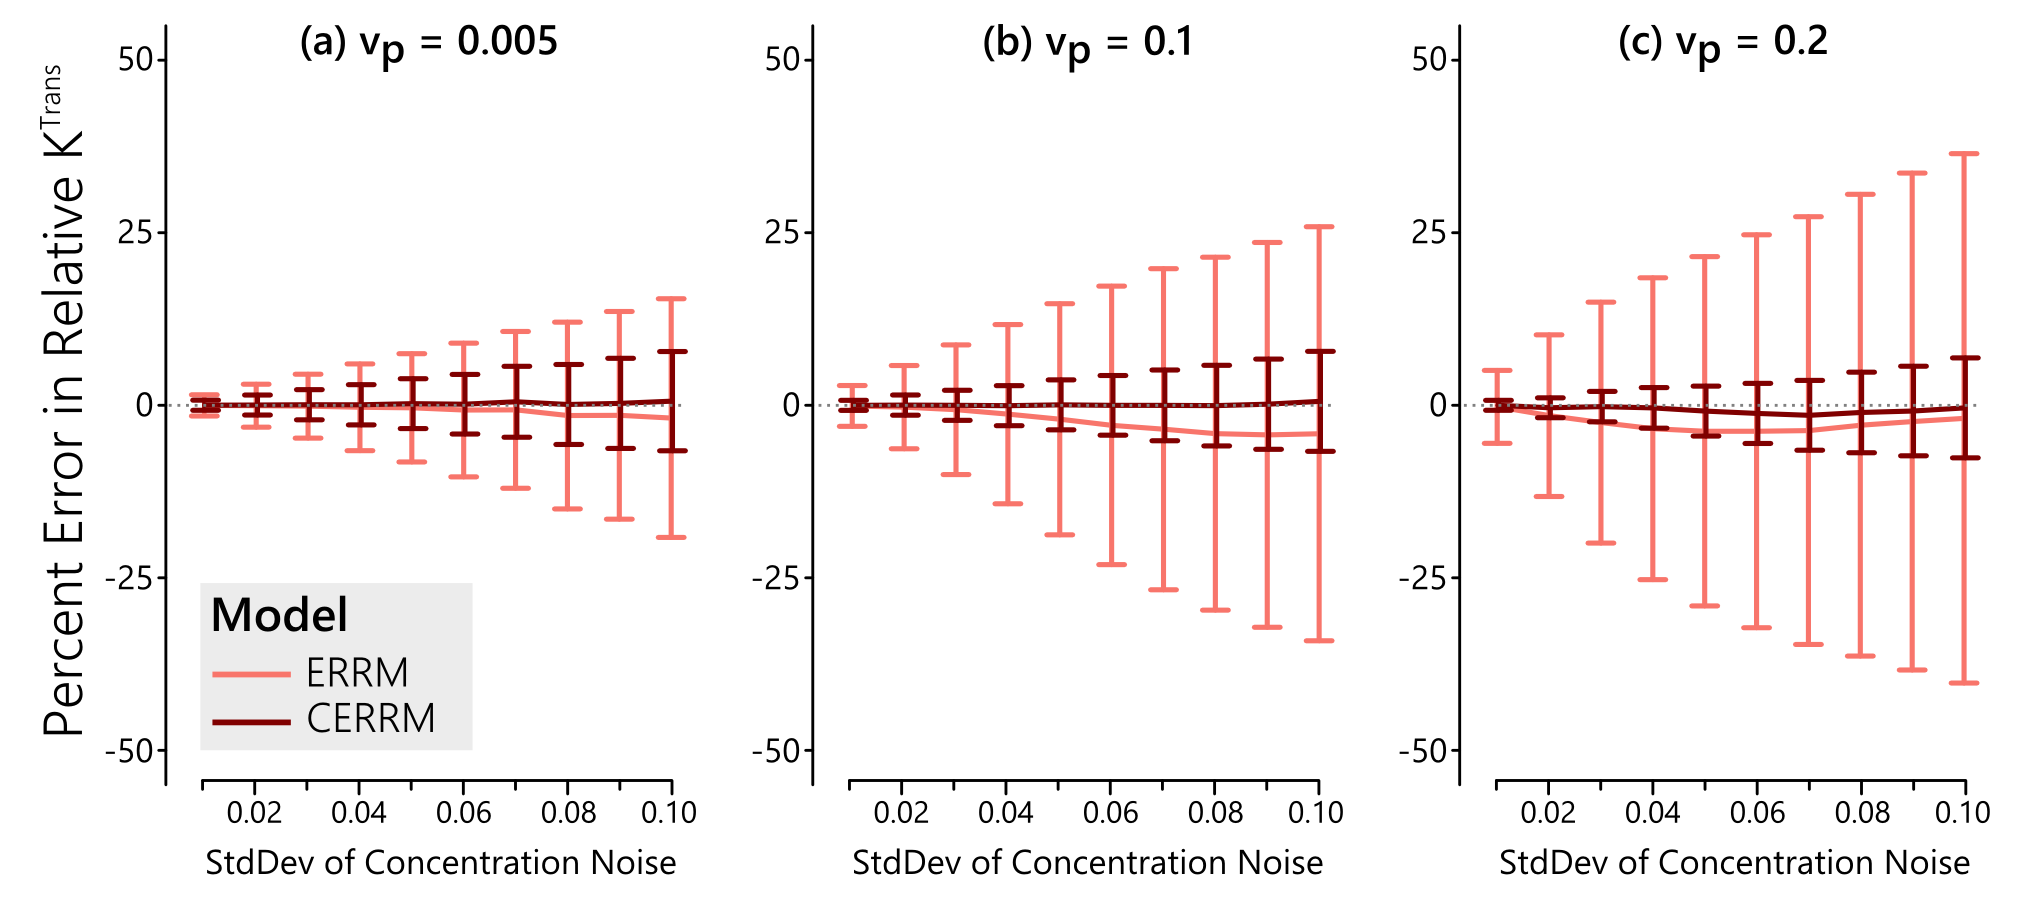
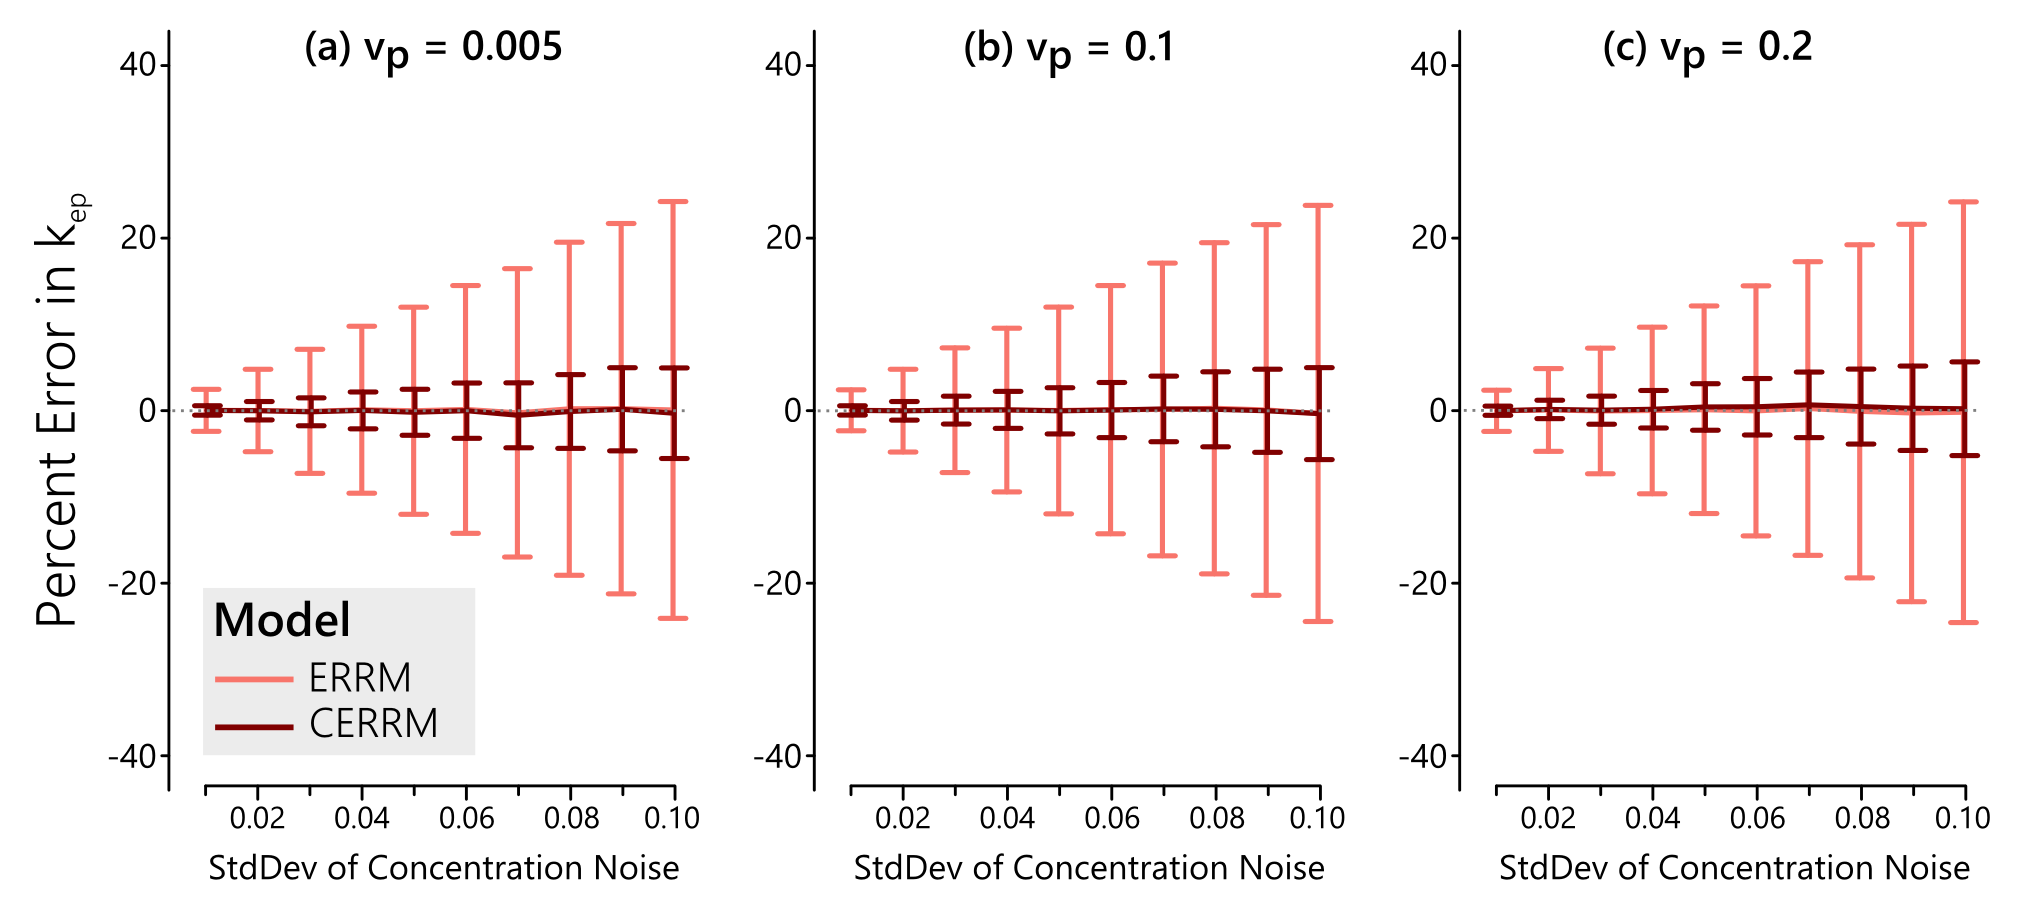
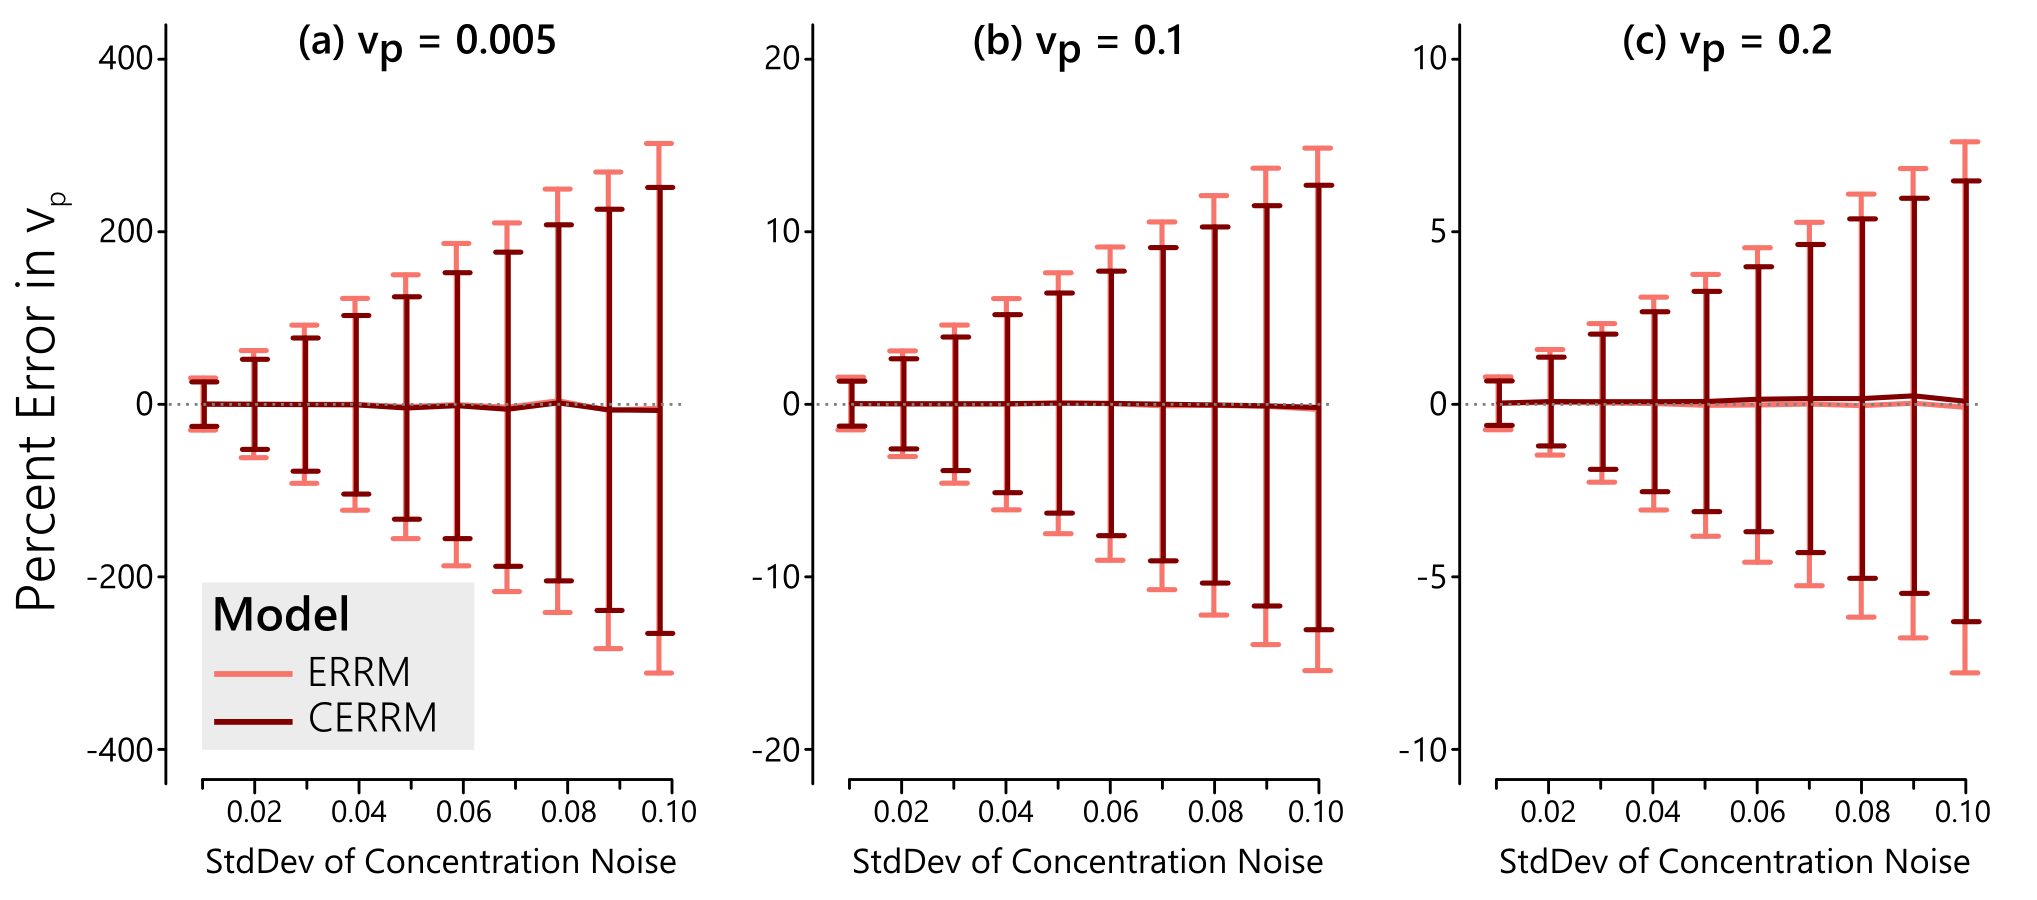
The performance of the CERRM was first evaluated in simulation. A literature-based AIF (5) was used with the Tofts model (6) to generate the reference region at 1 second temporal resolution with $$$K^{Trans}_{RR} = 0.1$$$ min$$$^{-1}$$$ and $$$k_{ep,RR} = 1.0$$$ min$$$^{-1}$$$. The same AIF was used with the Extended Tofts model to simulate the TOI with $$$K^{Trans} = 0.25$$$ min$$$^{-1}$$$ and $$$k_{ep} = 0.625$$$ min$$$^{-1}$$$ and three values of $$$v_{p} = [0.005, 0.10, 0.20]$$$. These parameters are representative of muscle (RR) and tumour (TOI), respectively (1). Gaussian noise was added to the tissue of interest with a standard deviation ranging from 0.01 to 0.10 mM in 10 steps. The ERRM and CERRM were both fit to the data.
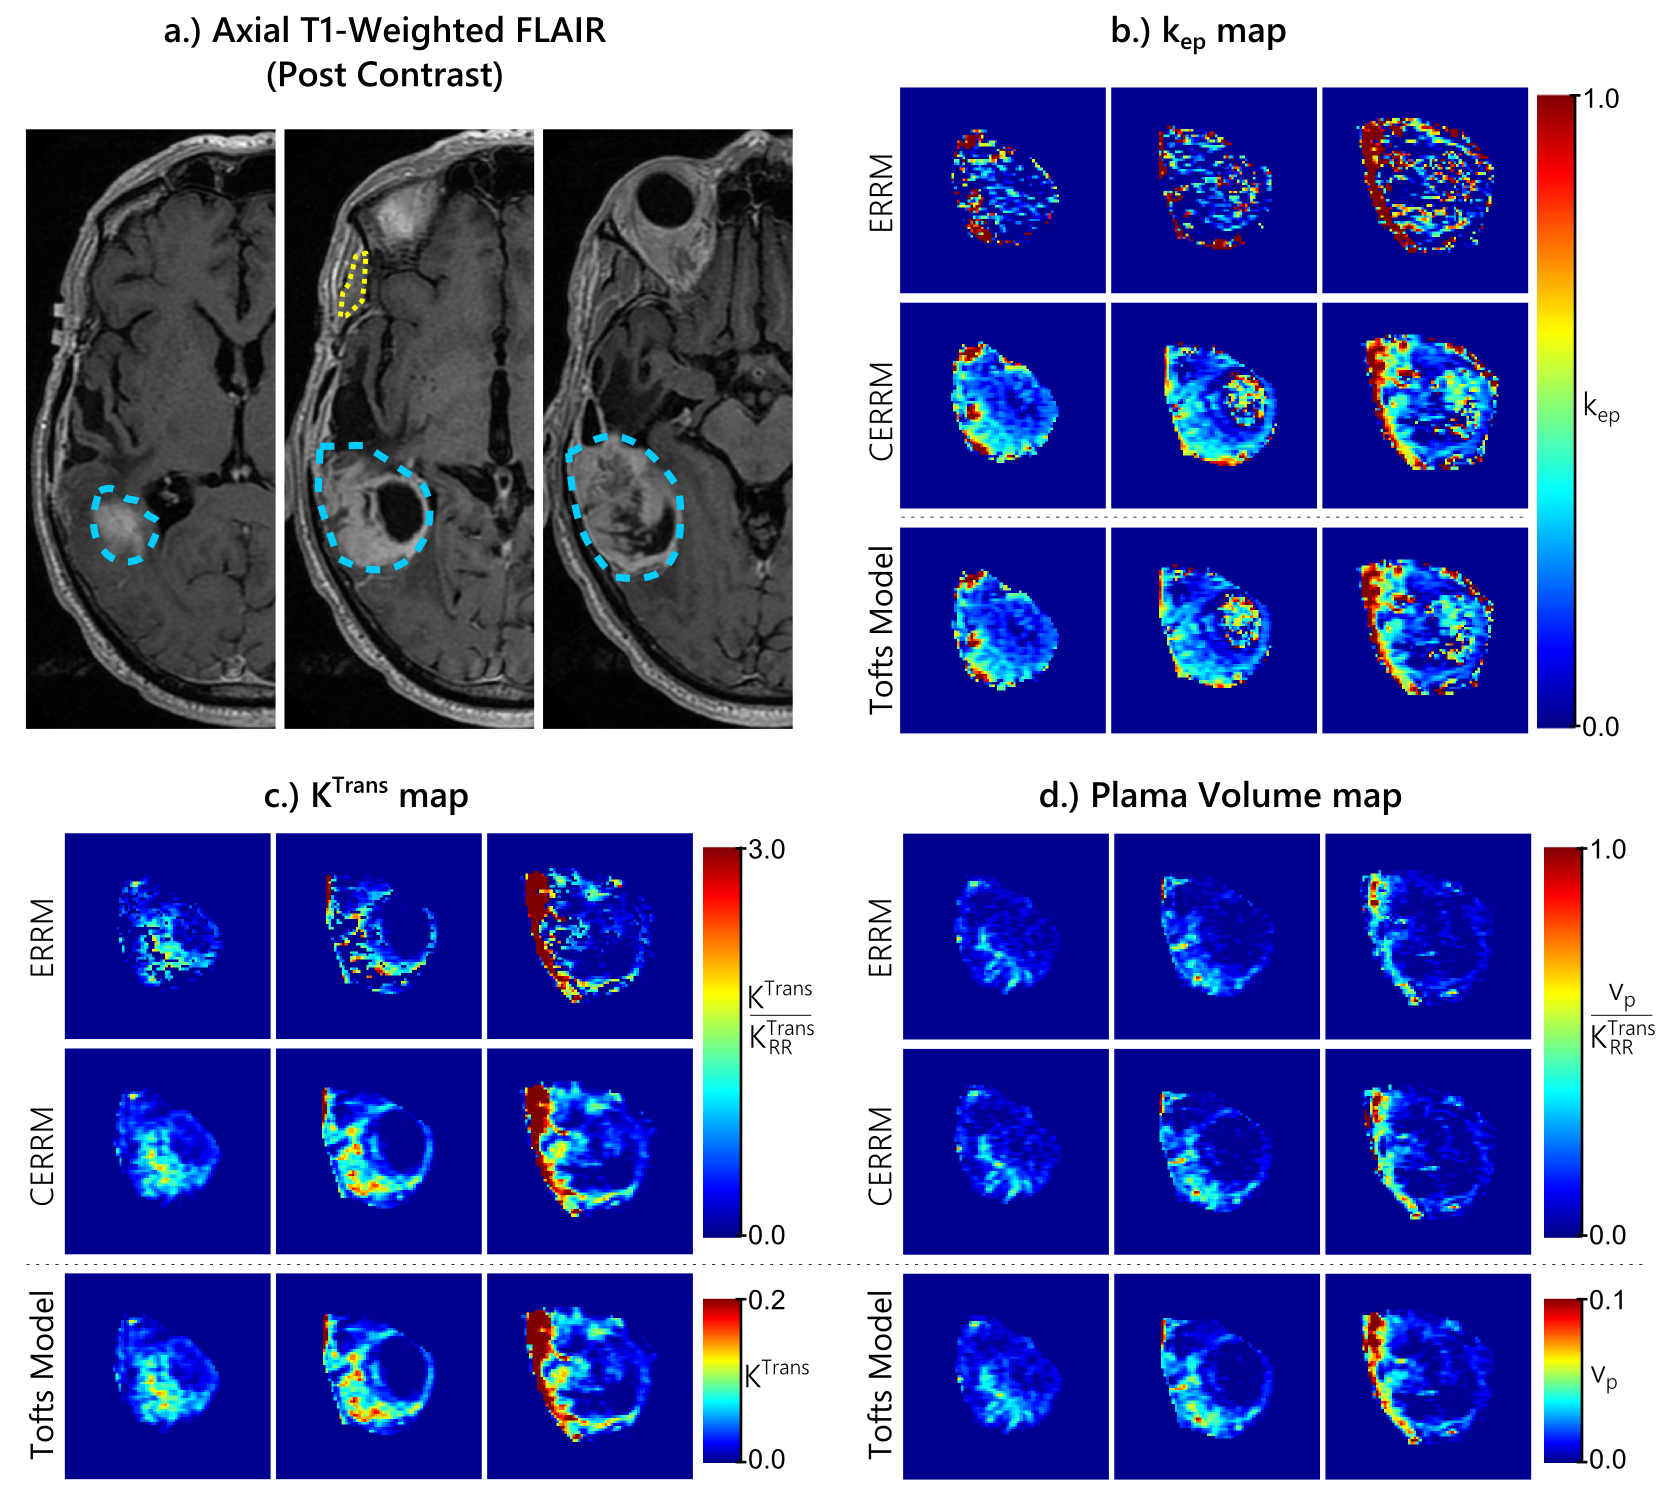
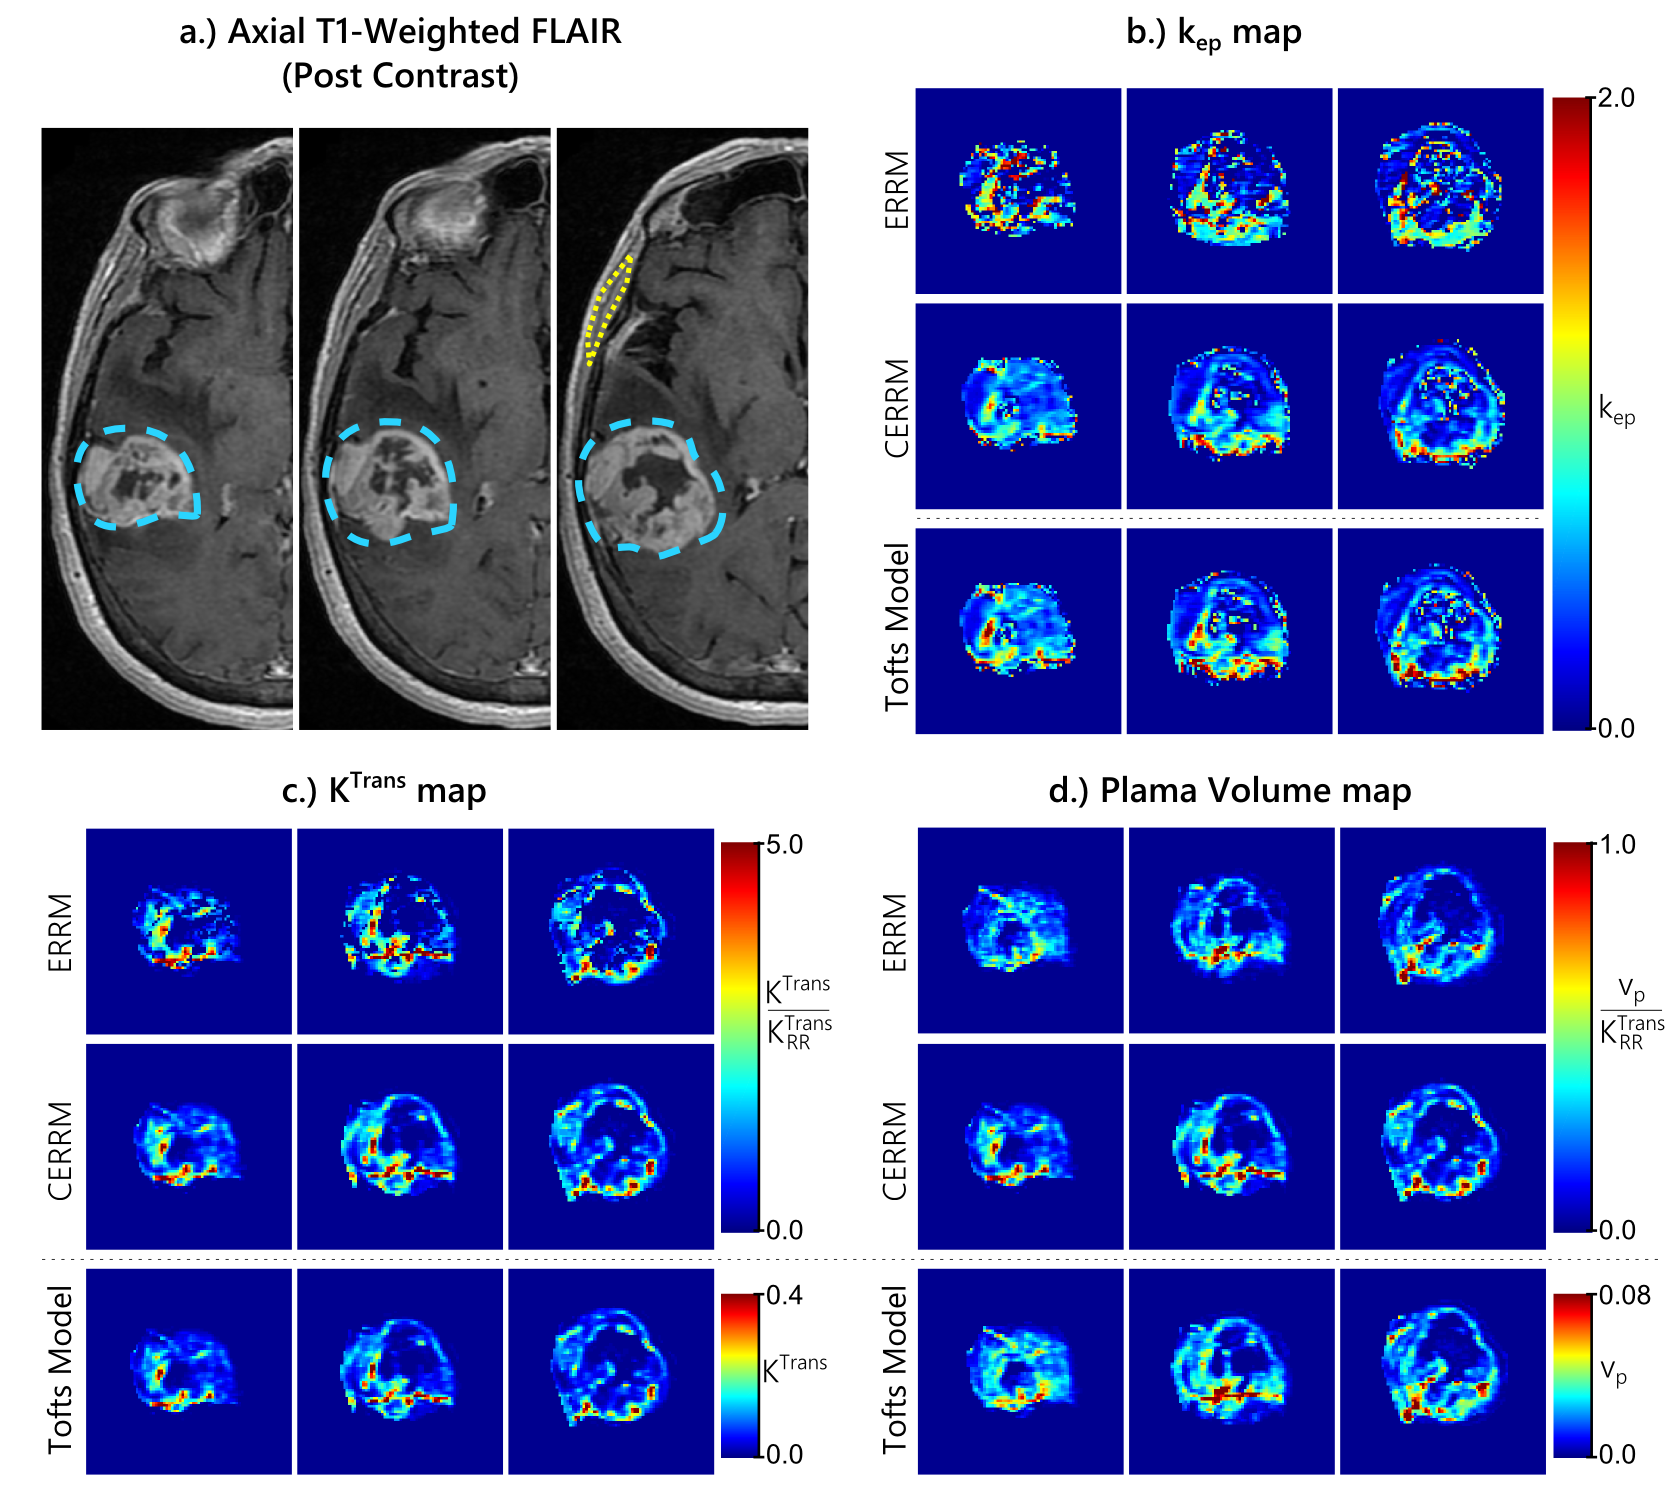
The in-vivo performance of the CERRM was evaluated on DCE-MRI data of two patients from The Cancer Genome Atlas Gliblastoma Multiforme (7) dataset downloaded from The Cancer Imaging Archive (8). The DCE-MRI data was acquired at 3T with a 3DSPGR sequence for a total duration of approximately 6 minutes at a temporal resolution of roughly 5 seconds. The temporalis muscle was used as a reference region with the ERRM and CERRM to fit each tumour voxel. The tumour and muscle regions were contoured using axial T1-weighted post-contrast FLAIR images. For comparison purposes, the Extended Tofts model was also fitted with an AIF approximated by the concentration in the superior sagittal sinus.
Results & Discussion
In simulations, the CERRM consistently improved precision, as seen in figures 1-3, while also having better accuracy at higher noise in some cases (Figure 1).The greatest improvement in precision was seen for $$$k_{ep}$$$ and for $$$K^{Trans}$$$ at higher values for $$$v_p$$$. The plasma volume estimates only saw a slight improvement in variability.
The results from both glioblastoma patients, shown in figures 4 & 5, were consistent with simulations. The CERRM improved the visual appearance of $$$k_{ep}$$$ and $$$K^{Trans}$$$ maps substantially, whereas there was no substantial change in the $$$v_p$$$ maps.
Conclusion
A modification to the Extended Reference Region Model (ERRM) was proposed - named the Constrained Extended Reference Region Model (CERRM) - to improve robustness. The CERRM had better accuracy and precision in simulation and produced smoother maps from in-vivo data that agreed more closely with the Extended Tofts Model. These findings indicate that the accuracy and precision of parameter estimates using reference region approach can be improved by using the two-fit approach of the CERRM.Acknowledgements
Funding for this work was provided by the RI-MUHC (Montreal General Hospital Foundation), NSERC CREATE MPRTN (Grant no. 432290), and McGill University Faculty of Medicine Fellowships.References
1. Yankeelov TE, Luci JJ, Lepage M, Li R, Debusk L, Lin PC, Price RR, Gore JC. Quantitative pharmacokinetic analysis of DCE-MRI data without an arterial input function: a reference region model. Magnetic resonance imaging 2005;23:519–29. doi: 10.1016/j.mri.2005.02.013.
2. Faranesh AZ, Yankeelov TE. Incorporating a vascular term into a reference region model for the analysis of DCE-MRI data: a simulation study. Physics in Medicine and Biology 2008;53:2617–31. doi: 10.1088/0031-9155/53/10/012.
3. Ahmed Z, Levesque IR. An Extended Linear Reference Region Model that accounts for plasma volume in Dynamic Contrast Enhanced MRI. In: Proc. intl. soc. mag. reson. med. 24:2771.; 2016.
4. Ahmed Z, Levesque IR. Increased robustness in reference region model analysis of DCE MRI using two-step constrained approaches. Magnetic Resonance in Medicine 2016; [In Early View] doi: 10.1002/mrm.26530.
5. Parker GJ, Roberts C, Macdonald A, Buonaccorsi G a, Cheung S, Buckley DL, Jackson A, Watson Y, Davies K, Jayson GC. Experimentally-derived functional form for a population-averaged high-temporal-resolution arterial input function for dynamic contrast-enhanced MRI. Magnetic Resonance in Medicine 2006;56:993–1000. doi: 10.1002/mrm.21066.
6. Tofts PS, Brix G, Buckley DL, et al. Estimating kinetic parameters from dynamic contrast-enhanced T1- weighted MRI of a diffusable tracer: Standardized quantities and symbols. Journal of magnetic resonance imaging 1999;10:223–232. doi: 10.1002/(SICI)1522-2586(199909)10:3<223::AID-JMRI2>3.0.CO;2-S.
7. Scarpace, L., Mikkelsen, T., Cha, soonmee, Rao, S., Tekchandani, S., Gutman, D., … Pierce, L. J. (2016). Radiology Data from The Cancer Genome Atlas Glioblastoma Multiforme [TCGA-GBM] collection. The Cancer Imaging Archive. http://doi.org/10.7937/K9/TCIA.2016.RNYFUYE9
8. Clark K, Vendt B, Smith K, Freymann J, Kirby J, Koppel P, Moore S, Phillips S, Maffitt D, Pringle M, Tarbox L, Prior F. The Cancer Imaging Archive (TCIA): Maintaining and Operating a Public Information Repository, Journal of Digital Imaging, Volume 26, Number 6, December, 2013, pp 1045-1057.
Figures