1905
Impact of Reference Time Curve Determination on the Correction of Contrast Agent Extravasation in Dynamic Susceptibility Contrast MRI1Department of Imaging Physics, The University of Texas M. D. Anderson Cancer Center, Houston, TX, United States, 2Department of Diagnostic Radiology, The University of Texas M. D. Anderson Cancer Center, Houston, TX, United States
Synopsis
This study investigated the influence of reference time curve determination on DSC leakage correction. Our findings suggested that the reference time curve obtained with inclusion of leaky tissue could lead a significantly different in K2, which supported that the probable error in lesion blood volume quantification with inaccurate automated segmentation process.
Purpose
The Weisskoff model has been widely applied in clinical use for correcting the contrast extravasation in dynamic susceptibility contrast (DSC) MRI. The correction was implemented with a model-based fitting process which requires a reference time curve ideally obtained from mask containing non-leaky tissues.1 In practice, various approaches have been used for the determining this mask. Moreover, commercial software capable of fully automated processing of the leakage-corrected DSC data often do not provide how the mask is determined. In principle, an automated segmentation process that includes the diseased tissues in the reference region could introduce an error in the leakage correction. Recent study had acknowledged this potential issue and acquired the reference region as whole brain with exclusion of leaky lesions and edemas.2 In this study, we investigated the impact of the determination of reference tissue on the DSC leakage correction.Methods
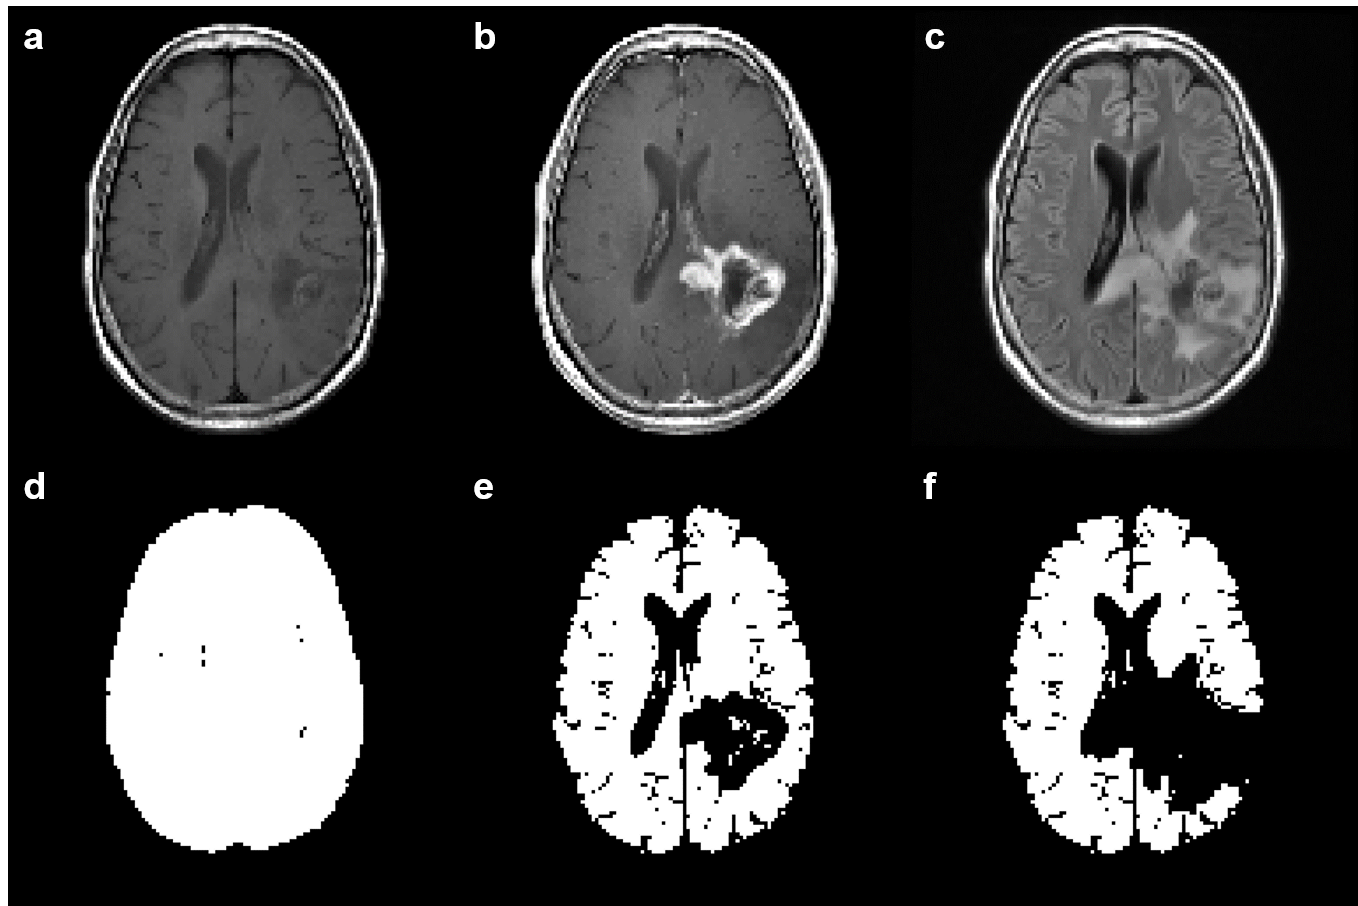
MR images for clinical evaluation of six patients with brain tumors were retrospectively analyzed. These images were acquired on 3T MRI scanners, including pre-contrast T1-weighted, T2-weighted fluid-attenuated inversion-recovery (FLAIR), single-shot gradient-echo echo-planar imaging DSC, and postcontrast T1-weighted images. Coregistration and segmentation of anatomical images were employed with SPM8 software (http://www.fil.ion.ucl.ac.uk/spm/). Regions of interest (ROIs) including enhancing lesion, FLAIR lesion, and contralateral white matter were manually drawn on the coregistered images. The necrosis and ventricles were excluded from the analysis. The Weisskoff model for leakage correction was implemented with an in-house Matlab code (https://www.mathworks.com/). The reference curve were acquired from a set of three masks: (1) whole brain (WB [Figure 1d]), (2) nonenhancing tissue (NT, [Figure 1e]), and (3) normal appearing tissue (NAT, [Figure 1f]). Cerebral blood volume was calculated from area under curve on both uncorrected and corrected datasets. The relative cerebral blood volume and the bypass product K2 were extracted from the enhancing lesion for comparison.Results
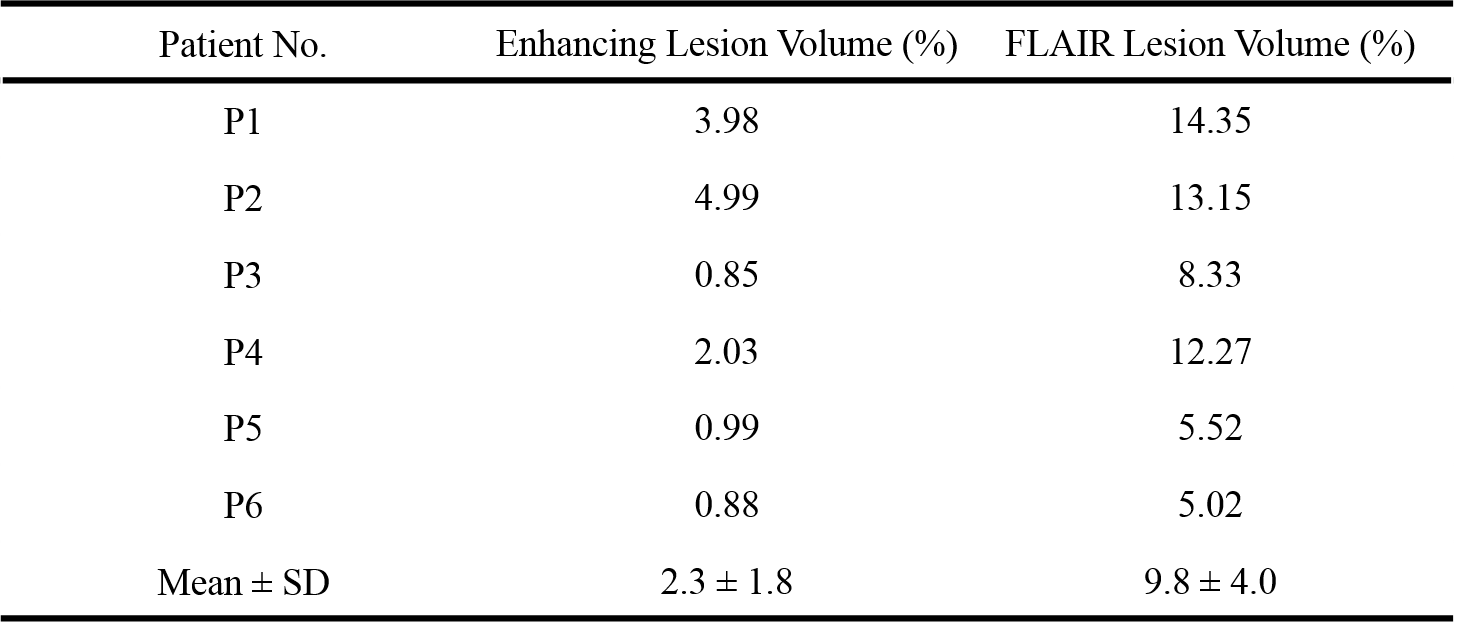
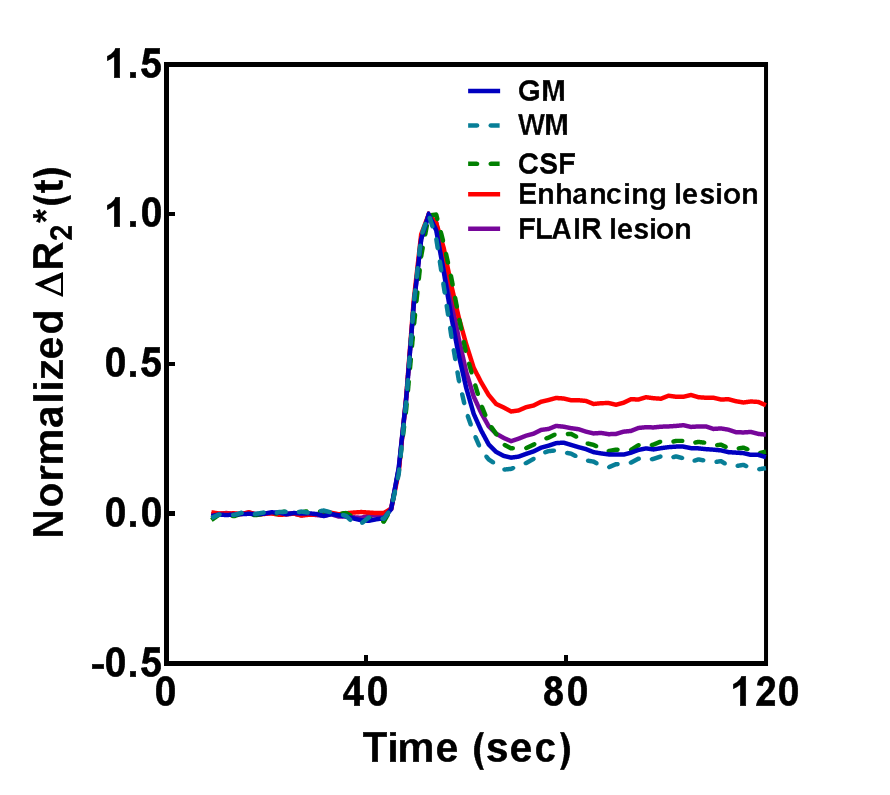
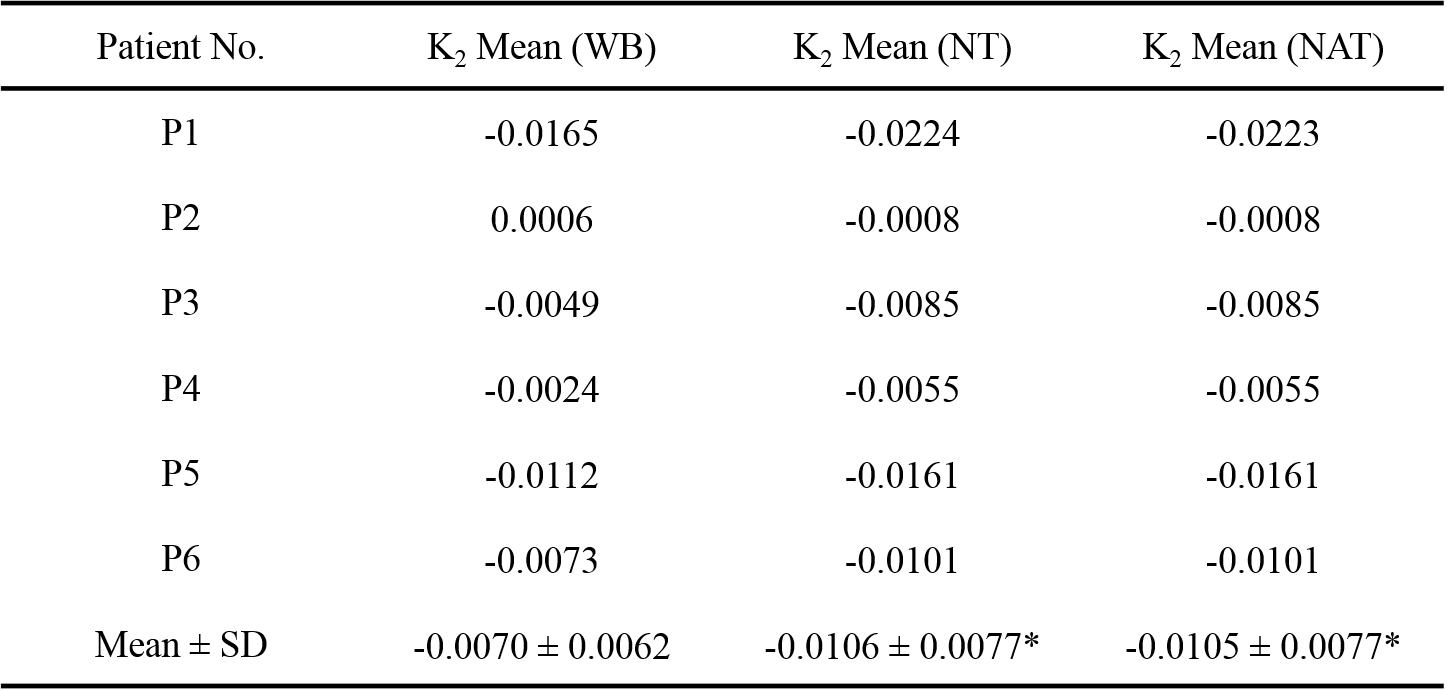
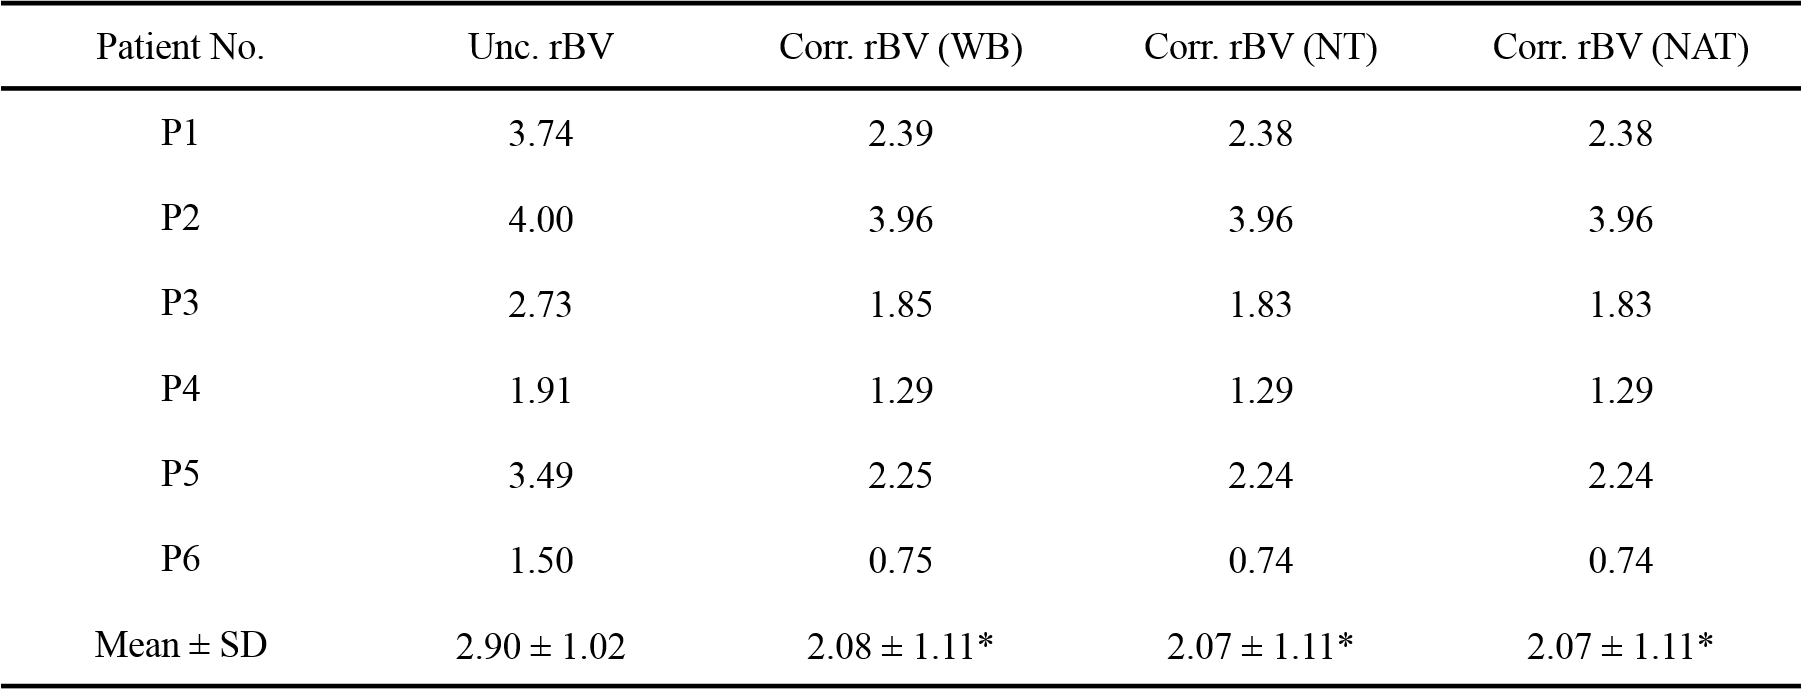
From the dataset of the six patients, the volume fraction to the whole intracranial volume was found to be with a mean of 2.3% on enhancing lesions and 9.8% on FLAIR lesions (Table 1). Figure 2 illustrates the normalized ΔR2* time curves obtained from a single subject. The noticeable deviations can be found at the tail of the time curves, which stated the distinct characteristics in the normal tissues and the diseased tissues. The K2 mean in the enhancing ROIs from the six patients were listed as Table 2. Comparing to the results from WB, the K2’s from both NT and NAT were found to be significantly lower (P < 0.05, Wilcoxon test). Moreover, the three sets of corrected rBV were reported to be significantly lower than the uncorrected rBV (P < 0.05, Wilcoxon test).Discussion and Conclusions
Our findings suggested that the reference time curve obtained with inclusion of leaky tissue would lead to a significantly difference in both K2 estimation, which raised the concern of the error in automated segmentation process. This study demonstrated the three common outcomes of the automated segmentation process, which WB stands for the intensity-based segmentation of raw data, NT can be seen as the non-leaky regions determined by the tail of DSC time curve, and NAT is implemented as the ideal segmentation. Theoretically, the inclusion of diseased tissues can introduce the uncertainty in leakage correction. However, since the error can both be contributed by the level of extravasation and the volume fraction of the leaky lesions, the influence was not prominent in the reported data.Acknowledgements
No acknowledgement found.References
1. Boxerman JL, Schmainda KM, Weisskoff RM. Relative cerebral blood volume maps corrected for contrast agent extravasation significantly correlate with glioma tumor grade, whereas uncorrected maps do not. AJNR Am J Neuroradiol 2006; 27(4):859-867.
2. Kluge A, Lukas M, Toth V, et al. Analysis of three leakage-correction methods for DSC-based measurement of relative cerebral blood volume with respect to heterogeneity in human gliomas. Magn Reson Imaging 2016;34(4):410-421.
Figures