1904
Dynamic Susceptibility Contrast MRI at 7T: Tail Scaling Analysis and Inferences About Field Strength Dependence1Department of Medical Radiation Physics, Lund University, Lund, Sweden, 2Department of Radiology (Adjunct), Johns Hopkins School of Medicine, Baltimore, MD, United States, 3Russell H. Morgan Department of Radiology and Radiological Sciences, Johns Hopkins University School of Medicine, Baltimore, MD, United States, 4F.M. Kirby Research Center for Functional Brain Imaging, Kennedy Krieger Institute, Baltimore, MD, United States, 5Department of Diagnostic Radiology, Lund University, Lund, Sweden
Synopsis
In this study, a dynamic susceptibility contrast MRI (DSC-MRI) protocol for cerebral perfusion imaging at 7T was designed. With reduced contrast agent dose, the obtained perfusion maps showed the same visual appearance as seen at lower field strengths. In addition, a correction method was applied to obtain quantitative estimates of CBF and CBV in order to assess whether previous predictions of a field-strength dependence of the in vivo transverse relaxivity, leading to overestimated perfusion estimates, were supported. We concluded that assumptions of a field-strength dependence were plausible, based on observations of further elevated CBF and CBV estimates at 7T.
Purpose
To obtain estimates of cerebral blood flow (CBF) using a dynamic susceptibility contrast (DSC) MRI protocol designed for 7T, and to assess whether the data support a field-strength dependence of transverse tissue relaxivity.
Introduction
DSC-MRI is used for estimation of brain perfusion parameters such as CBF and cerebral blood volume (CBV). When performing DSC-MRI at higher field strength, the problems of susceptibility and chemical shift artefacts, B1 inhomogeneity problems and higher specific absorption rate (SAR) are amplified. Introducing a paramagnetic contrast agent (CA), as in DSC-MRI, will further enhance the problem with susceptibility artefacts. The protocol has to be designed to minimize these difficulties. Furthermore, it has been predicted that an increase in B0 will lead to increased T2* relaxivity in tissue as well as a larger difference in ΔR2*-versus-concentration relationships between tissue and large vessels (1). If a conventional DSC-MRI quantification approach is used, these characteristics would manifest themselves as higher DSC-MRI CBF estimates at higher B0, and an additional aim of this study was thus to assess the field-strength dependence of CBF by applying tail scaling to data from healthy volunteers and comparing the estimates to corresponding literature values obtained at a 1.5T and 3T (2,3).
Methods
Seven healthy volunteers (age 24-50 years, 4 males) were examined using a 7T actively shielded MRI scanner (Philips Achieva). The project was approved by the Regional Ethical Review Board, and written informed consent was obtained from each volunteer.
A reduced dose of CA (i.e., 0.05 mmol/kg b.w.) was administered at 5 ml/s, and the DSC-MRI experiment was performed using single-shot gradient-echo EPI with in-plane spatial resolution 2x2 mm2, slice thickness 3 mm, 14-21 slices, flip angle 70 degrees, TR 1500 ms, TE 30 ms, SENSE acceleration factor 2.0 and 120 dynamics. A 20 ml saline flush was injected at a rate of 5 ml/s after the CA administration.
Tissue and arterial CA concentrations C were calculated as C(t) = -k ∙ (1/TE) ∙ ln[S(t)/S0], where S(t) is the signal at time t, S0 is the baseline signal and k is a constant reflecting the transverse relaxivity. In this approach, tissue and blood were presumed to show equal relaxivities, so k was set to 1. CBF maps without any arterial concentration correction were calculated using Zierler’s area-to-height relationship and the central volume principle (4,5). A global arterial input function (AIF) was obtained as the mean value of concentration time curves from 3-7 voxels in middle cerebral artery branches in the Sylvian fissure region.
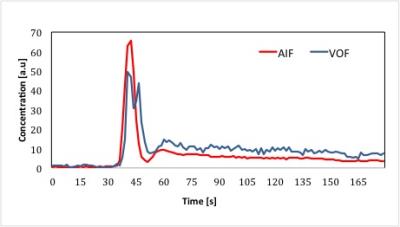
A venous output function (VOF) was obtained as the mean value of concentration time curves from approximately 3 voxels (from 2-3 different slices) in the sagittal sinus. If geometric distortions and/or signal saturation were observed in the first-passage bolus peak, this was interpreted as signs of a high fraction of vascular signal. It was thus regarded to be preferable to use VOFs with distorted first-passage shape for AIF calibration, because such voxels were likely to show less partial volume effects than undistorted concentration time curves.
Subject-specific correction factors (CF) using the tail-scaling approach were obtained by calculating the mean concentration level of data points registered at the steady-state phase of the AIF and dividing it by the mean concentration level of the data points registered at the steady-state phase of the VOF (40 time points in each). The CF factors were thereafter applied to thalamus grey matter (GM) regions of interest in the CBF and CBV maps.
Results
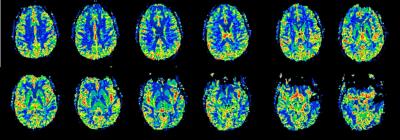
We obtained a GM CBF estimate of 116±20 ml/min/100g and a CBV estimate of 12.7±2.8 ml/100g. Figure 1 shows representative CBF maps from one volunteer, with similar visual appearance as DSC-MRI images normally obtained at lower field strengths. Note that no obvious distortions are seen in the images, in spite of being acquired at 7T. Figure 2 shows an example of AIF and VOF concentration time curves in one subject.
Discussion
Previously, Knutsson et al. obtained a tail-scaling-based GM CBF estimate of 80 ml/min/100g at 3T (3), a value that was elevated compared with the estimate of 58 ml/min/100g (in patients) reported in the original tail-scaling study at 1.5T by Bjørnerud et al. (2). Hence, a field-strength dependence of CBF estimates obtained by DSC-MRI, related to a field-strength dependence of transverse relaxivity, is indeed plausible. As expected, CBV estimates were also correspondingly overestimated in this study. A drawback of this quantification approach is that steady-state pixel-shift artefacts are also more pronounced in the 7T data, making it more difficult for the user to find suitable VOFs.
Acknowledgements
This project was supported by NIH/NIBIB EB015909, Swedish Research Council grants no. 2010-5928, 2011-2971, 2015-04170 and the Swedish Cancer Society 2015/251, 2015/567.References
1. Kjølby BF et al. Magn Reson Med 2006;56:187–197.
2. Bjørnerud A, Emblem KE. J Cereb Blood Flow Metab 2010;30:1066–1078.
3. Knutsson L et al. J Magn Reson Imaging 2015 Apr;41(4):903-938.
4. Zierler KL. Circ Res 1965;16:309–321.
5. Meier P, Zierler KL. J Appl Physiol 1954;6:731–744.
Figures

