1903
Improved Arterial Input Function Measurements Using Phase-versus-Time and Modified Look-Locker Inversion Recovery: Phantom Validation Study1Carleton University, Ottawa, ON, Canada, 2Medical Imaging, The Ottawa Hospital, 3The Ottawa Hospital Research Institute, 4Radiology, The University of Ottawa, 5Division of Nuclear Medicine, The Ottawa Hospital, 6Siemens Healthcare, Erlangen, Germany, 7Cardiac PET Centre, University of Ottawa Heart Institute, 8Radiology, The Ottawa Hospital
Synopsis
Dynamic contrast-enhanced (DCE)-MRI is used to quantify organ perfusion abnormalities in many diseases, but is prone to errors. This study investigated the accuracy of a new method for measuring the arterial input function (AIF) in a flowing-water phantom using phase-versus-time measurements with pre- and post-DCE Modified Look-Locker Inversion Recovery (MOLLI) T1 measurements (Phase+MOLLI). The Phase+MOLLI technique provides an important improvement over previous methods since it avoids signal saturation and gives correct [Gd] values for the washout of the AIF. The Phase+MOLLI method was validated to be accurate, reproducible, and flow-insensitive so that it may be used for clinical DCE-MRI.
Purpose
Dynamic contrast-enhanced (DCE)-MRI is used to quantify organ perfusion abnormalities in many diseases1. The purpose of this study was to investigate the accuracy of a new method for measuring the arterial input function (AIF) in DCE-MRI. This method combines phase-versus-time measurements with pre- and post-DCE Modified Look-Locker Inversion Recovery (MOLLI)2 T1 measurements. This method, denoted “Phase+MOLLI”, was compared to an older method which uses only phase measurements (“Phase-only”)3-4.Methods
Two MOLLI prototype acquisitions were used for T1 measurements: “MOLLI-Blood” – optimized for higher gadolinium concentrations ([Gd]) found in blood (>0.5 mM) with inversion point-spacing of 175ms; “MOLLI-Brain” – optimized for lower [Gd] found in tissue, with inversion point-spacing of 750ms. [Gd] was quantified using a calibration curve for the combination of these two methods (“MOLLI-Combination”) into a single fit, where MOLLI-Brain was used to measure low [Gd] and MOLLI-Blood was used for higher [Gd] measurements. Seven DCE-MRI experiments were performed on a thin-tubing aqueous multimodality DCE perfusion flow phantom (Shelley Medical) in a 3T MRI system (Magnetom Trio; Siemens) with 32 channel head coil and clinical DCE-MRI protocol (FLASH: TR=6.5ms, TE1/TE2=1.65/3.85, flip angle=30º). The input flow rate was set to 200 mL/min to mimic blood flow in the human brain. A small amount of Gd (Gadovist® 1.0, Bayer) was added to water initially so the baseline T1 was similar to blood. MOLLI T1 measurements were performed before and after DCE acquisition. The AIF was measured by the 1) “Phase-only” method: change in phase as a function of time was used to compute the AIF3-4; and 2) “Phase+MOLLI” method: [Gd] during the post-injection steady-state washout (AIFw) was calculated from MOLLI T1 values and known T1 relaxivity. This value of AIFw was used to translate the Phase-only AIF in the vertical (concentration) direction until the washout part of the curve equalled AIFw, and setting the baseline to zero. A “gold-standard” AIFw was also obtained by sampling liquid from the phantom pre- and post-DCE, and measuring T1 with inversion recovery (EPI-IR). MOLLI was also performed on this sample. A paired t-test was conducted to compare AIFw values from the Phase-only and Phase+MOLLI methods. The correlation between the [Gd] values from MOLLI and EPI-IR was also determined. To investigate flow effects, the DCE phantom flow was stopped and MOLLI was performed; [Gd] from these two flow states were compared.Results
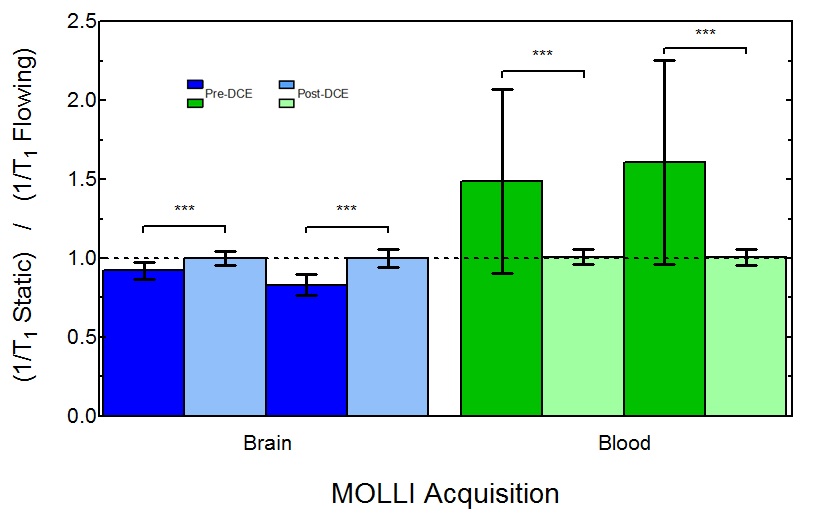
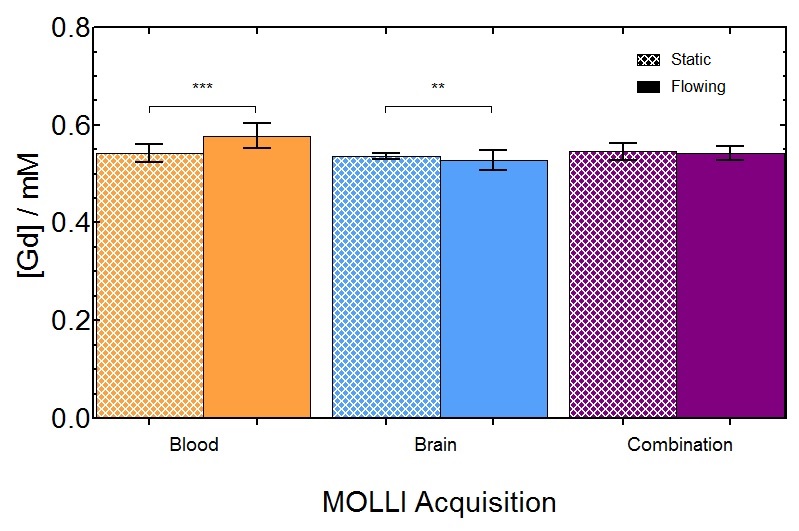
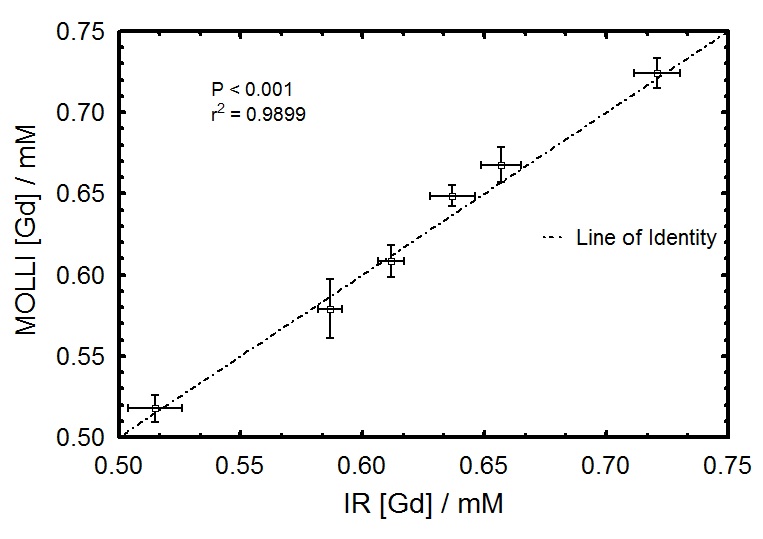
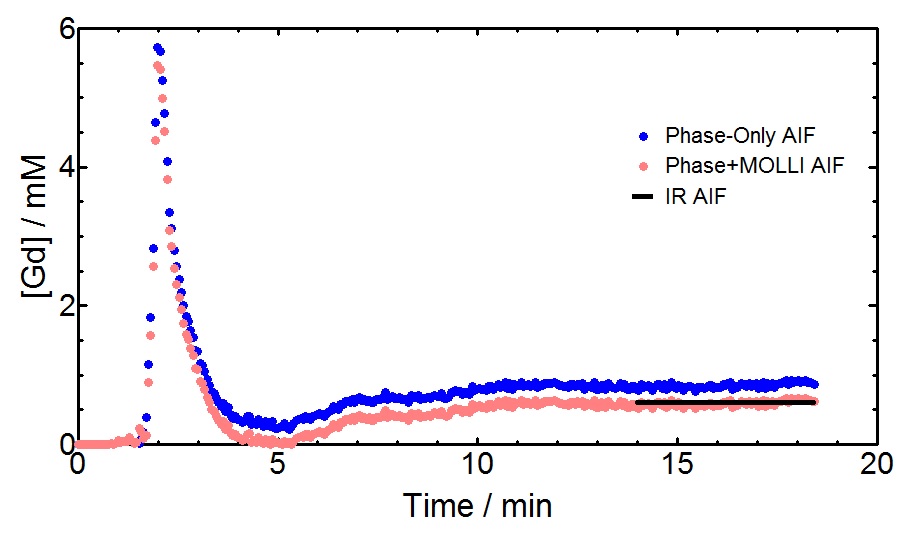
To determine if MOLLI was sensitive to flow for different [Gd] values, 1/T1 was computed in both static and flowing water. Fig. 1 shows significant differences (all P<0.001) were observed before and after DCE for both MOLLI-Brain and MOLLI-Blood. To minimize flow effects in DCE acquisitions, MOLLI-Combination was used as it's the least sensitive to flow. Fig. 2 shows these effects on [Gd] from MOLLI-Blood (P<0.0001), MOLLI-Brain (P=0.007), and MOLLI-Combination (P=0.42) in flowing and static water. To verify MOLLI-Combination was accurate in determining [Gd], it was compared with gold-standard EPI-IR where good correlation was observed (P<0.0001, r2=0.9899) (Fig. 3). In the DCE acquisition, a significant difference was observed between [Gd] from the Phase-only and Phase+MOLLI methods (P=0.024) while no difference was observed between MOLLI and EPI-IR AIFw values (P=0.096). AIF values computed with the two methods are shown in Fig. 4, overlaid with the gold-standard EPI-IR results.Discussion
Despite widespread clinical application of DCE-MRI, it suffers from a lack of standardization and accuracy, especially with respect to the AIF4. It is not possible to accurately measure high, rapidly changing [Gd] in the AIF from T1 measurements alone as MR signal saturates at these concentrations. The use of phase information is more desirable where no such saturation occurs4. In the steady-state washout of the phase-derived AIF, inaccuracies may occur due to inadequate phase accrual, flip angle error, partial-volume effects, and high temporal resolution requirement4,5. The Phase+MOLLI method presented is accurate and fast for computing the entire AIF for DCE-MRI (Fig. 4). MOLLI T1 measurements used to measure AIFw were validated in static phantoms with gold-standard T1 measurements (EPI-IR) (Fig. 3). Flow was found to have a significant effect on MOLLI 1/T1 values between pre- and post-DCE (Fig. 1). [Gd] accuracy from MOLLI can be improved by using a calibration curve generated from a combination of MOLLI-Brain and MOLLI-Blood measurement parameters by using flow-insensitive MOLLI-Combination (Fig. 2).Conclusion
There is currently no gold-standard for determining the AIF in DCE-MRI. The Phase+MOLLI technique provides an important improvement over previous methods since it avoids signal saturation and gives correct [Gd] values for the washout of the AIF. The Phase+MOLLI method provides an accurate, reproducible, and flow-insensitive AIF for clinical DCE-MRI.Acknowledgements
The authors would like to thank the Ontario Research Fund and GE Healthcare who provided funding for the phantom used in our experiments.References
1. A.R. Padhani and J.E. Husband. “Dynamic Contrast-enhanced MRI Studies in Oncology with and Emphasis on Quantification, Validation and Human Studies.” Clin Radiol. 56(8), 607-620 (2001).
2. D.R. Messroghli, et al. “Modified Look-Locker Inversion Recovery (MOLLI) for High-Resolution T1 Mapping of the Heart.” Magn Reson Med. 52(1), 141-146 (2004).
3. C. Foottit, et al. “Determination of the Venous Output Function from MR Signal Phase: Feasibility for Quantitative DCE-MRI in Human Brain.” Magn Reson Med. 63(3), 772-781 (2010).
4. G.O. Cron, et al. “A comparison of T2*-weighted magnitude and Phase Imaging for Measuring the Arterial Input Function in the Rat Aorta Following Intravenous Injection of Gadolinium Contrast Agent.” Magn Reson Imaging. 23(5), 619-627 (2005).
5. G.J.M. Parker, et al. “Experimentally-derived functional form for a population-averaged high-temporal-resolution arterial input function for dynamic contrast-enhanced MRI.” Magn Reson Med. 56(5), 993-1000 (2006).
Figures