1902
Correction of R2* Effects in Arterial Input Function of Fast Dynamic Contrast-Enhanced MRI for Accurate Cerebral Blood Flow Measurement1Département de médecine nucléaire et radiobiologie, Centre d'imagerie moléculaire de Sherbrooke, Sherbrooke, QC, Canada, 2MR Clinical Science, Philips Healthcare Canada, Markham, ON, Canada
Synopsis
Signal loss resulting from $$$R_2^*$$$ effects is usually neglected in fast dynamic contrast-enhanced perfusion imaging. A new flow-compensated 3D RF-spoiled dual gradient echo sequence was designed to quantify the $$$R_2^*$$$ variation during a bolus injection of contrast agent and its effect on cerebral blood flow measurement. Moderate $$$R_2^*$$$ effects are found to be amplified by the non-linear relationship between signal ratio and concentration. This is shown to lead to substantial changes in peak arterial input function and measured cerebral blood flow.
Purpose
Fast dynamic contrast-enhanced (DCE) MRI sequences can simultaneously quantify perfusion (cerebral blood flow (CBF) and volume (CBV)) and permeability (Ktrans)1–3. These sequences rely on $$$T_1$$$ signal enhancement caused by a bolus of contrast agent (CA). Concurrent CA induced $$$T_2^*$$$ signal decrease is assumed to be insignificant for a short echo time (TE=1-2ms) and a half-dose injection. We challenge this widely spread assumption based on a previous report where a $$$R_2^*$$$ induced reduction of peak arterial input function (AIF) of 22% was measured with short echo times and the injection of a full dose of CA4. This study aims to quantify and correct this $$$R_2^*$$$ effect in typical half-dose conditions for fast DCE perfusion.Methods
Acquisition: Imaging was performed on an Ingenia 3.0T with a 32-channel head receiver coil (Philips Healthcare, Best, Netherlands). A flow-compensated 3D RF-spoiled dual gradient echo sequence was designed for fast DCE ($$$TE_1$$$/$$$TE_2$$$/$$$TR$$$=3.0/7.5/9.6 ms; flip angle ($$$\alpha$$$)=20°; BW=482 Hz; FOV=240x160x90 mm³; spatial resolution=1.7x1.7x3.0 mm³; SENSE factors=2.3x2.0; time resolution=6.0 s). Echo times were limited by the gradient waveforms that remove tissue and flow signal displacement between echoes, achieving first-moment flow compensation in all encoding directions for both echoes5,6. CENTRA keyhole imaging acquired the first 50 seconds of bolus passage with a time resolution of 1.5 s (keyhole percentage=45% and compression ratio=90%) with the last frame serving as a reference. A half dose (0.05 mmol/kg) of gadobutrol (604 mg/mL; 1.0 mmol/mL) (Gadovist®, Bayer HealthCare Pharmaceuticals, Toronto, Ontario, Canada) was injected intravenously with an automatic CA injector (Spectris Solaris EP, Medrad, Pittsburgh, PA, USA). A variable flip angle7 sequence and a dual TR actual flip angle imaging8 sequence were acquired to compute initial maps ($$$T_{10}$$$) with correction for B1+ field variations.
Cohort: The study was approved by the institutional committee for medical research ethics. Three young and healthy subjects (A. 34y-M; B. 25y-F; C. 29y-F) participated in this study following informed consent.
Processing: Data analysis was performed with Matlab R2016a (The MathWorks, Natick, MA) and image registration was performed with Statistical Parametric Mapping (SPM12). Temporal variations of transverse relaxation rates were computed using the ratio of the first echo signal ($$$S_1(t)$$$) over the second echo signal ($$$S_2(t)$$$):
$$\Delta{R_2^*(t)}=\frac{1}{TE_2-TE_1}\ln{\left[\frac{S_1(t)S_2(t_0)}{S_2(t)S_1(t_0)}\right]}$$
where $$$S_{1,2}(t_0)$$$ are the mean pre-injection signals of the first and second echoes. The "zero echo time" signal ratio corrected for $$$\Delta{R_2^*}$$$ effects was extracted using $$$S_c(t)/S_c(t_0)=\exp{\left(TE_1\Delta{R_2^*(t)}\right)}\cdot{S_1(t)/S_1(t_0)}$$$. A signal ratio at TE=1.25 ms (typical for fast DCE sequences) was calculated for comparison with literature values. Longitudinal relaxation rates were computed from the steady-state signal equation for RF-spoiled gradient echo9:
$$\Delta{R_1(t)}=\frac{1}{TR}\ln{\left[\frac{f_{10}-\cos\alpha\times S(t)/S(t_0)}{f_{10}-S(t)/S(t_0)}\right]}-\frac{1}{T_{10}}$$
with $$$f_{10}=\left[1-\cos\alpha\times\exp(-TR/T_{10})\right]/\left[1-\exp(-TR/T_{10})\right]$$$. Dynamic concentration maps were computed for "zero echo time" corrected data, TE=1.25 ms and TE=3.0 ms from $$$\Delta{R_1(t)}$$$ using a linear CA relaxivity of $$$r_1=4.5\,(\mathrm{s\cdot{min}})^{-1}$$$. The blood concentration calculations assumed a hematocrit ratio of 0.45 in arteries and 0.25 in tissue capillaries. The AIF was measured in a region of interest (ROI) located on four voxels on the left and right middle cerebral arteries (MCA) M1 segment presenting the maximum area under the signal enhancement curves of the first echo. Perfusion (CBF) was modeled by solving the basic tracer kinetic equation with deconvolution using Tikhonov’s regularisation and cubic B-spline constraint on the tissue impulse response function (IRF)2.
Results
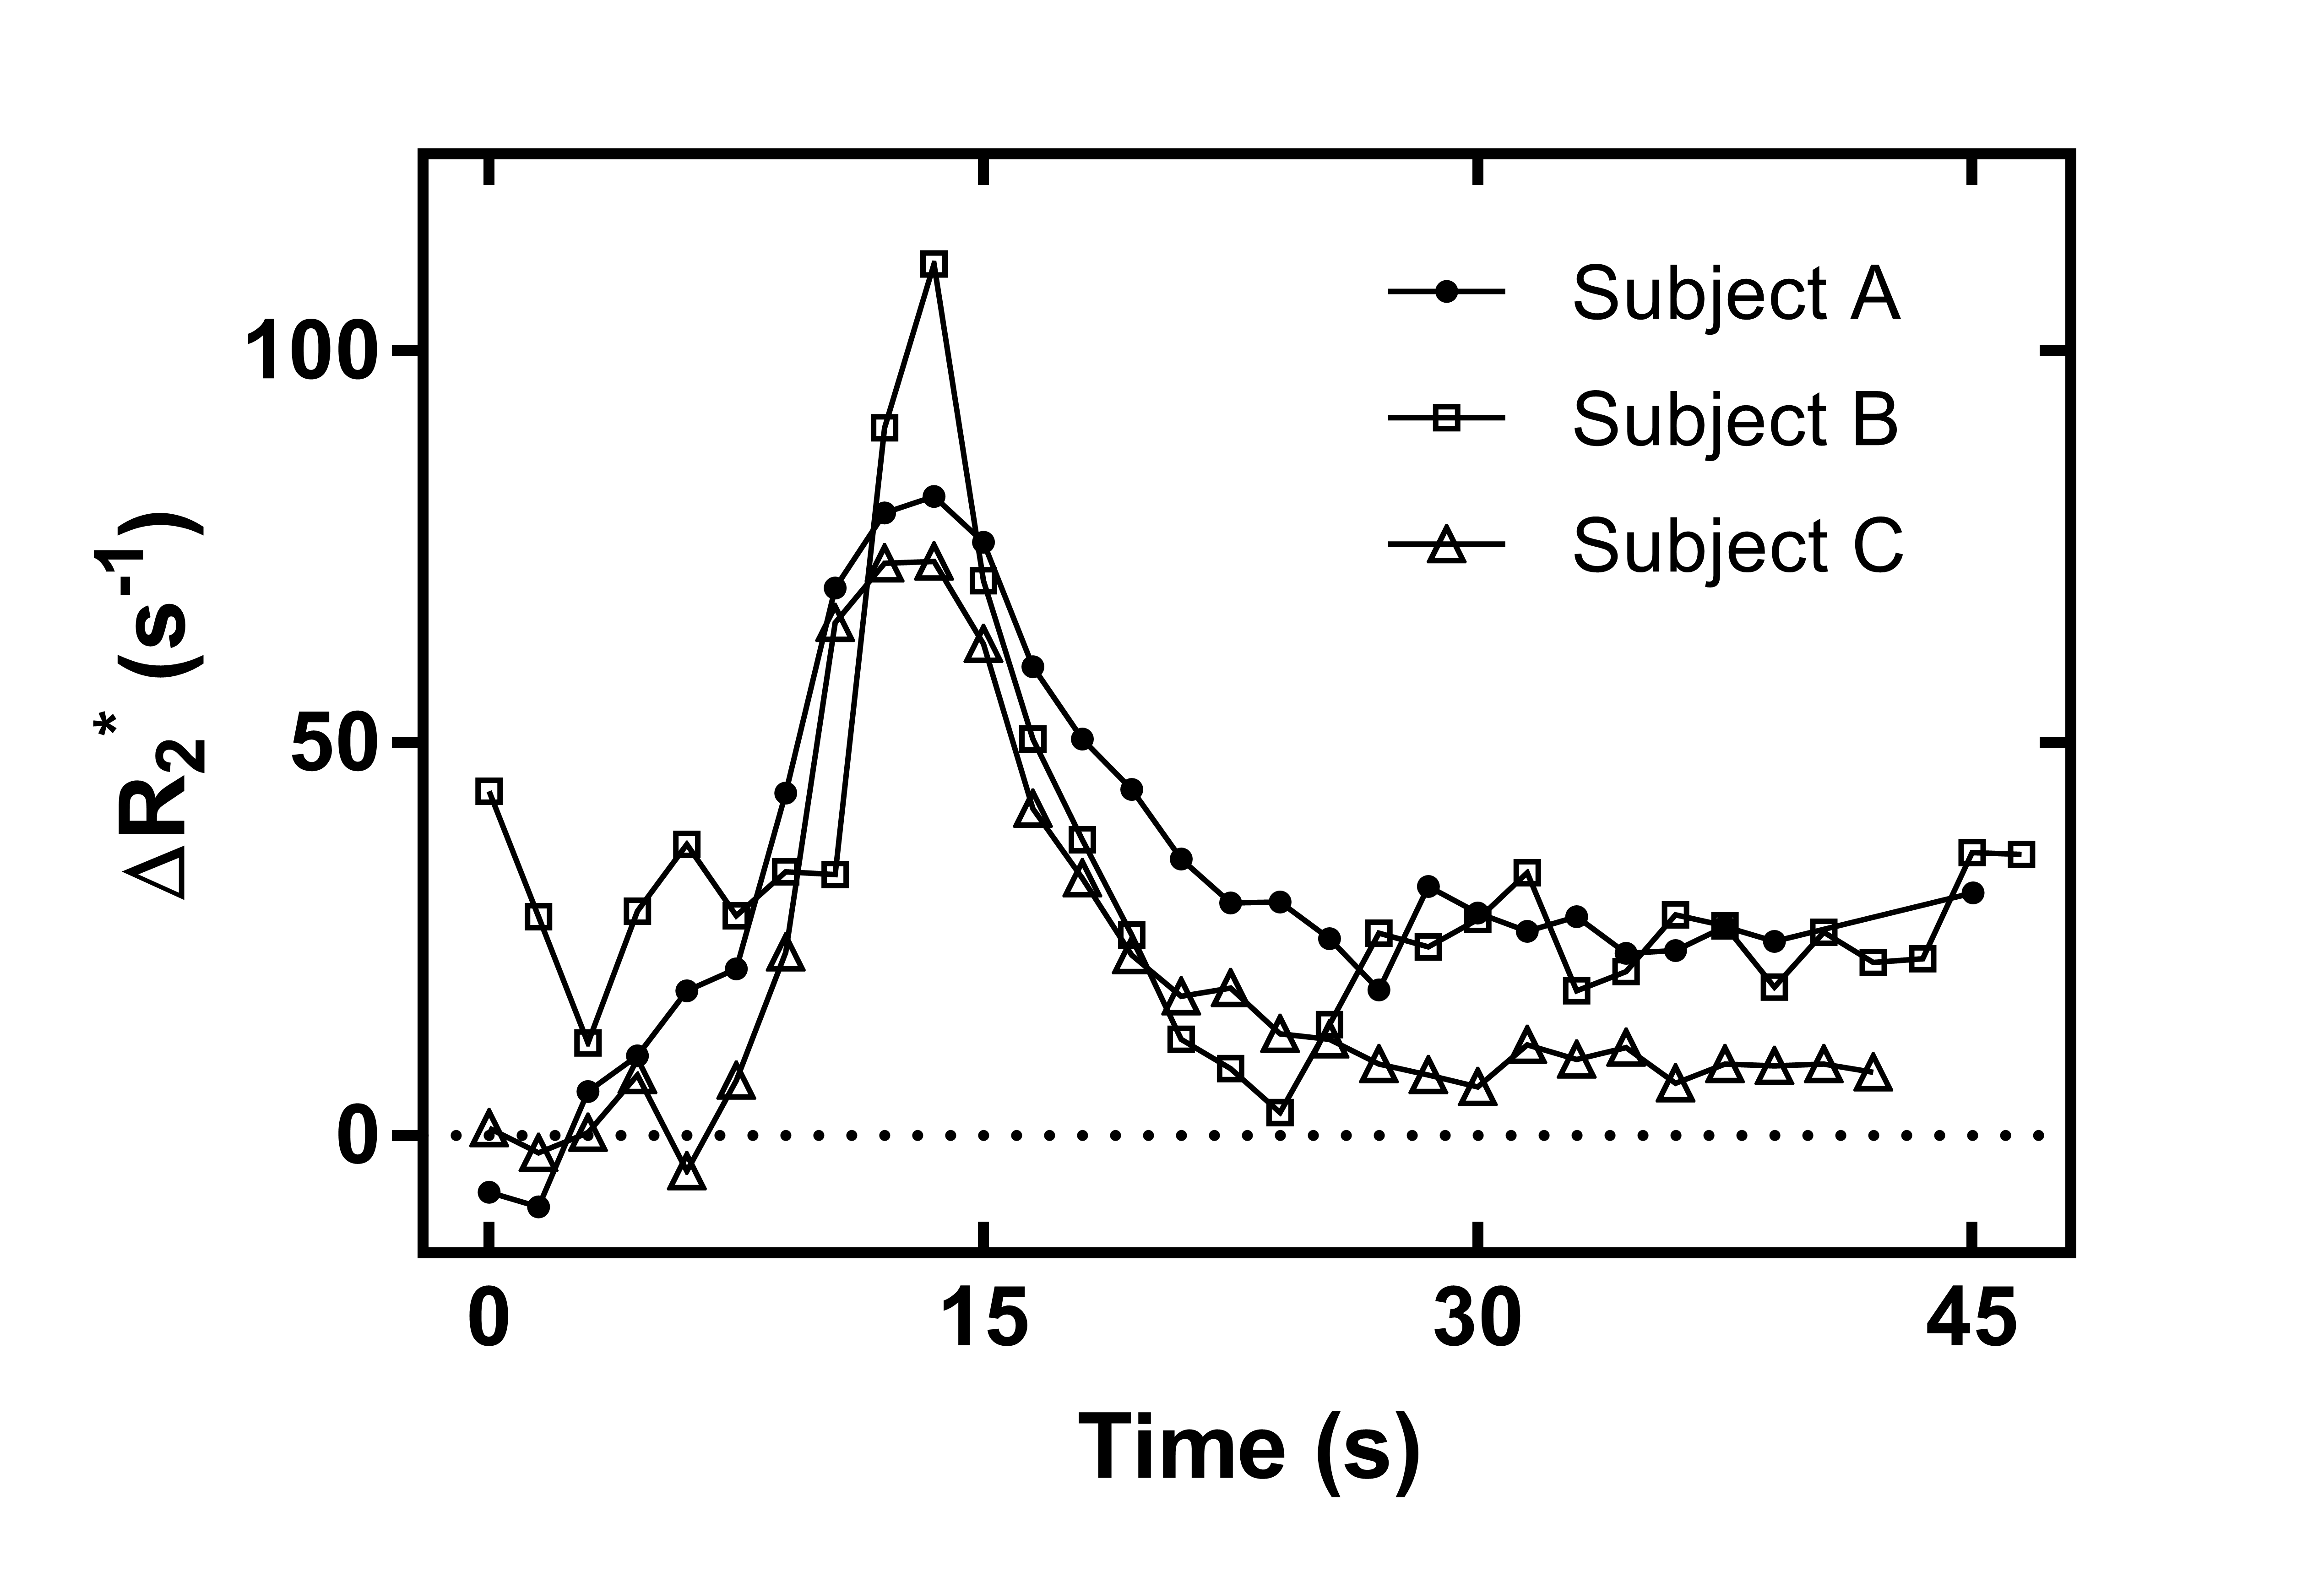
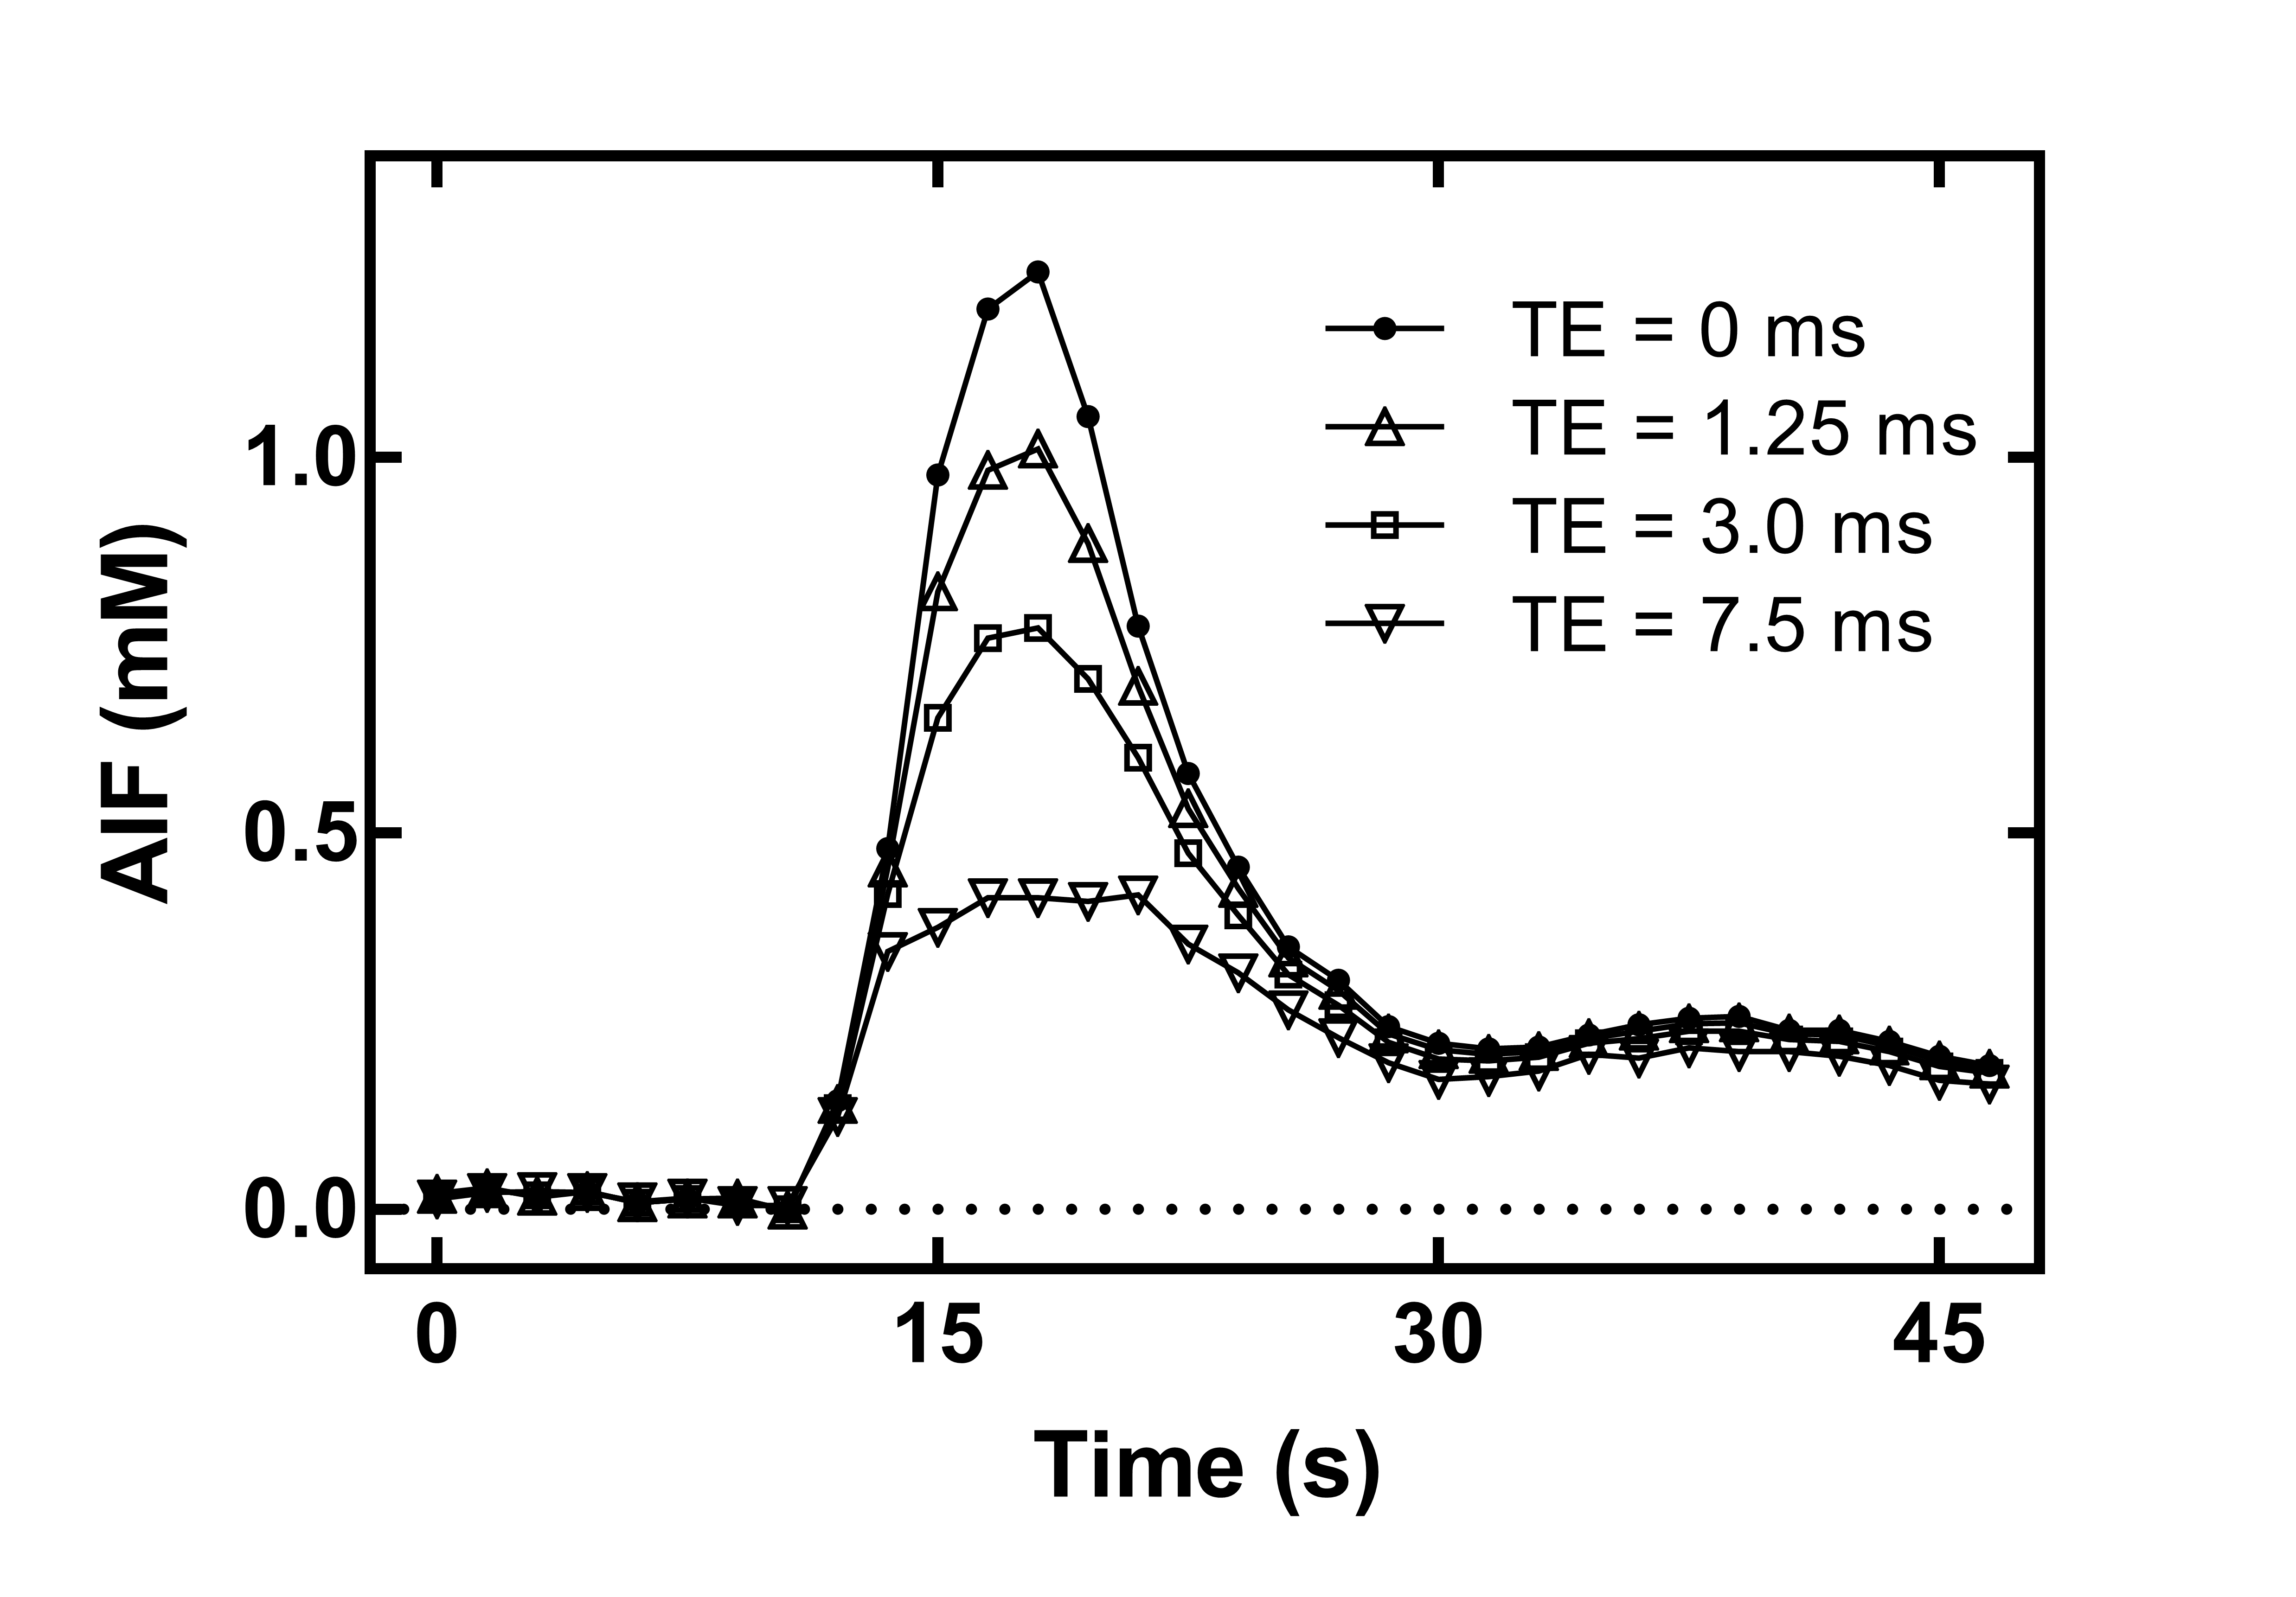
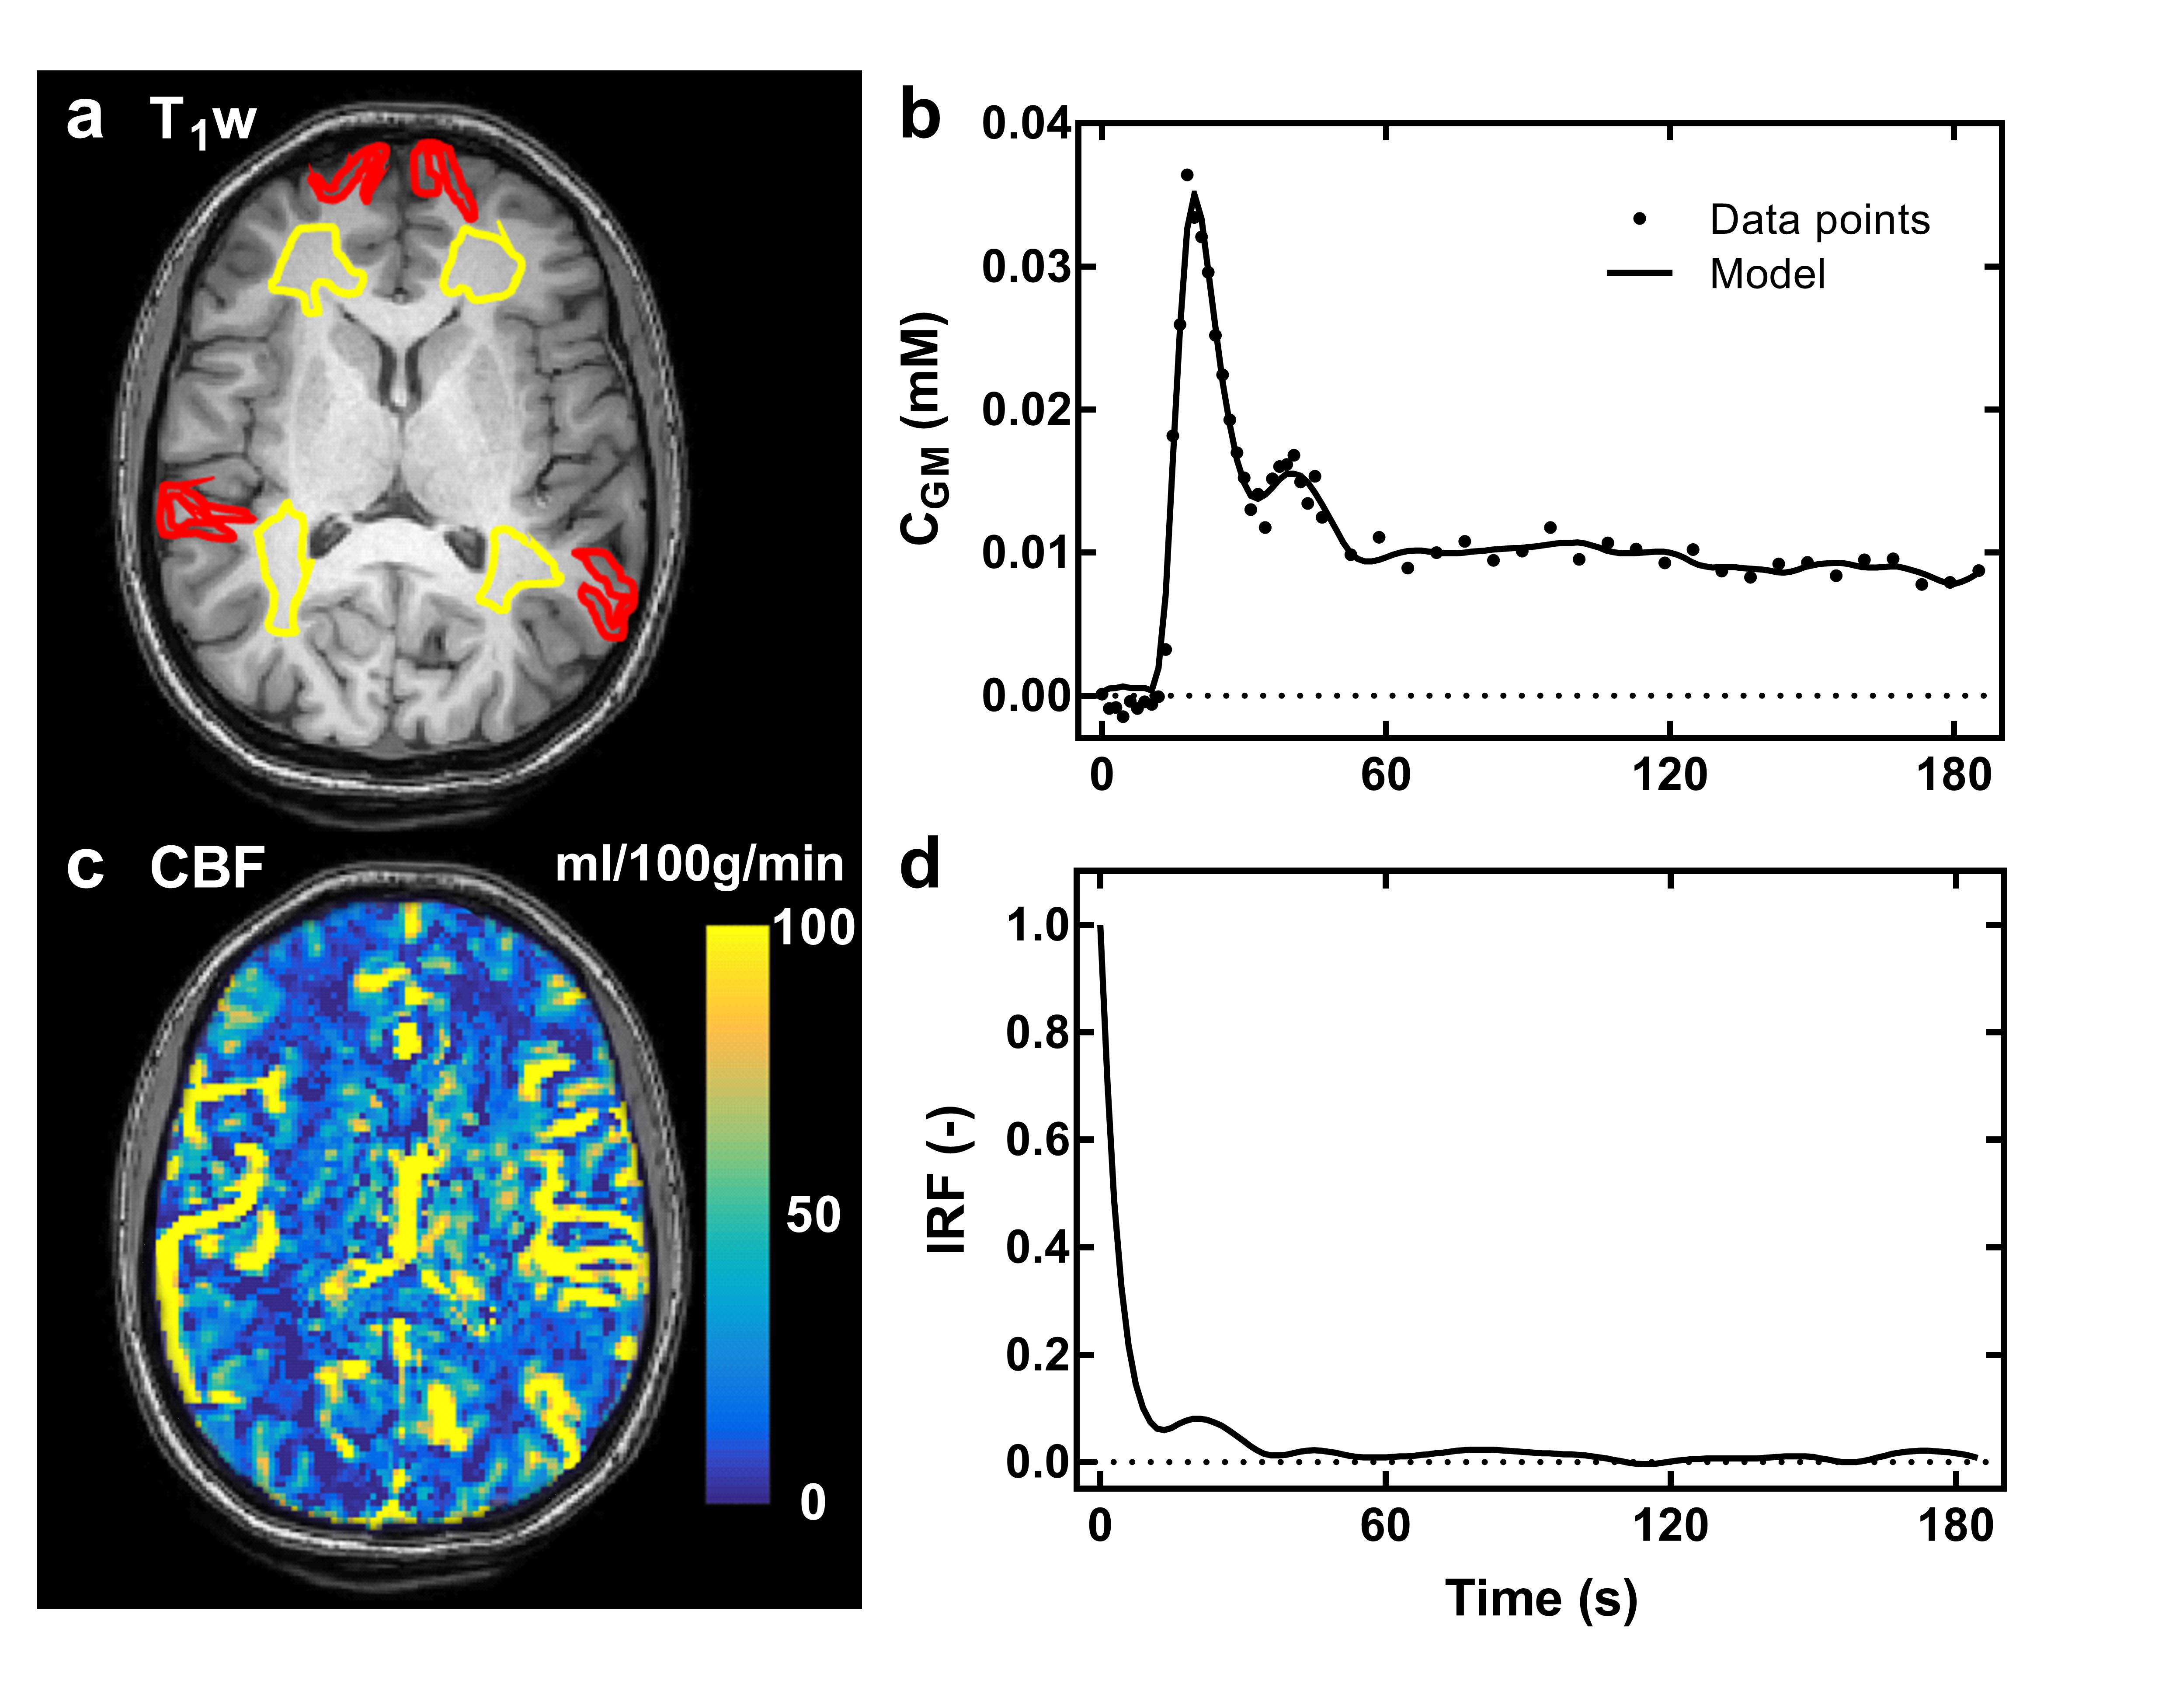
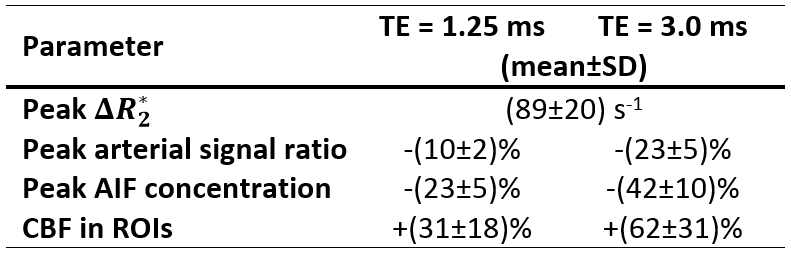
Time curves of $$$\Delta{R_2^*}$$$ in the MCA are shown for each subject (Fig. 1). Correction of $$$\Delta{R_2^*}$$$ effects on the first-pass AIF concentration is presented for subject C in Fig. 2. Fig. 3 shows preliminary results of tracer kinetic modeling for subject C. The modeled concentration and IRF curves are shown for the gray matter ROI (GM). The mean CBF was 26 ml/100g/min in GM and 8.5 ml/100g/min for white matter ROI (WM). Table 1 shows the subject averaged peak $$$\Delta{R_2^*}$$$ and resulting errors in signal ratio, AIF and CBF when AIF is derived from the uncorrected data instead of the corrected "zero echo time" data.
Discussion
$$$\Delta{R_2^*}$$$ variations during a bolus of a half dose of CA causes substantial underestimation of the arterial signal in a healthy brain. Given the non-linear relationship between signal ratio and AIF concentration for RF-spoiled gradient-echo sequences, $$$R_2^*$$$ errors are amplified at the peak of the AIF concentration. These errors propagate to an overestimation of CBF in healthy GM and WM of about 31% for TE=1.25 ms (Table 1).Conclusion
Measurement of the AIF with fast DCE RF-spoiled sequences is affected by $$$R_2^*$$$ effects even with a half-dose of CA and a short echo time. The dual echo flow-compensated sequence proposed here enables a correction for such effect with suitable spatial and temporal resolution for fast DCE imaging.Acknowledgements
B. Bourassa-Moreau acknowledges graduate scholarships from NSERCReferences
1. Sourbron S, Ingrisch M, Siefert A, et al. Quantification of cerebral blood flow, cerebral blood volume, and blood-brain-barrier leakage with DCE-MRI. Magn Reson Med. 2009;62(1):205-217.
2. Larsson HBW, Hansen AE, Berg HK, et al. Dynamic contrast-enhanced quantitative perfusion measurement of the brain using T1-weighted MRI at 3T. J Magn Reson Imaging. 2008;27(4):754-762.
3. Zhang Y, Wang J, Wang X, et al. Feasibility study of exploring a T1-weighted dynamic contrast-enhanced MR approach for brain perfusion imaging. J Magn Reson Imaging. 2012;35(6):1322-1331.
4. de Bazelaire C, Rofsky NM, Duhamel G, et al. Combined T2* and T1 measurements for improved perfusion and permeability studies in high field using dynamic contrast enhancement. Eur Radiol. 2006;16(9):2083-2091.
5. Xu B, Liu T, Spincemaille P, et al. Flow compensated quantitative susceptibility mapping for venous oxygenation imaging. Magn Reson Med. 2014;72(2):438-445.
6. Gilbert G, Létourneau-Guillon L. Complete or partial flow compensation for improved arterial depiction in multi-echo susceptibility-weighted imaging. Proc. Intl. Soc. Mag. Reson. Med. 2014:3187.
7. Cheng H-LM, Wright G. Rapid High-Resolution T1 Mapping by Variable Flip Angles: Accurate and Precise Measurements in the Presence of Radiofrequency Field Inhomogeneity. Magn Reson Med. 2006;55(6):566-574.
8. Yarnykh VL. Actual flip-angle imaging in the pulsed steady state: A method for rapid three-dimensional mapping of the transmitted radiofrequency field. Magn Reson Med. 2007;57(1):192-200.
9. Landis CS, Li X, Telang FW, et al. Determination of the MRI contrast agent concentration time course in vivo following bolus injection: Effect of equilibrium transcytolemmal water exchange. Magn Reson Med. 2000;44(4):563-574.
Figures