1900
Improving Simultaneous T1 and T2* Measurements for Dynamic Susceptibility Contrast MRI using a 3D Distributed Spirals Sequence1Translational Bioimaging Group, Barrow Neurological Institute, Phoenix, AZ, United States, 2MR Technology Design Group, Barrow Neurological Institute, Phoenix, AZ, United States
Synopsis
Multi-echo (ME) DSC-MRI enables the simultaneous assessment of contrast-agent induced T1 and T2* changes, but its sensitivity to and the quantification of these T1 changes could be confounded by long TR and TE. Using simulations, we demonstrate that conventional 2D ME scans underestimate contrast agent concentration and DCE-MRI kinetic parameters. To solve this problem, we propose a 3D ME spiral acquisition that enables lower TRs and minimal TEs for improved T1 quantification and a range of echo times to main T2* sensitivity.
Purpose
Dynamic multi-echo (ME), gradient echo DSC-MRI acquisitions can simultaneously measure and quantify both T1 and T2* changes following contrast agent (CA) administration. Our aim is two-fold: 1) to characterize the sensitivity limits of current 2D based ME DSC-MRI pulse sequences to T1 changes with in silico simulations, and 2) to improve the T1 sensitivity of ME DSC by implementing a 3D dynamic spiral acquisition based on the distributed spirals trajectory.1Materials and Methods
Theory: For derived T1-based changes, the maximum measurable CA concentration (Cmax) for an SPGR sequence can be computed based on scan parameters (TR, TE, flip angle), pre-contrast T1 and T2* values, and CA relaxivity properties (r1, r2*).2 Conventionally these parameters are assumed to be constant over time such that the pulse sequence parameters can be optimized for a clinically useful Cmax. However, the effective r2* will change over time and to a degree dependent on the underlying tissue microstructure.3
Simulations: A DSC-MRI digital reference object (DRO), with 2,000 voxels encompassing a physiologically relevant range of CA kinetics and cellular and vascular microstructural properties, was created5. Both ∆R2*(t) and ∆R1(t) were calculated from the DRO-computed SPGR signals for two pulse sequences: 1) 2D ME DSC based on typical parameters (TR = 1.5 sec, TE1/TE2 = 7/30 ms, 60º flip), and 2) 3D ME spiral DSC based on a 3D spiral sequence (TR = 64 ms, TE1/TE2 = 1.7/30 ms, 60º flip). With the known voxel-wise CA concentration time curves (Ct), effective r2* was calculated as: r2*(t) = ∆R2*(t)/Ct(t). From this the effect of a time-varying r2* on Cmax was evaluated. Next, ME-derived Ct curves were calculated (Ct(t) = ∆R1(t)/r1) and compared to the reference Ct. The Toft’s model was fit to these simulated curves for Ktrans.
Phantom MR Acquisition: ME DSC MRI was performed using a 3D dynamic distributed spiral acquisition1 on a 3T MR scanner (Ingenia, Philips, Netherlands). To mimic a first-pass injection, an 8 mL gadobenate dimeglumine bolus, diluted to 10:1, was injected at a rate of 8 mL/s into a perfusion phantom4. Relevant parameters were: TR/TE1/∆TE = 62/1.7/10 ms, number of TEs = 5, flip = 60º, acquired spatial resolution 3.6 x 3.6 x 3.0 mm3, FOV = 230 (S/I) x 6 (A/P) x 230 (L/R) mm3, readout time = 7.5 ms, and acquired temporal resolution of 0.67 seconds with 449 time frames. Maximum gradient and slew rates are 40 mT/m and 110 mT/m/ms, respectively. Images were reconstructed every 0.67 seconds using a temporal sliding window for a temporal footprint of 2.01 seconds.
Results and Discussion
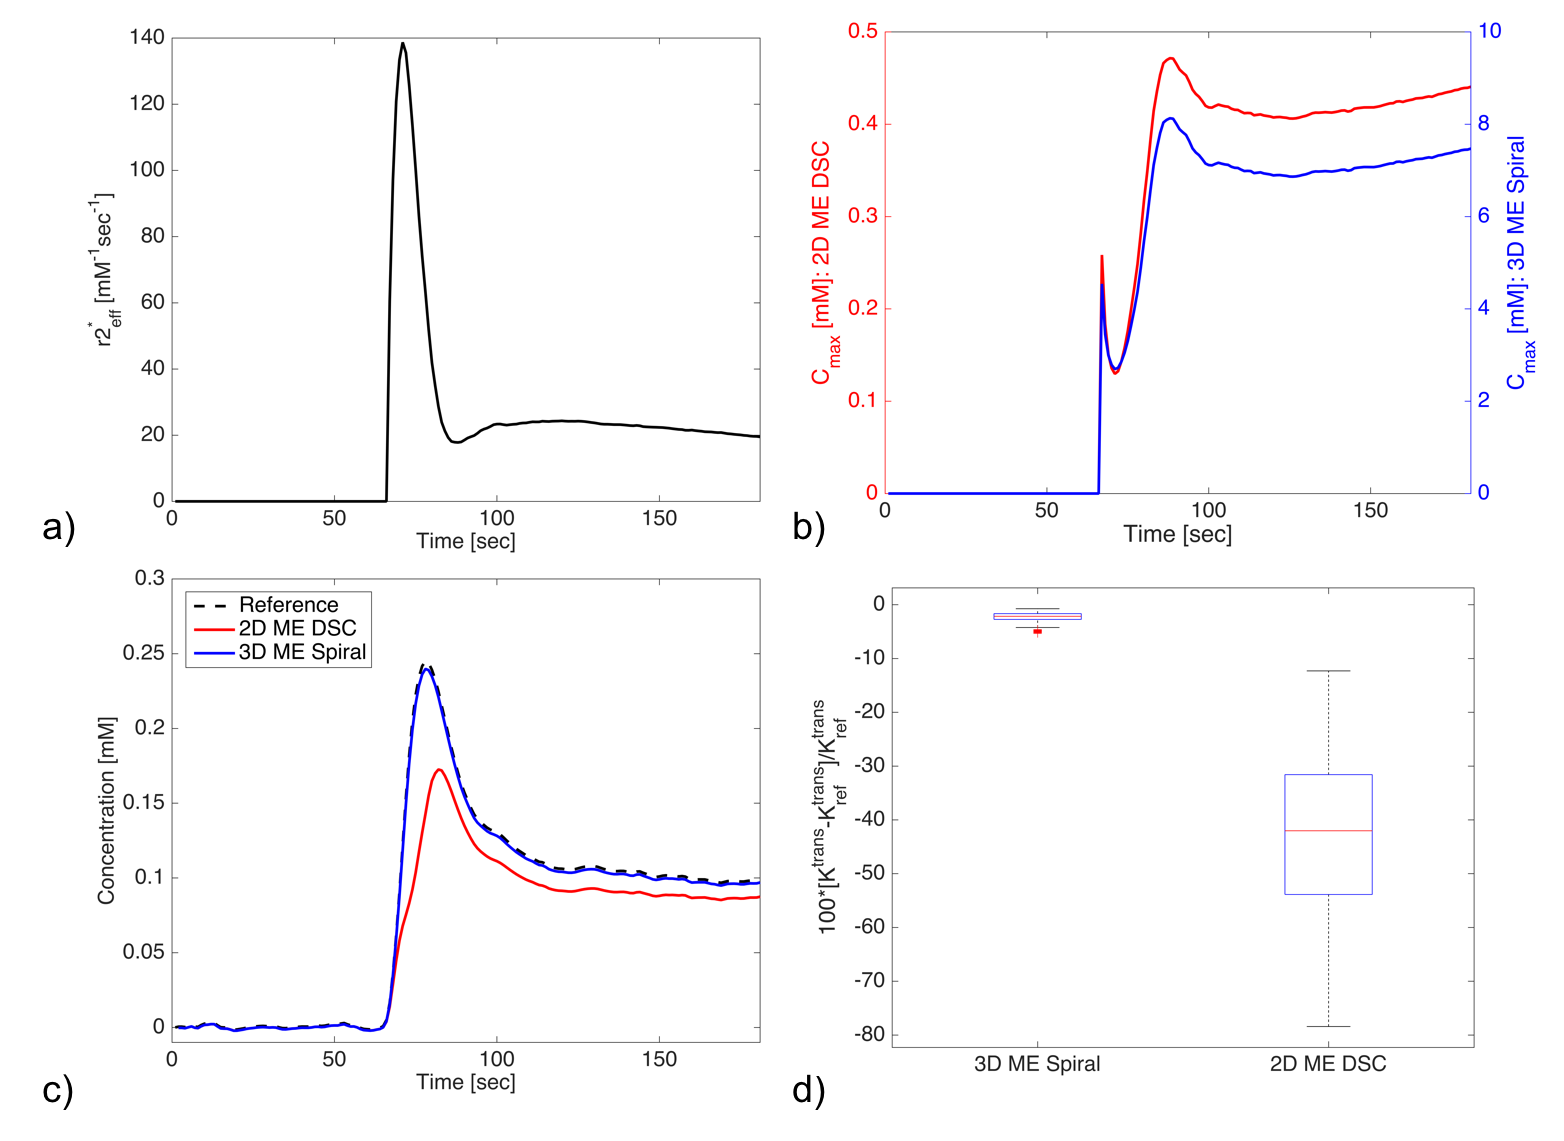
In silico results are shown in Figure 1. During CA passage, the effective r2* of the CA varies across time and can be an order of magnitude higher during the first pass than during the elimination phase (Fig 1a). Consequently, the Cmax is also time dependent and is lowered during the first pass (Fig 1b). Fig 1b illustrates that the Cmax for 2D ME DSC acquisition is much smaller (~20x) than for the 3D ME spiral. The effect of this on the estimated Ct curves is shown in Fig 1c, which shows that the 2D ME DSC substantially underestimates the concentration. The 3D ME spiral, however, accurately reflects the reference Ct because of its much shorter TR and TE times. Ktrans from the 2D ME DSC scans are markedly underestimated, whereas the 3D ME spiral has a <5% error across all input parameters (Fig 1d).
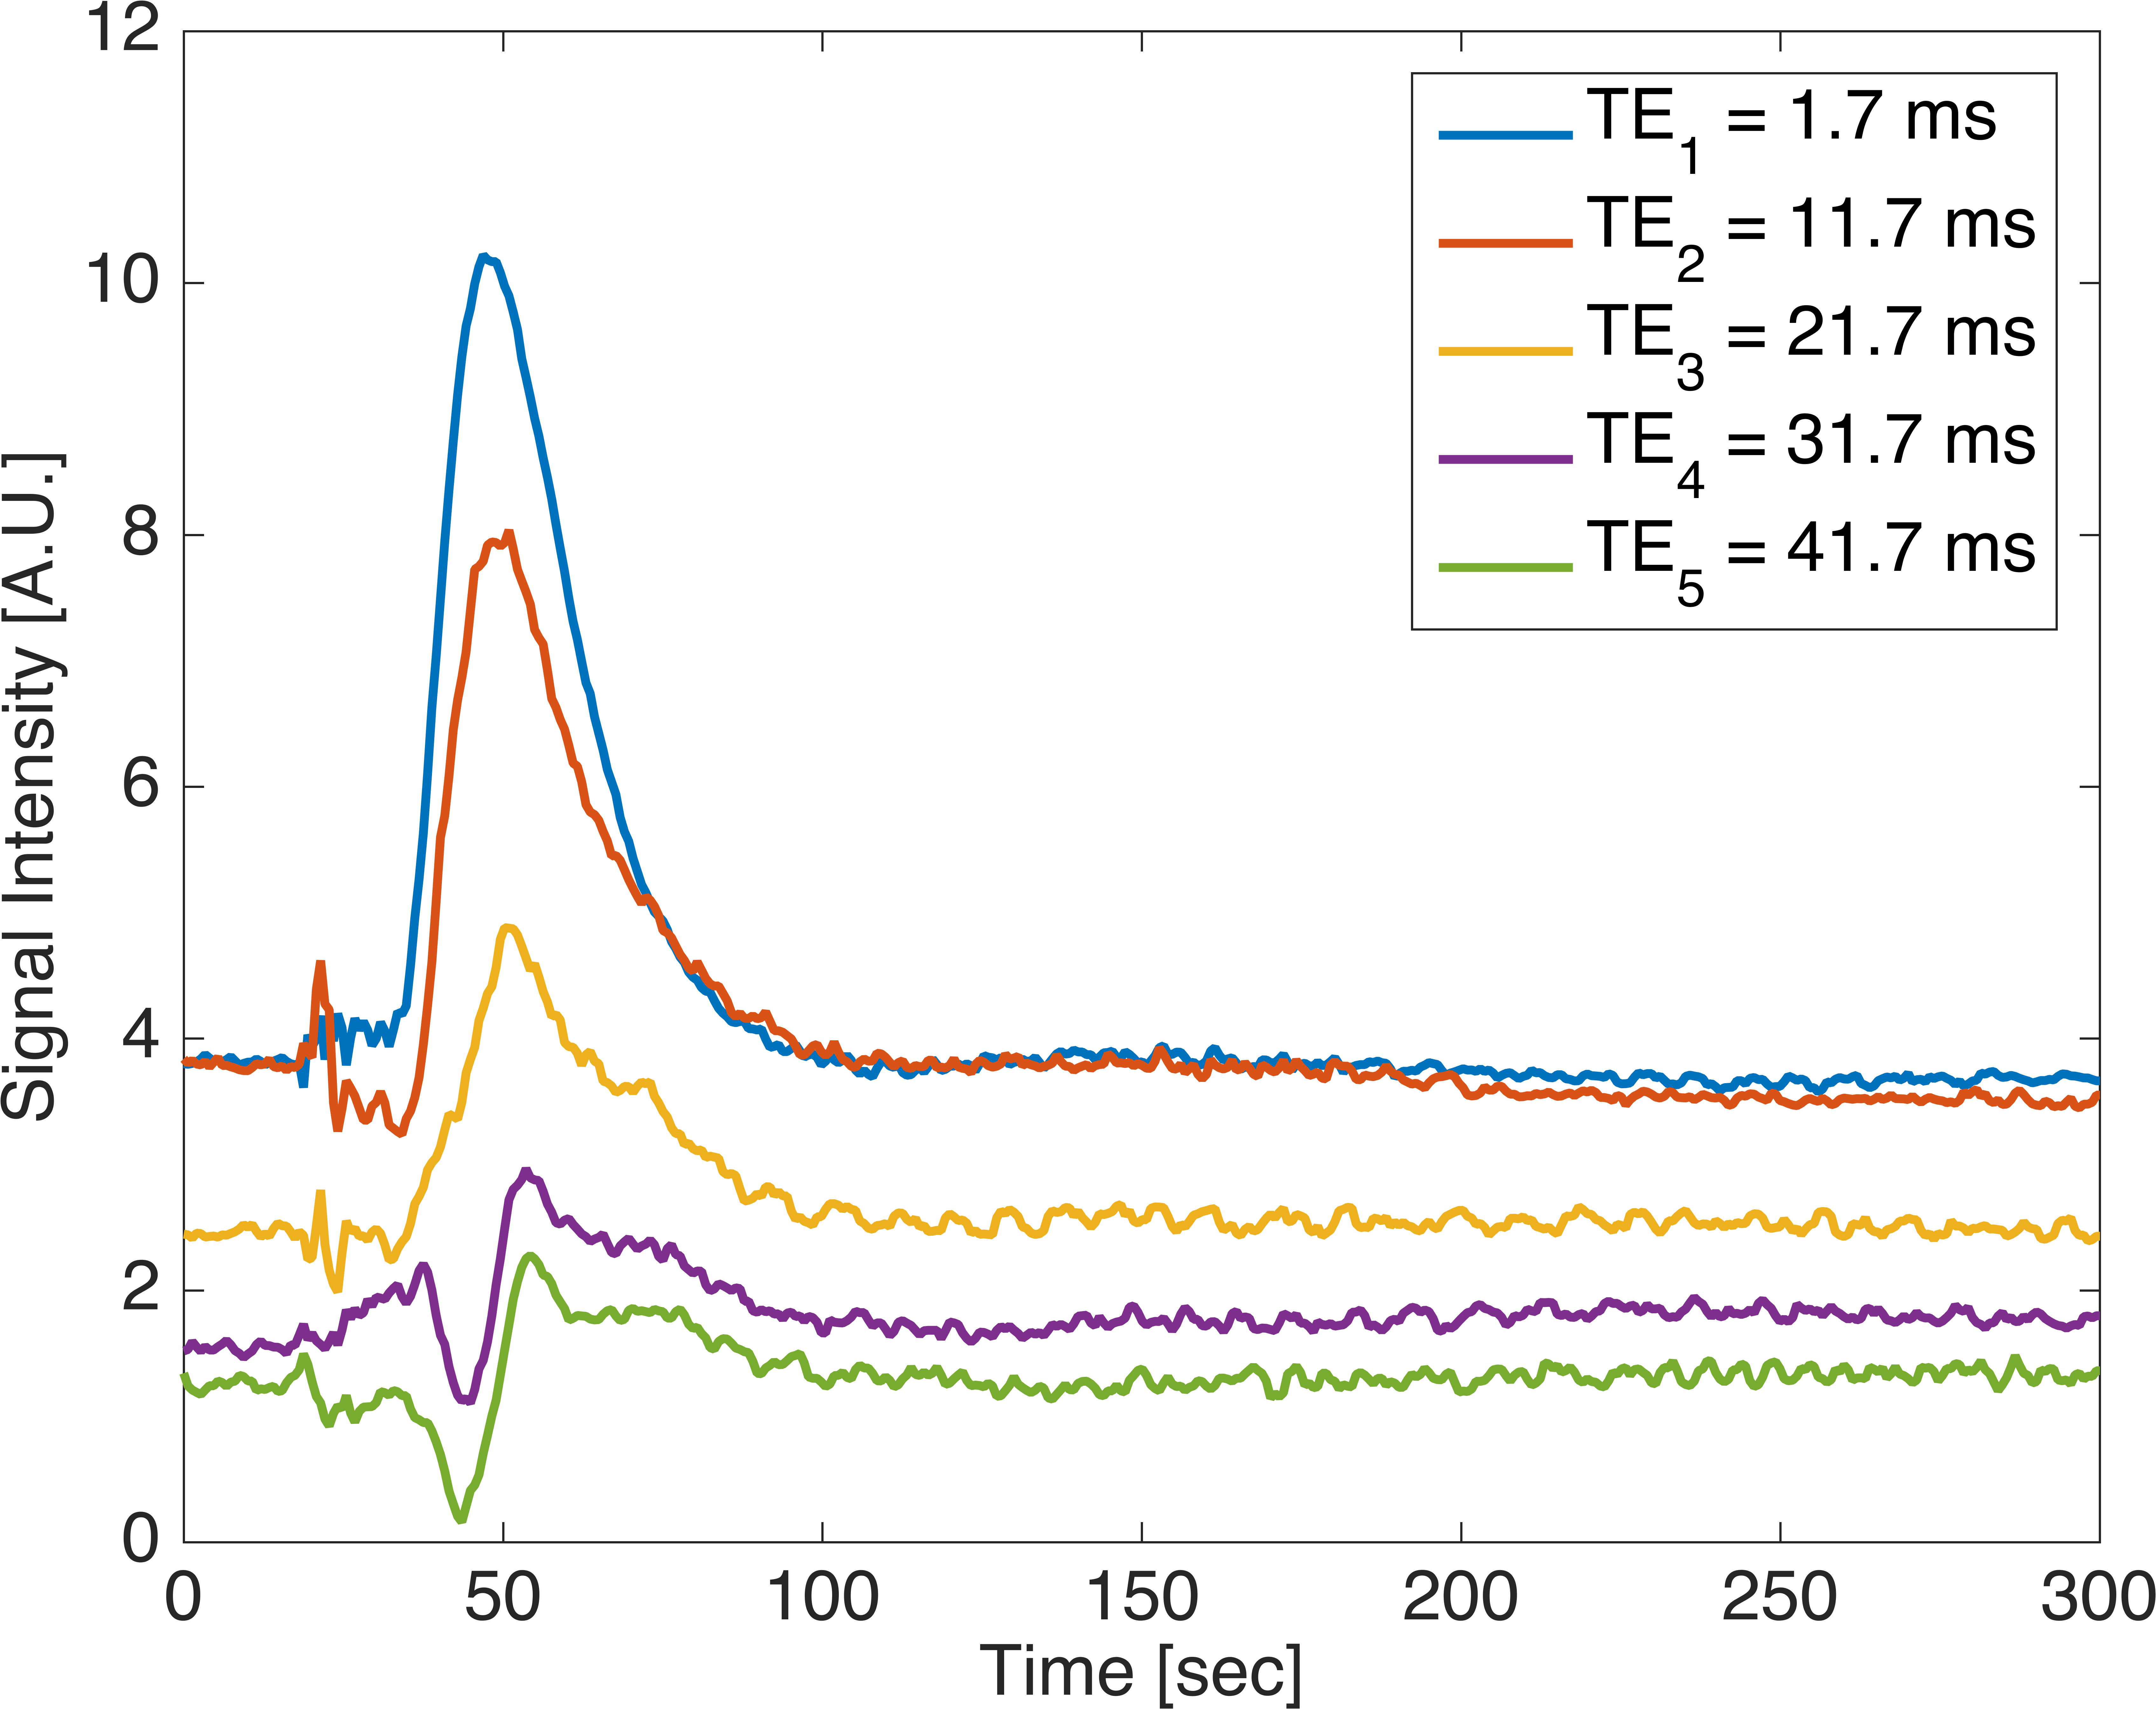
Perfusion phantom data acquired with a 3D ME spiral acquisition is shown for all 5 TEs (Fig 2). Strong T1-weighting of the signal is seen in the first three echo times, whereas T2*-weighting is seen in the last two echo times.
Conclusion
We have shown in silico that T1 changes measured from a 2D ME DSC acquisition with long TR (> 1 sec) and long TE1 (> 7 ms) limit the maximum measurable CA concentration, which results in unreliable DCE-MRI modeling. As a solution, we have proposed the application of a 3D ME distributed spiral acquisition, which enables short TRs (64 ms) and first TE (1.7 ms) for optimal T1 sensitivity and a relevant range of echo times (1.7 - 40 ms) in order to retain sensitivity to T2* changes. In addition, the 3D spiral strategy maintains spatial and temporal resolution, removes EPI-related distortion artifacts, and the ability to optimize the echo times for different purposes (e.g. TE1 for T1 measurements, TE2/TE3 for T2* measurements in the AIF and tumor). We are currently planning to compare and evaluate 2D ME DSC and 3D ME spiral in a cohort of glioblastoma patients.Acknowledgements
We received funding from NIH/NCI R01 CA158079 and Philips Healthcare.References
1. DC Turley et al. Mag. Reson. Med. 2013. 70:413-419.
2. MC Schabel et al. Phys. Med. Biol. 2007. 53:2345-2373.
3. NB Semmineh et al. Mag. Reson. Med. 2014. 74:772-784.
4. NB Semmineh et al. PLoS ONE. 2014. 9(1).
5. IN Kompan et al. Proc Intl. Soc. Mag. Reson. Med. 2016. ID:0798.
Figures