1899
Optimization of Echo Times for CBV Measurements in the Arterial Input Function, Brain, and High-Grade Tumor Tissue using Error Analysis for DSC-MRI1Barrow Neurological Institute, Phoenix, AZ, United States, 2Vanderbilt University Institute of Imaging Science, Nashville, TN, United States, 3Medical College of Wisconsin, Milwaukee, WI, United States
Synopsis
This abstract demonstrates that the optimal TE for a single-echo DSC-MRI acquisition is 30-35 ms (without a preload) and 23-30 ms (with a standard full-dose preload) for a high-grade glioma population. Optimal TEs were calculated using error analysis on T2* values quantified during the first-pass of contrast agent using dual-echo DSC, and were shown to be the weighted-average of these values. Furthermore, we demonstrate that the optimal TE depends on tissue type (tumor/healthy tissue/AIF) and preload.
Purpose
To combine quantitative multi-echo DSC-MRI T2* time curves with error analysis in order to compute the optimal echo times for the arterial input function (AIF), high-grade glioma tumor, and healthy brain tissue in a gradient-echo based DSC-MR acquisition.Theory
During the contrast agent (CA) bolus passage in DSC-MRI, the T2* of the perfused voxel changes over time. Cerebral blood volume (CBV) then is approximated by integrating over this measured change in the transverse relaxation rate (∆R2*) with the assumption that these changes are linear with CA concentration. Applying propagation of error analysis, the variances in both ∆R2* and CBV can be determined in order to produce an equation for the optimal TE needed for a CBV measurement. In summary, the following equation can be numerically solved for the optimal TE that minimizes the variance in CBV (Eq. 1):
$$TE_{opt}=\frac{\sum_{i=1}^Nexp(2TE_{opt}R2^{*}(t))}{\sum_{i=1}^NR2^{*}(t)exp(2TE_{opt}R2^{*}(t))}$$
Essentially, the optimal TE is the reciprocal of a weighted-average of R2* values during the dynamic CA passage.
Methods
Image Protocol: In order to quantify the R2* changes during DSC-MRI, eleven high-grade glioma patients were scanned on a 3T MR imaging system (Signa HDx; GE Healthcare, USA) using a commercial 8-channel phased array coil in this IRB-approved study. A 2D single-shot dual-echo spiral sequence was used to acquire DSC-MRI data with an injection of 0.1 mmol/kg injection of gadobenate dimeglumine 30 seconds after the start of the scan. Relevant acquisition parameters include: TR/TE1/TE2 = 1000/5.6/28 ms, flip angle = 60 degrees, FOV = 22 x 22 cm, slice thickness = 5 mm, slice spacing = 0 mm, number of slices = 16, and an acquired matrix = 128 (frequency) x 128 (phase).
Post-Processing: The transverse relaxation rate was calculated pixel-wise based on the dual echo acquisition to remove T1 effects (Eq. 2):
$$R2^*(t)=-\frac{1}{{TE}_2-{TE}_1}ln\frac{S_{{TE}_1}(t)}{S_{{TE}_2}(t)}$$
By quantifying R2* changes, ROI-based analysis was then used to determine the optimal TE in the arterial input function (AIF), high-grade tumor, and healthy brain tissue by numerically solving Eq. 1 over the first pass of CA. The first pass was determined by the slope of mean whole brain and, on average, was 23 seconds long across all patients.
Results/Discussion
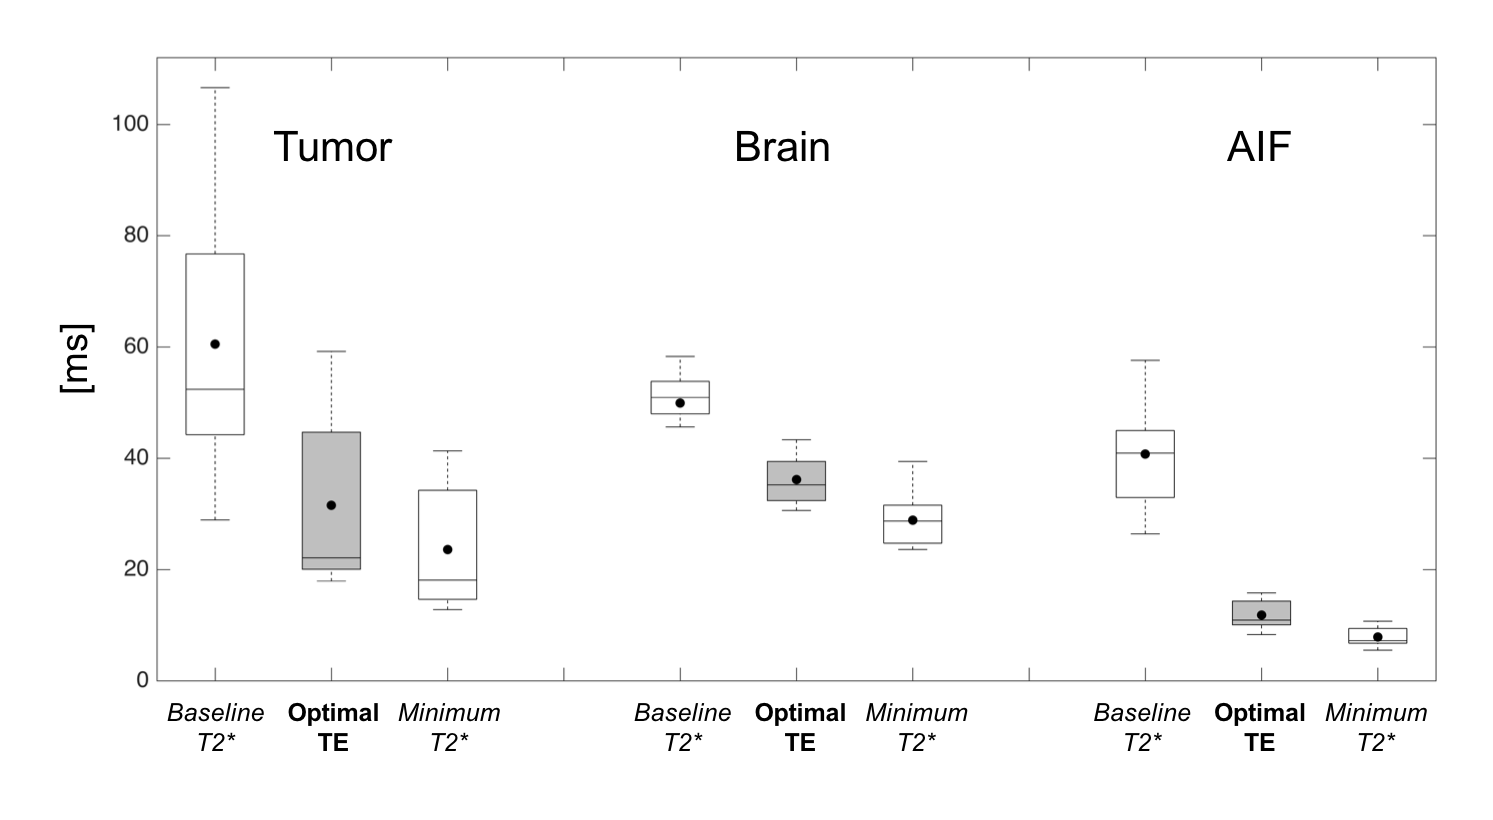
Traditionally, the optimal TE for DSC-MRI scan is thought to be based on the baseline T2* values1. The propagation of error analysis indicates that the optimal TE is the weighted-average of dynamic T2* changes during CA passage, and is much closer to the minimum T2* values than the baseline (Figure 1). Mean optimal TE values were 31.1±15.8 ms for tumor, 34.4±4.0 ms for brain, and 13.0±2.4 ms for AIF. Tumor voxels exhibited a wide range of optimal TE values as compared to healthy tissue. Additionally, we have shown that the optimal TE for the AIF is more than twice as short than the tumor and healthy brain tissue suggesting that the accuracy of the AIF will be diminished due to the longer than optimal TE in a single-echo DSC experiment.
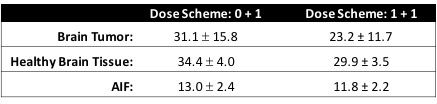
Our results are specific to 3T and the CA dose protocol (one standard dose of CA). In order to decrease CA induced T1 leakage effects, a preload of CA is typically administered roughly 6 minutes prior to a single-echo DSC-MRI scan. Such a preload could decrease the baseline T2* values thereby shortening the optimal TE presented here. To estimate the impact of a standard full-dose preload, we retrospectively analyzed, a separate cohort of 5 glioma patients, multi-echo DSC-MRI data that was acquired for a total of 7.5 minutes. We found that tumor T2* was 35% lower than baseline 6 minutes after the CA injection and was the most affected by the preload, with a T2* drop of 15% and 10% in health tissue and the AIF, respectively. Assuming a 35% decrease in T2* with a preload, the optimal TE will be 35% shorter or an estimated 23.2±11.7 ms. Optimal TE estimation for no preload and a standard dose preload are tabulated in Table 1 for all tissue types.
Conclusion
The results of this study demonstrate that for a conventional single-echo GRE based DSC-MRI, the optimal TE for CBV mapping in brain tumor and healthy tissue is 30-35 ms for no preload or 23-30 ms for a standard dose preload at 3T. Additionally, if a multi-echo DSC-MR acquisition can be employed2, the results indicate which echo times should be selected for AIF estimation and improved CBV mapping.Acknowledgements
We acknowledge Kelly Gardener for her valuable help and funding from NIH/NCI R01 CA158079.References
1. Willats L, Calamante F. The 39 steps: evading error and deciphering the secrets for accurate dynamic susceptibility contrast MRI. NMR Biomed. 2013;26(8):913-931.
2. Jochimsen TH, Newbould RD, Skare ST, et al. Identifying systematic errors in quantitative dynamic-susceptibility contrast perfusion imaging by high-resolution multi-echo parallel EPI. NMR Biomed. 2007;20(4):429-438.
Figures