1898
Can We Trust TRUST Venous Oximetry in Sickle Cell Disease?1Biomedical Engineering/ Cardiology, University of Southern California/ Children's Hospital Los Angeles, Los Angeles, CA, United States, 2Hematology, Children's Hospital Los Angeles, Los Angeles, CA, United States, 3Physiology and Biophysics, University of Southern California, Los Angeles, CA, United States, 4Cardiology, University of Southern California/ Children's Hospital Los Angeles, Los Angeles, CA, United States
Synopsis
In this work we derive a de novo T2b oximetry calibration curve for hemaglobin S containing red blood cells. We then compare predictions made by this calibration and existing T2b calibrations in 84 subjects in vivo using TRUST MRI. We found that predictions for venous oxygenation saturation and cerebral metabolic rate are widely different depending on the T2b calibration used for oximetry conversion.
Introduction
Historically, 14% of children with sickle cell disease will suffer an overt stroke while 40% will have small, neurologically “silent” brain lesions by the age of 20. Given the high incidence of cerebrovascular injury, understanding cerebral oxygen utilization in this population is critical. TRUST is an MRI modality that can be used to derive venous oxygen saturation1. TRUST works by deriving the transverse relaxation of blood (T2b) in vivo, by using a ASL tag and T2 preparation module to label upstream blood. After a short delay, T2b is measured in a draining vein such as the sagittal sinus. Calibration curves are then used to convert the measurement T2b into oxygen saturation(Y)2. Our previous work demonstrated that pre-existing bovine blood calibration are distinct from our de novo human, hemoglobin A (HbA) models, giving separate predictions for venous oxygen saturation (SvO2)3. This highlights the fact that hemoglobin specific T2b calibrations are needed for accurate T2b assessment. In this work we extend upon that work by measuring cerebral blood flow and building a hemoglobin S (HbS) calibration in order to quantify cerebral metabolic rate of oxygen (CMRO2) in healthy African American controls (CTL), patients with sickle cell disease (SCD) and patients with non-sickle anemia syndromes (ACTL).Methods
All studies were approved by the institutional review board at Children’s Hospital Los Angeles and all patients provided informed assent/consent. All studies were performed on a Philips Achieva 3T scanner with an 8 channel receive headcoil.
Blood samples from 15 patients with SCD were used to derive the HbS T2b calibration curve. In addition to T2b calibration studies, complete blood count and hemoglobin electrophoresis was performed (Hb 10.1±1.4, HbS% 66.2±23.9%, HbF 6.6±10.4). The T2b calibration experimental design was similar to previously described methods3. Briefly, individual patient blood samples were measured in a custom built, temperature controlled, air tight, imaging reservoir. Prior to imaging, blood was agitated and oxygen saturation was measured on a bench top co-oximeter. Following T2 measurements the blood was removed from the imaging reservoir and deoxygenated in a temperature controlled gas chamber with a membrane oxygenator circulating a gas mixture of 5% CO2, and 95% O2. Blood was returned to the imaging reservoir and T2 imaging measurements and deoxygenation were repeated until several T2b and oxygenation levels were obtained. Blood was measured at native hemoglobin level and deoxygenated only once to reduce the influence of hemolysis and irreversibly sickled cells.
The sequence used to measured T2b was a CPMG, phase cycled, T2prep module with MLEV composite refocusing pulses(90 180 90) and echo times of 0 40 80 160ms (tau=10ms). MATLAB scripts were used for monoexponenital T2 fitting. Additional parameters included a 1978ms TR, 110 cm FOV, 5mm slice thickness, and 1.7x1.7 mm in plane resolution. In vivo studies were performed on the same imaging platform and coil. T2b of the sagittal sinus was measured using a TRUST sequence similar to above. Blood labeling was performed using TILT and a 1022ms delay time. Cerebral blood flow was measured using a single 2D phase contrast plane, positioned approximately one centimeter above the carotid bifurcation. Image parameters include 260x260mm FOV, TE=7.5ms, 5mm slice thickness, 200 cm/s venc, 10 signal averages. Peripheral pulse oximetry was used measured arterial blood saturation, SaO2. OEF was calculated as (SaO2 – Y)/SaO2. CMRO2 was calculated as 1.34*Hb* OEF*CBF.
Results
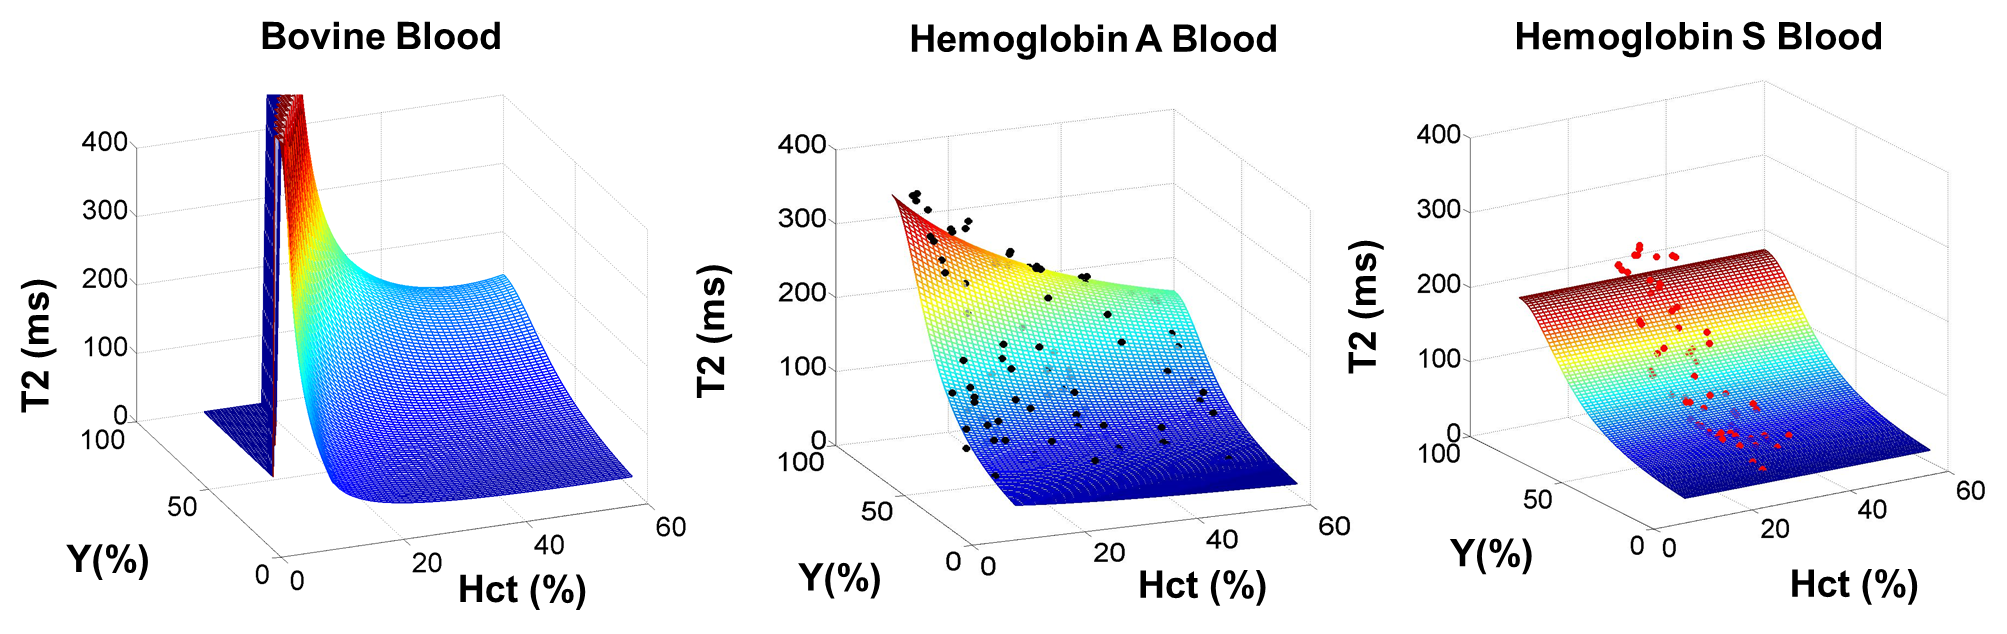
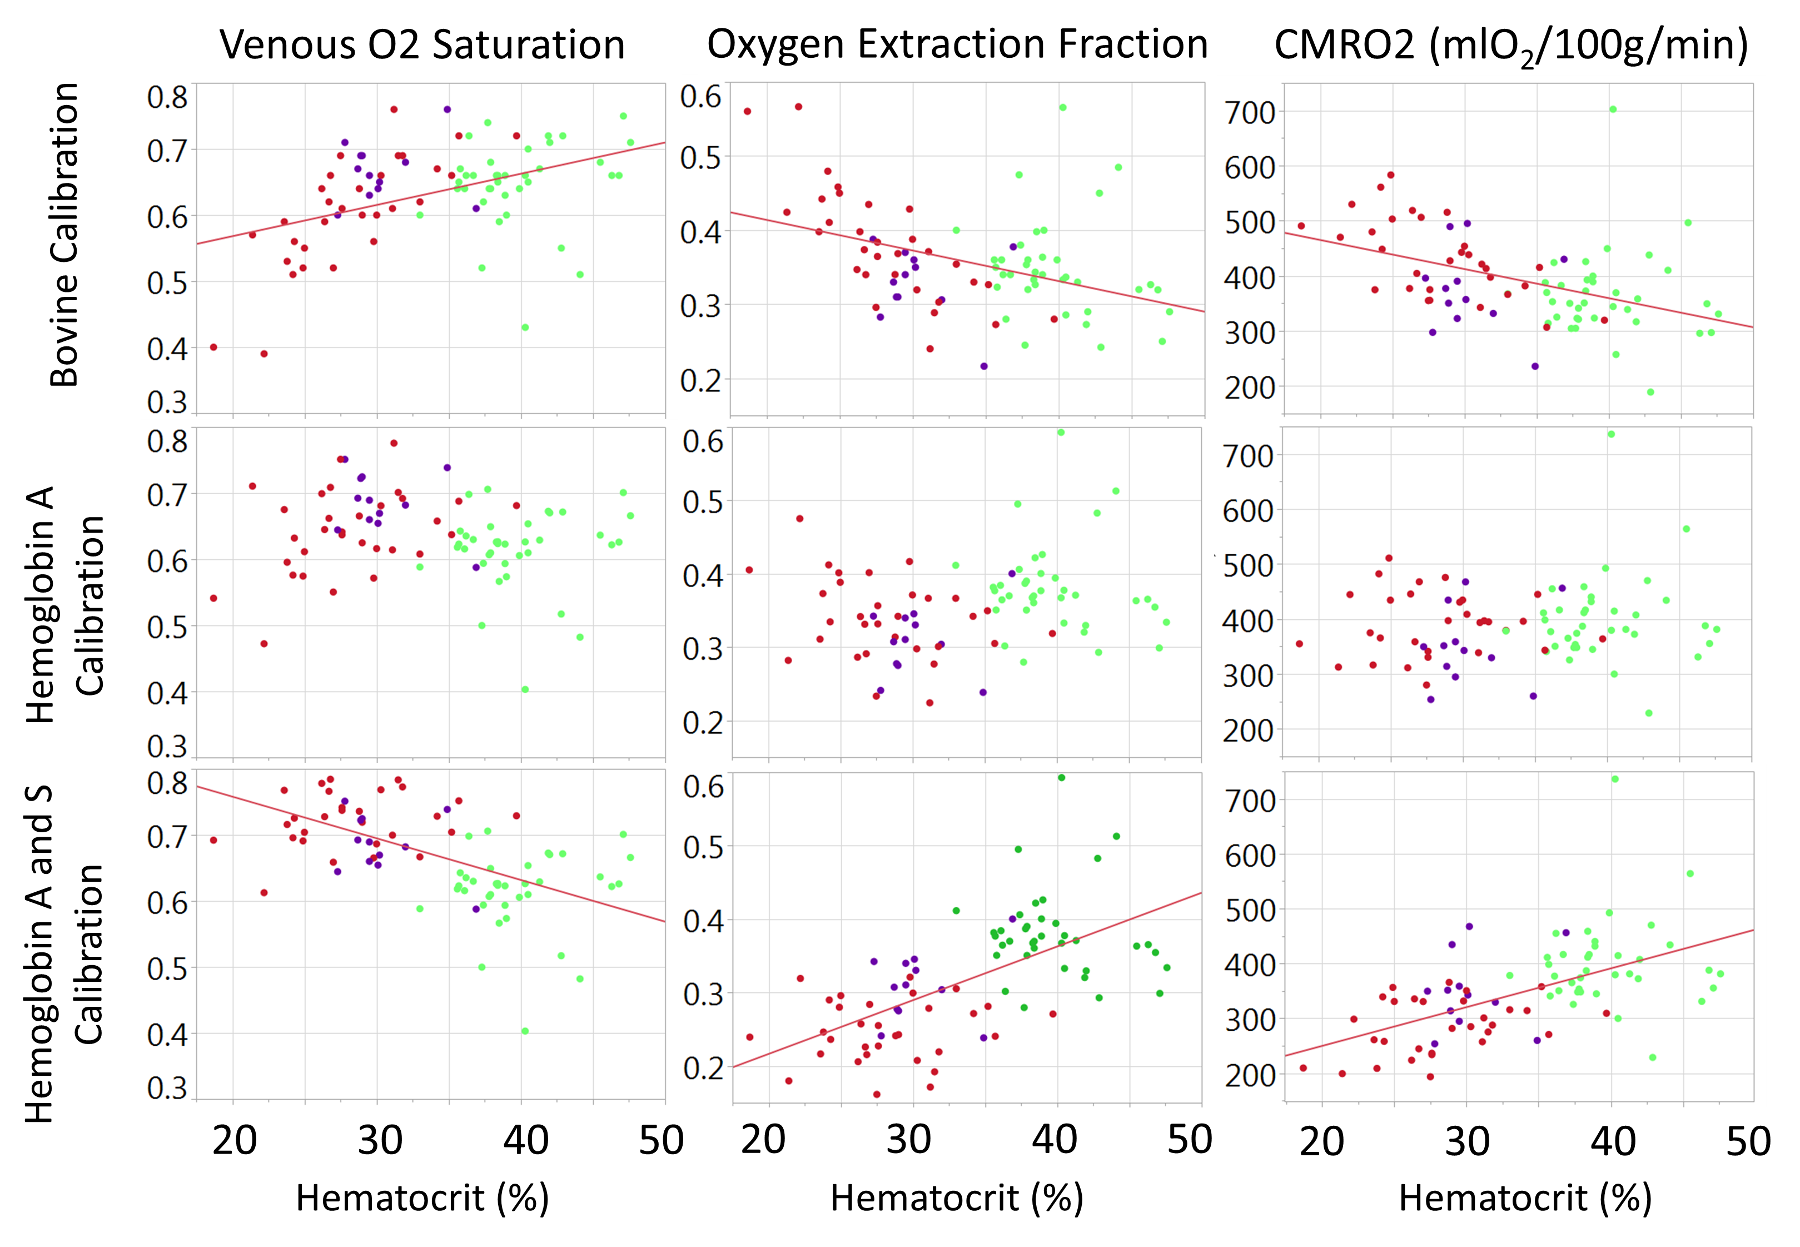
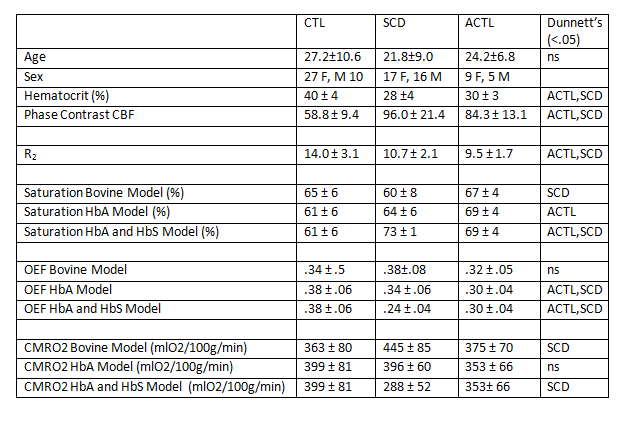
A total of 83 HbS T2b measurements were made over a range of physiologically relevant oxygen saturations (18%-99%) and hematocrits (24%-40%). Neither the bovine nor the HbA model adequately described the observed HbS relaxation fitting (Figure 1). In our data, Hct exhibited no statistical significance on the HbS calibration. The measured data was best described by the HbS T2b calibration curve, 1/ T2b =70.0*(1-Y)2+5.76. In vivo TRUST measurements were made on 84 subjects (37 CTL, 33 SCD, ACTL 14) with additional demographic information within Table 1. Model selection had a significant effect on the derived saturation, OEF and CMRO2, especially in patients with SCD (Table 1). The relationship of OEF and CMRO2 with HCT was highly variable depending on model selection.Discussion
This is the first work to ever derive a T2b calibration model for HbS containing blood and use it in vivo for cerebral oxygenation measurements in SCD. We demonstrate in vitro that the relaxation properties of HbS containing blood are distinct from bovine and HbA blood and must be considered when performing MR T2b oximetry. In patients with SCD, the derived saturation from each calibration model leads to fundamentally different physiologic conclusions and warrants additional study and validation using independent oximetry techniques.Acknowledgements
Acknowledgements: Philips Healthcare and Jon Chia provided support for protocol development and applications engineering on a support-in-kind basis.
Grant Support: This work was supported by the National Heart Lung and Blood Institute (1U01HL117718-01, and Minority Supplement to 1U01HL117718-01) and National Center for Research through the Clinical Translational Science Institute at Children’s Hospital Los Angeles (5UL1 TR000130-05).
References
1. Lu H, Ge Y. Quantitative evaluation of oxygenation in venous vessels using T2-Relaxation-Under-Spin-Tagging MRI. Magn Reson Med. 2008;60(2):357-363.
2. Lu H, Xu F, Grgac K, Liu P, Qin Q, van Zijl P. Calibration and validation of TRUST MRI for the estimation of cerebral blood oxygenation. Magn Reson Med. 2012;67(1):42-49.
3. Bush A, Borzage M, Detterich J, et al. Empirical model of human blood transverse relaxation at 3 T improves MRI T2 oximetry. Magn Reson Med. 2016.
Figures