1897
Spatially localised measurements of oxygen extraction fraction using modified T2-relaxation-under-spin-tagging (SL-TRUST)1FMRIB, Nuffield Department of Clinical Neurosciences, University of Oxford, Oxford, United Kingdom
Synopsis
An existing MR sequence, TRUST (T2-relaxation-under-spin-tagging), is adapted in order to obtain spatially localised T2 measurements for venous blood. T2-encoding, and hence determination of venous oxygenation, is achieved via localised encoding of the longitudinal magnetisation, that is then decoded in the sagittal sinus. Saturation pulses enable spatial localisation by removing signal from unwanted brain regions. Thus, hemispheric and global T2 measurements are acquired and compared. The delay between labelling and arrival of tagged venous blood in the sagittal sinus is evaluated and shown to increase in the presence of saturation pulses.
Introduction
Oxygen extraction fraction (OEF) in the brain is an important indicator of tissue physiology and disease. Regional measurements of brain tissue OEF are of particular importance in cerebrovascular disease and stroke, which are characterized by localized changes in oxygen metabolism. Here, we develop a novel MR sequence, adapted from TRUST (T2-relaxation-under-spin-tagging), in order to obtain spatially localized T2 measurements for venous blood. [1]Theory
The modified TRUST sequence, Spatially-Localised-TRUST, (SL-TRUST) (Figure 1) comprises the following steps: 1) saturation pulses to remove signal from unwanted brain regions, 2) T2-encoding using an MLEV-4 module [2], 3) slab-selective inversion, 4) a delay, TI, in which to allow blood to flow into the sagittal sinus, 5) signal read out in a slice through the sagittal sinus. In this manner, T2 encoding, and hence determination of venous oxygenation, is achieved via localised encoding of the longitudinal magnetisation, that is then decoded in the sagittal sinus.
To demonstrate the concept, spatial localisation of a hemisphere is performed via the insertion of two saturation pulses immediately prior to T2-encoding. One is positioned through the sagittal sinus (to avoid unwanted signal originating from the sagittal sinus itself), the other across a hemisphere, as shown in Figure 2. Thus, the only signal remaining in the read out slice is that of venous blood from the other (non-saturated) hemisphere.
Methods
Data were acquired on 5 healthy subjects (mean age 36, 2 males, 3 females) on a 3T Siemens Verio system (32 channel head receive coil).
Previous work has demonstrated that the arrival of labelled blood in the sagittal sinus is approximately 200 ms after labelling. [1] The first saturation pulse aims to remove unwanted signal from blood originating in the sagittal sinus, we therefore hypothesised that the bolus arrival would be delayed and aimed to confirm and quantify this by sampling for inversion times in the range TI = 75-1200 ms.
We compared global and hemispheric T2 measurements obtained using TRUST and SL-TRUST respectively. An inter-echo spacing $$$\tau$$$CPMG = 7.5 ms gave an MLEV block duration TMLEV = 30 ms. Thus, multiple MLEV blocks were concatenated to achieve a range of effective echo times, eTE = 0-300 ms, in increments of 30 ms, from which T2 could be fitted.
Analysis
Partial volume effects from static tissue and CSF were eliminated via pairwise subtraction of tag and control images. A region of interest (ROI) containing the sagittal sinus was identified for each individual and the four brightest pixel intensities within the ROI averaged.
When quantifying the bolus arrival time the phase of the image was used to correct for signal polarity effects at inversion times shorter than the T1 nulling point of venous blood. For SL-TRUST, with and without sagittal sinus saturation, signal intensity within the ROI was plotted against TI and scaled according to the maximum signal intensity observed across all subjects. Thus the results across all subjects could be combined and averaged.
Global and hemispheric T2 values were calculated by fitting a mono-exponential decay curve to plots of ROI signal intensity versus eTE. These were then translated into estimates of blood oxygenation values via a literature calibration curve and assuming hematocrit levels to be 0.4 for all subjects. [3,4]
Results
As shown in Figure 3, in the absence of any saturation pulses the bolus arrival time is 200-300 ms; when pre-saturation pulses through the sagittal sinus are applied the delay is extended significantly to 800-1000 ms.
Example global and hemispheric T2 decay curves are displayed in Figure 4, with the resulting T2 values for all subjects in Table 1. A two sample t-test confirmed no significant global versus hemispherical T2 differences (p = 0.4250); similarly differences across hemispheres were not significant (p = 0.3446). This is consistent with expectation for healthy subjects. Our estimates for oxygenation (see Table 1) lie in the upper range but within the literature range for venous blood. [5] Measurement variations could be explained by gender differences, in particular differences in hematocrit levels, and by tissue-water signal which may begin to contribute at longer inversion times.
Conclusion
We have demonstrated a proof-of-concept methodology for spatially localized oxygen extraction fraction measurements in the brain using a modified TRUST sequence (SL-TRUST). Using hemispherical saturation pulses we isolate signal from one hemisphere of the brain and read-out in the sagittal sinus. This technique could be developed further to localise signal from smaller brain regions and hence produce a map of localised oxygenation within the brain.Acknowledgements
This work was supported by funding from the Engineering and Physical Sciences Research Council (EPSRC) and Medical Research Council (MRC) [grant number EP/L016052/1], the Dunhill Medical Trust and the Royal Academy of Engineering.References
1. H. Lu and Y. Ge, “Quantitative evaluation of oxygenation in venous vessels using T2- relaxation-under-spin-tagging MRI,” Magn. Reson. Med., vol. 60, no. 2, pp. 357–363, 2008.
2. A. J. Shaka, S. P. Rucker, and A. Pines, “Iterative carr-purcell trains,” J. Magn. Reson., vol. 77, no. 3, pp. 606–611, 1988.
3. D. S. Bolar, B. R. Rosen, A. G. Sorensen, and E. Adalsteinsson, “QUantitative Imaging of eXtraction of oxygen and TIssue consumption (QUIXOTIC) using venular-targeted velocity-selective spin labeling,” Magn. Reson. Med., vol. 66, no. 6, pp. 1550–1562, 2011.
4. T. Christen, D. S. Bolar, and G. Zaharchuk, “Imaging brain oxygenation with MRI using blood oxygenation approaches: Methods, validation, and clinical applications,” Am. J. Neuroradiol., vol. 34, no. 6, pp. 1113–1123, 2013.
5. Q. Qin, K. Grgac, and P. C. M. Van Zijl, “Determination of whole-brain oxygen extraction fractions by fast measurement of blood T2 in the jugular vein,” Magn. Reson. Med., vol. 65, no. 2, pp. 471–479, 2011.
Figures
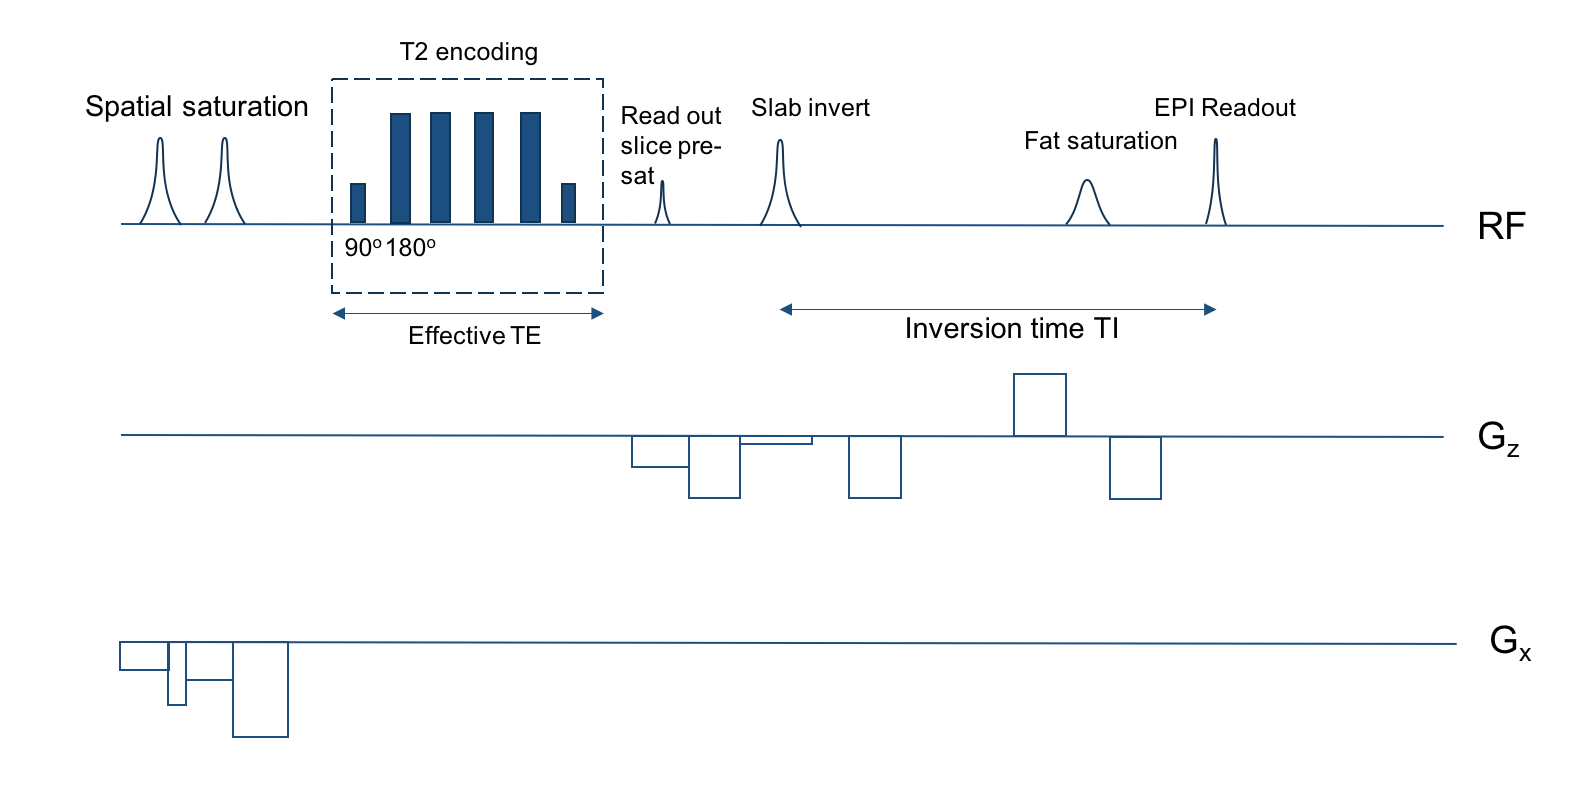
Figure 1 SL-TRUST sequence. Saturation pulses prior to T2-encoding remove signal from unwanted brain regions. A slab-selective inversion is followed by a delay, TI, during which inverted spins flow from the vasculature, into the sagittal sinus to be read out. The MLEV-4 module used for T2-encoding is an iterative Carr-Purcell sequence using a series of 180 degree pulses, and is therefore insensitive to diffusion effects.[2]
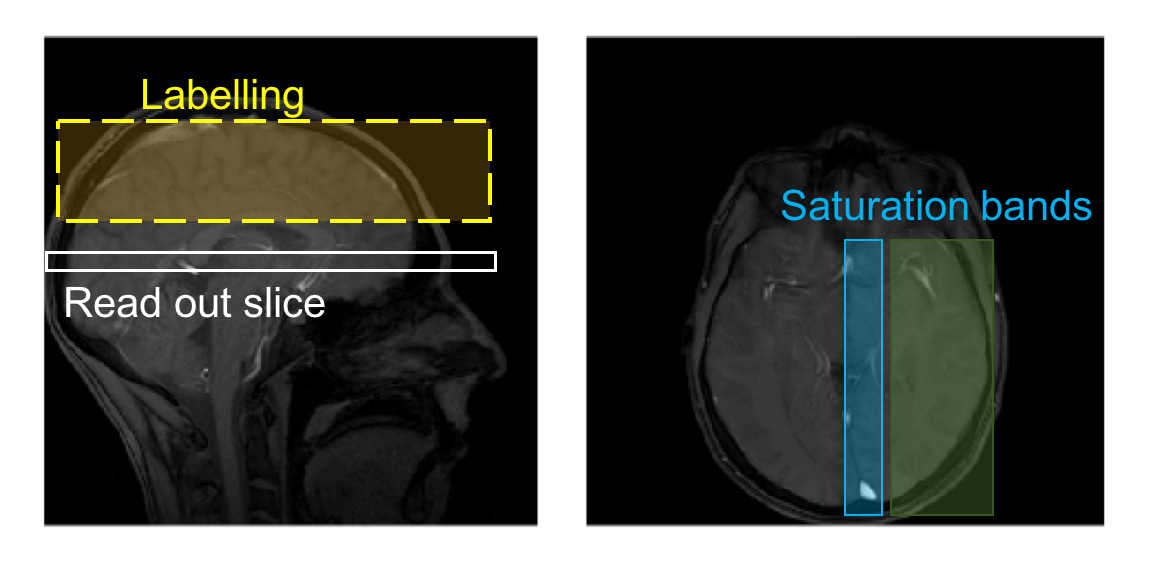
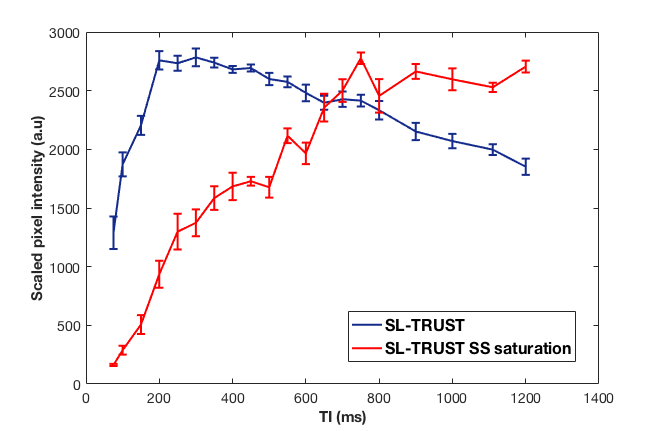
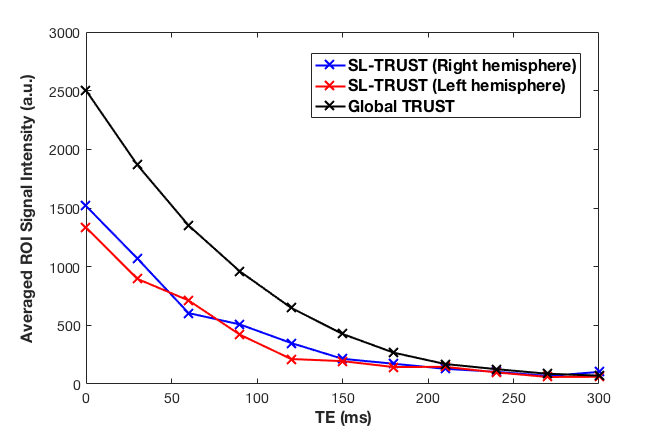
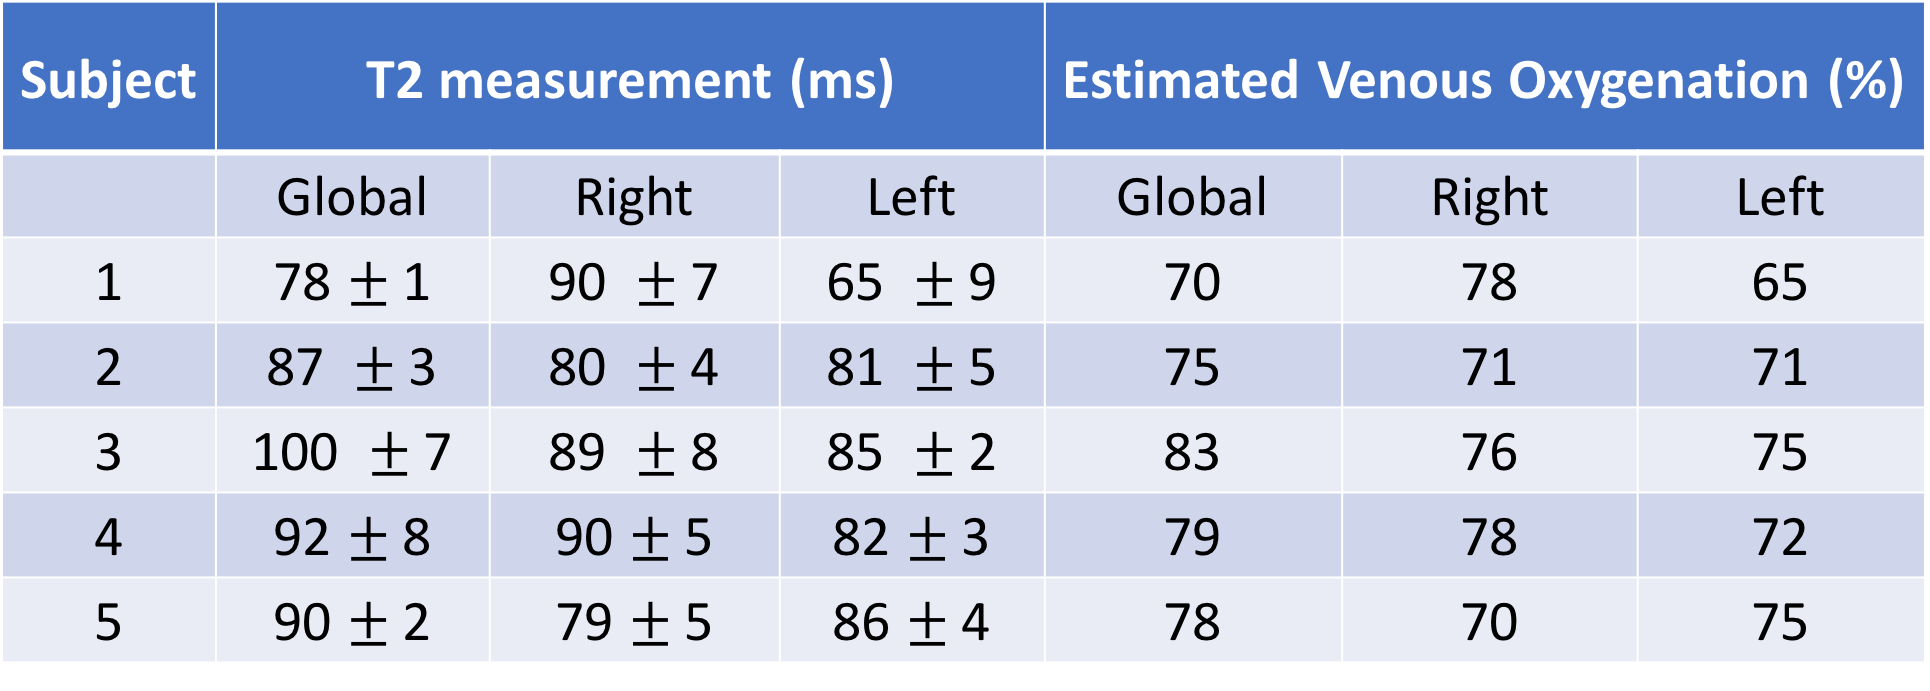
Table 1 Venous blood T2 and oxygenation for global TRUST and hemispheric SL-TRUST. Venous oxygenation values are estimated using a calibration curve and assuming a hematocrit level of 0.4. [3,4]