1896
Feasibility and value of VTE-ASL in quantitative evaluation of unilateral renal embolism in rabbitsHanjing Kong1, Fei Gao2, Chengyan Wang1, Yan Jia3, Hui Xu3, Xiaodong Zhang4, Li Yang3, Jue Zhang1,2, Xiaoying Wang1,4, and Jing Fang1,2
1Academy for Advanced Interdisciplinary Studies, Peking University, Beijing, People's Republic of China, 2College of Engineering, Peking University, Beijing, People's Republic of China, 3Renal Division, Peking University First Hospital, Beijing, People's Republic of China, 4Department of Radiology, Peking University First Hospital, Beijing, People's Republic of China
Synopsis
Arterial spin labeling with variable echo time (VTE-ASL) is a perfusion imaging technique capable of noninvasive estimating of GFR. But the application of VTE-ASL in renal disease is still lagging behind. The goal of this study was to investigate the feasibility of GFR and RBF using VTE-ASL in evaluation of unilateral renal embolism in rabbits. Compared with normal kidney, embolism area has large decrease in GFR and RBF, and was confirmed by histological findings.
Introduction
Twenty renal hemodynamic changes and high vulnerability of the renal outer medulla to hypoxia are learned to be extremely associated with renal disease. Arterial spin labeling with variable echo time (VTE-ASL) is a perfusion imaging technique capable of noninvasive estimating of GFR relying on magnetically labeled water protons as an endogenous tracer [1]. But the application of VTE-ASL in the renal embolism is still lagging behind. The goal of this study was to investigate the feasibility of GFR and RBF using VTE-ASL in evaluation of unilateral renal embolism in rabbits.Methods
The study was accepted by the local ethics committee. Ten New Zealand white rabbits (male, 2.5–3.0 kg) were implemented a unilateral renal infraction surgery procedure after anesthetization. The left kidney was normal and regarded as the control group. MR imaging was performed on rabbits using a 3T MR scanner (Signa ExciteTM; General Electric Medical Systems, Milwaukee, WI, USA) with 8-channel TORSOPA coil, and the coil could cover the abdomen of the rabbits. A 3D SPGR sequence with flip angle= 3°, 9° and 20° was performed for T1 estimation [2] to further compute RBF map. VTE-ASL was performed with variable TEs: 20,40,60,80,100,120,140,160ms. Other parameters are: TR=3000ms, flip angle=90°, slice thickness=5mm, inversion time=1500ms. By adopted a two-compartment cortical model (2CC) and limed the urine T2* around 500ms, both blood R2* and the dimensionless extraction fraction E maps were constructed by fitting the signal time course to a dual-exponential curve. Quantitative RBF maps were calculated by using an established equation on Matlab. The GFR map was also obtained pixel-by-pixel based on the E and RBF maps. Pixels with high perfusion of more than 600 ml/100g/min in the cortex or more than 250 ml/100g/min in medulla were excluded. Kidneys in embolism experiment were fixed in 10% neutral buffered formalin and embedded in paraffin for light microscopic study. Kidneys were sectioned into 3-mm slides and stained for histology with hematoxylin-eosin. One experienced pathologist, who was blind to which experimental group the samples belonged, reviewed histological findings.Results
ASL ΔM images for varying TEs from a rabbit was shown in figure 1. Perfusion signal contrast between the renal cortex and medulla is well demarcated. The blood R2* estimated by ΔM signals was shown fig.2, which related to the tissue oxygen level. The mean RBF from ten rabbits were estimated as 2.14 ± 0.81 ml/min in embolism renal and 2.97 ± 1.01 ml/min in normal renal. The mean RBF of normal renal is similar to previous studies [3,4]. The extraction faction E reported by ROI analysis was 0.21±0.10 in cortex, 0.62±0.17 in medulla, and 0.41±0.12 in the whole kidney. The typical GFR values, which were the product of extraction fraction and renal plasma flow (RPF), reported as 2.51 ± 0.34 ml/min for embolism renal and 3.14 ± 0.22 ml/min for normal renal. Large decrease of GFR and RBF were found in upper-left area of the right kidney (white arrow, GFR = 0.15 ± 0.11 ml/min, RBF = 0.12 ± 0.08 ml/min). Significance difference was found compared with symmetrical area of normal kidney (GFR = 3.04 ± 0.26 ml/min, RBF =2.87 ± 0.30 ml/min, P=0.001). However, intensity of E map and R2* between embolism and normal kidney did not show significant difference across all rabbits. This area had proved infraction by tissue specimen (figure 4). The glomeruli show ischemic and wrinkled features with dilated change of Bowman‘s capsule. Abscission of the epithelial cells and tubular ectasia and cellular debris (arrowheads) are observed. Lamellar inflammatory cells infiltrating in renal interstitium.Discussion and Conclusion
By using the VTE-ASL method, the RBF, blood R2* and GFR maps were obtained simultaneously. Significant difference of RBF and GFR were found between embolism and normal kidney area and was confirmed by histological findings. This study demonstrated a feasible approach for renal embolism evaluation based on time course ASL technique with multi-TEs.Acknowledgements
No acknowledgement found.References
[1] Jing Wang, Yudong Zhang, Yue Zhang, Xiaoying Wang, Jue Zhang, and Jing Fang. The feasibility study of exploring arterial spin labeling for renal glomerular filtration rate ( GFR) mapping. ISMRM, 2012. [2] Chen B, Kai Z, Bo L, et al. High temporal resolution dynamic contrast-enhanced MRI using compressed sensing-combined sequence in quantitative renal perfusion measurement[J]. Magnetic Resonance Imaging, 2015, 33(8):962-969. 3. Robson P M, Madhuranthakam A J, Dai W, et al. Strategies for reducing respiratory motion artifacts in renal perfusion imaging with arterial spin labeling[J]. Magnetic resonance in medicine, 2009, 61(6): 1374-1387. 4. Roberts D A, Detre J A, Bolinger L, et al. Renal perfusion in humans: MR imaging with spin tagging of arterial water[J]. Radiology, 1995, 196(1): 281-286.Figures
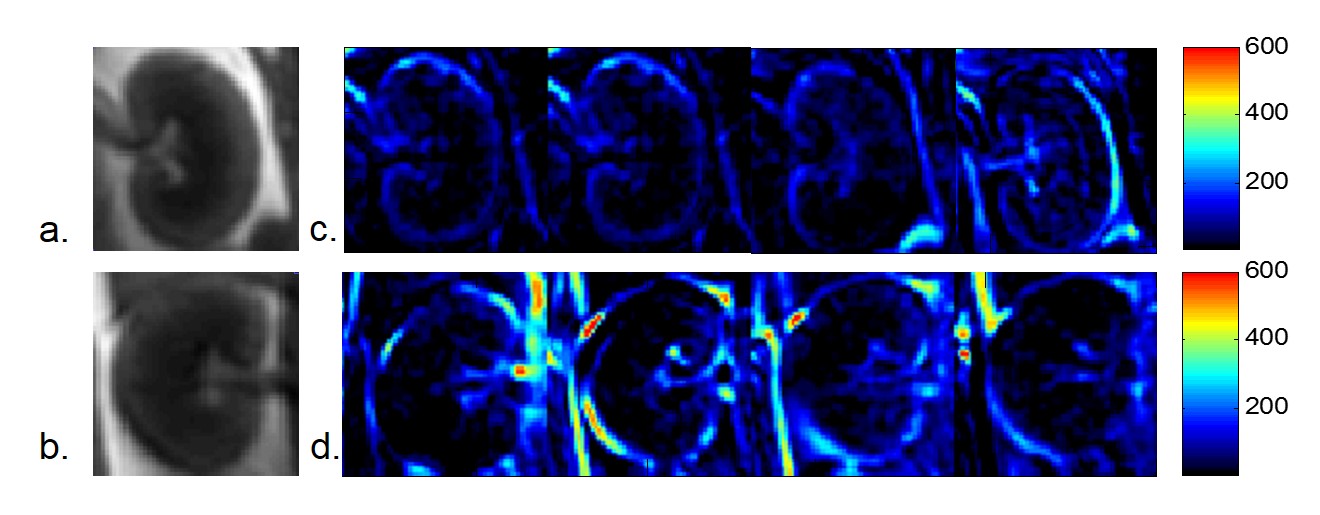
Figure1. Raw rabbit ASL (a)(b) and (c)(d) typical ΔM
images with varied TEs. From left to Right: TE = 20, 40, 60, 80ms.
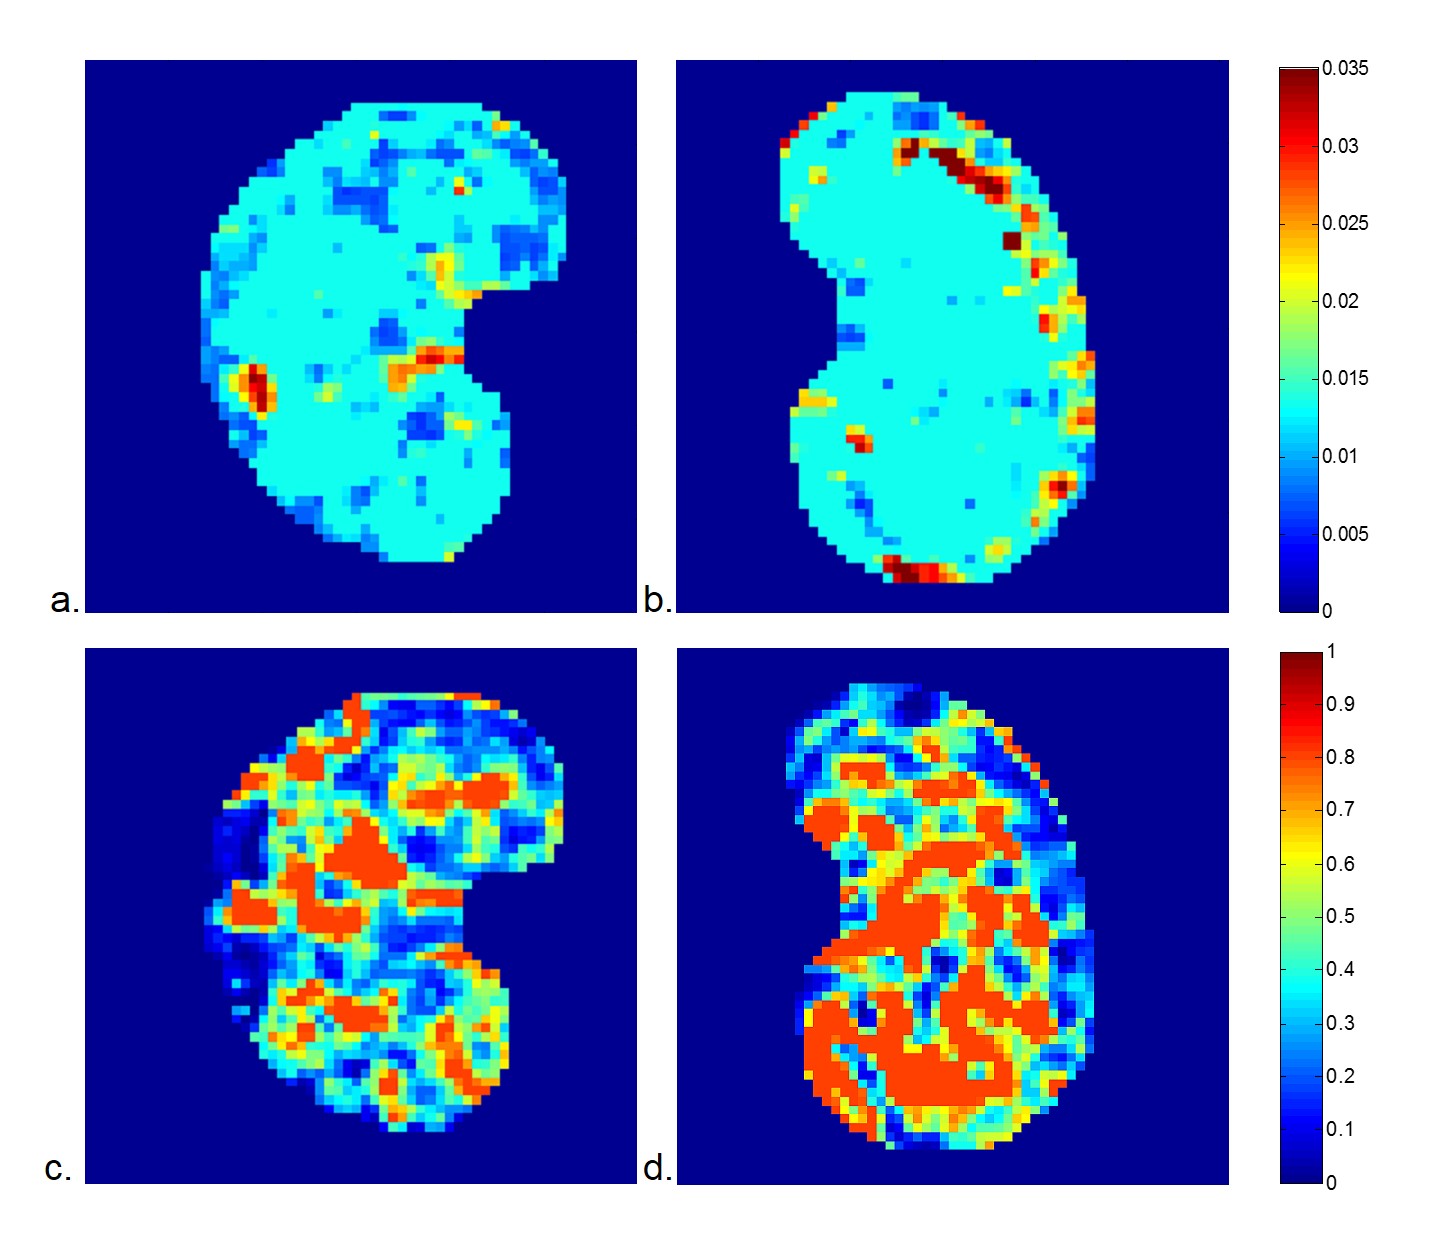
Figure 2. The typical (a)(b) blood R2* map (Hz)
and (c)(d) extraction extraction fraction map of right and left kidney produced
by the two compartment model based on VTE ASL.
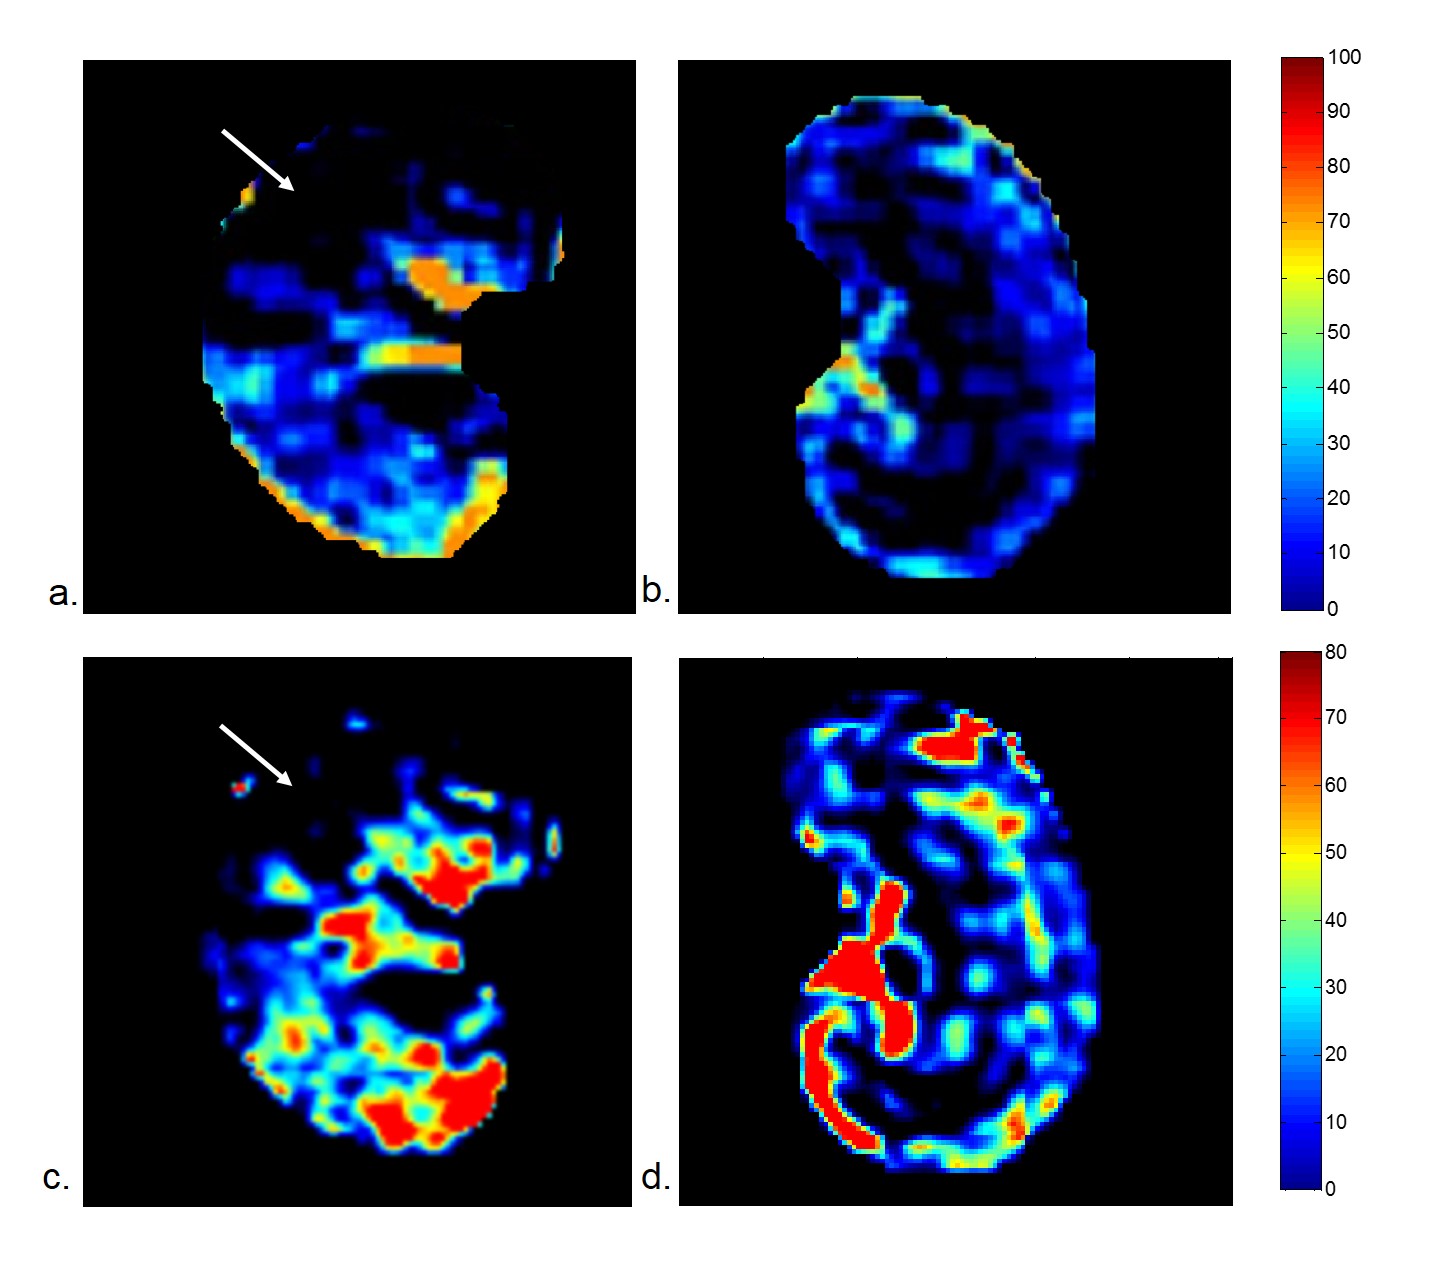
Figure 3. The typical (a)(b) GFR map (ml/min) and (c)(d)
RBF map (ml//min) of right and left kidney produced by the two compartment
model based on VTE-ASL. Large intensity decrease were found in upper-left of
embolism kidney.
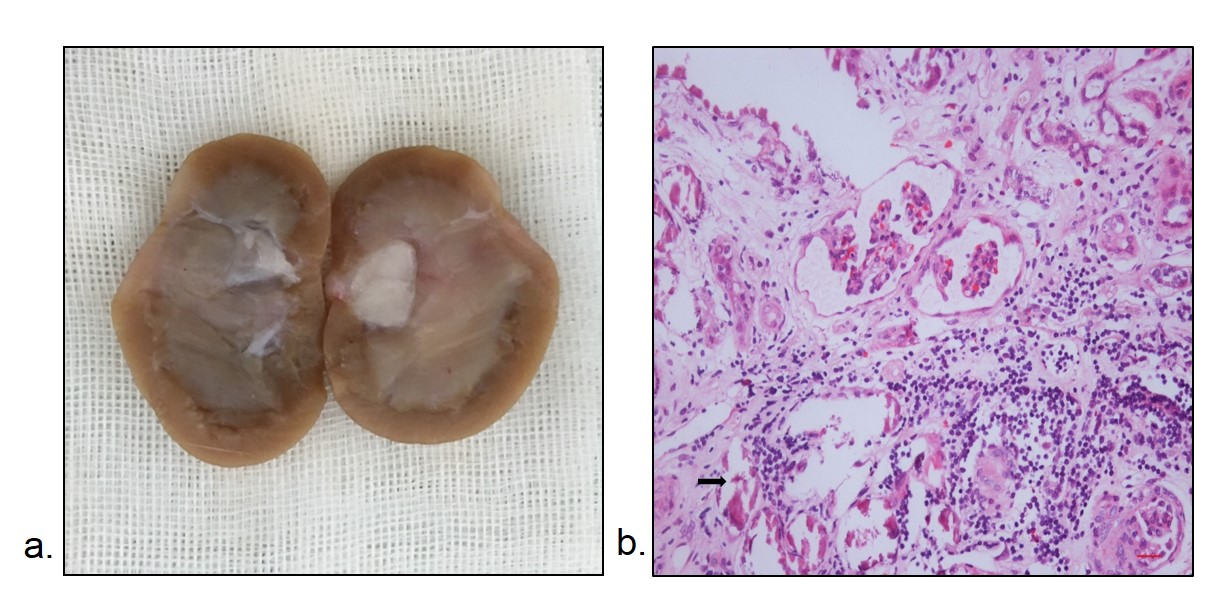
Figure 4. The (a) resected
renal specimen and (b) pathological results obtained two weeks later. Ischemic
and wrinkled features with dilated change of Bowman‘s capsule;
abscission of the epithelial cells and tubular ectasia
and cellular debris (arrowheads); lamellar
inflammatory cells infiltrating in renal interstitium.