1895
Perfusion decrease during radiochemotherapy is not fully explained by volumetric gray matter changes1PET center, Institute of Radiopharmaceutical Cancer Research, Helmholtz-Zentrum Dresden-Rossendorf, Dresden, Germany, 2Brain Sciences Research Program, Sunnybrook Research Institute, Toronto, Canada, 3Department of Radiology, Academic Medical Center, Amsterdam, Netherlands, 4Rochester Institute of Technology, Rochester, NY, United States, 5Department of Radiology, Leiden University Medical Center, Leiden, Netherlands, 6Department of Radiology, University Hospital Carl Gustav Carus, Technical University Dresden, Dresden, Germany, 7Department of Radiation Oncology, Faculty of Medicine and University Hospital Carl Gustav Carus, Technical University Dresden, Dresden, Germany, 8OncoRay – National Center for Radiation Research in Oncology, Faculty of Medicine and University Hospital Carl Gustav Carus, Dresden, Germany, 9German Cancer Consortium (DKTK), Dresden, Germany, 10German Cancer Research Center (DKFZ), Heidelberg, Germany, 11Institute of Radiooncology, Helmholtz-Zentrum Dresden-Rossendorf, Dresden, Germany, 12Department of Nuclear Medicine, University Hospital Carl Gustav Carus, Technical University Dresden, Dresden, Germany
Synopsis
Radiochemotherapy in brain-tumor patients was shown to cause gray matter (GM) volume and cerebral blood flow (CBF) changes. The interaction of these two effects, however, remains unclear. Here, we investigated GM volume and ASL CBF changes and their interaction in the healthy hemisphere of 38 glioblastoma patients undergoing radiochemotherapy with Temozolomide. We found a statistically significant CBF decrease with dependence on the RT-dose. PV-corrected results indicated that, while to a certain extent the apparent CBF decrease measured by ASL is caused by GM atrophy, there still remain significant CBF changes that cannot be explained by structural changes alone.
Introduction
While introduction of radiochemotherapy (RCT) with Temozolomide can greatly increase the survival rate in patients with glioblastoma multiforme1, studies have shown that it has, however, non-negligible side-effects that can potentially cause structural2,3 and functional4,5 damage in the remaining healthy brain tissue. Recently, cerebral blood flow (CBF) decrease measured with arterial spin labeling (ASL) was reported following RCT in glioblastoma patients4. Likewise, RCT was shown to cause gray matter (GM) volume loss in glioblastoma5 and high-grade glioma6 patients. This change in GM volume can bias the analysis of ASL data, which relies on volumetric tissue information to provide an unbiased quantitative measurement of pure GM-CBF (CBFGM). Studies of healthy aging have shown that structural GM changes can, through partial volume effects, mimic CBF decrease in the absence of actual GM hypoperfusion7,8. Methods for partial volume (PV)-correction have been developed and often used to prevent such bias. Separation of structural (GM atrophy) and functional (CBFGM decrease) changes in healthy tissue following RCT might be important for studying the underlying mechanism of the changes as well as the direct consequences. In this study, we have investigated GM volume changes and CBFGM changes and their interaction in the healthy hemisphere of glioblastoma patients undergoing RCT with Temozolomide.Methods
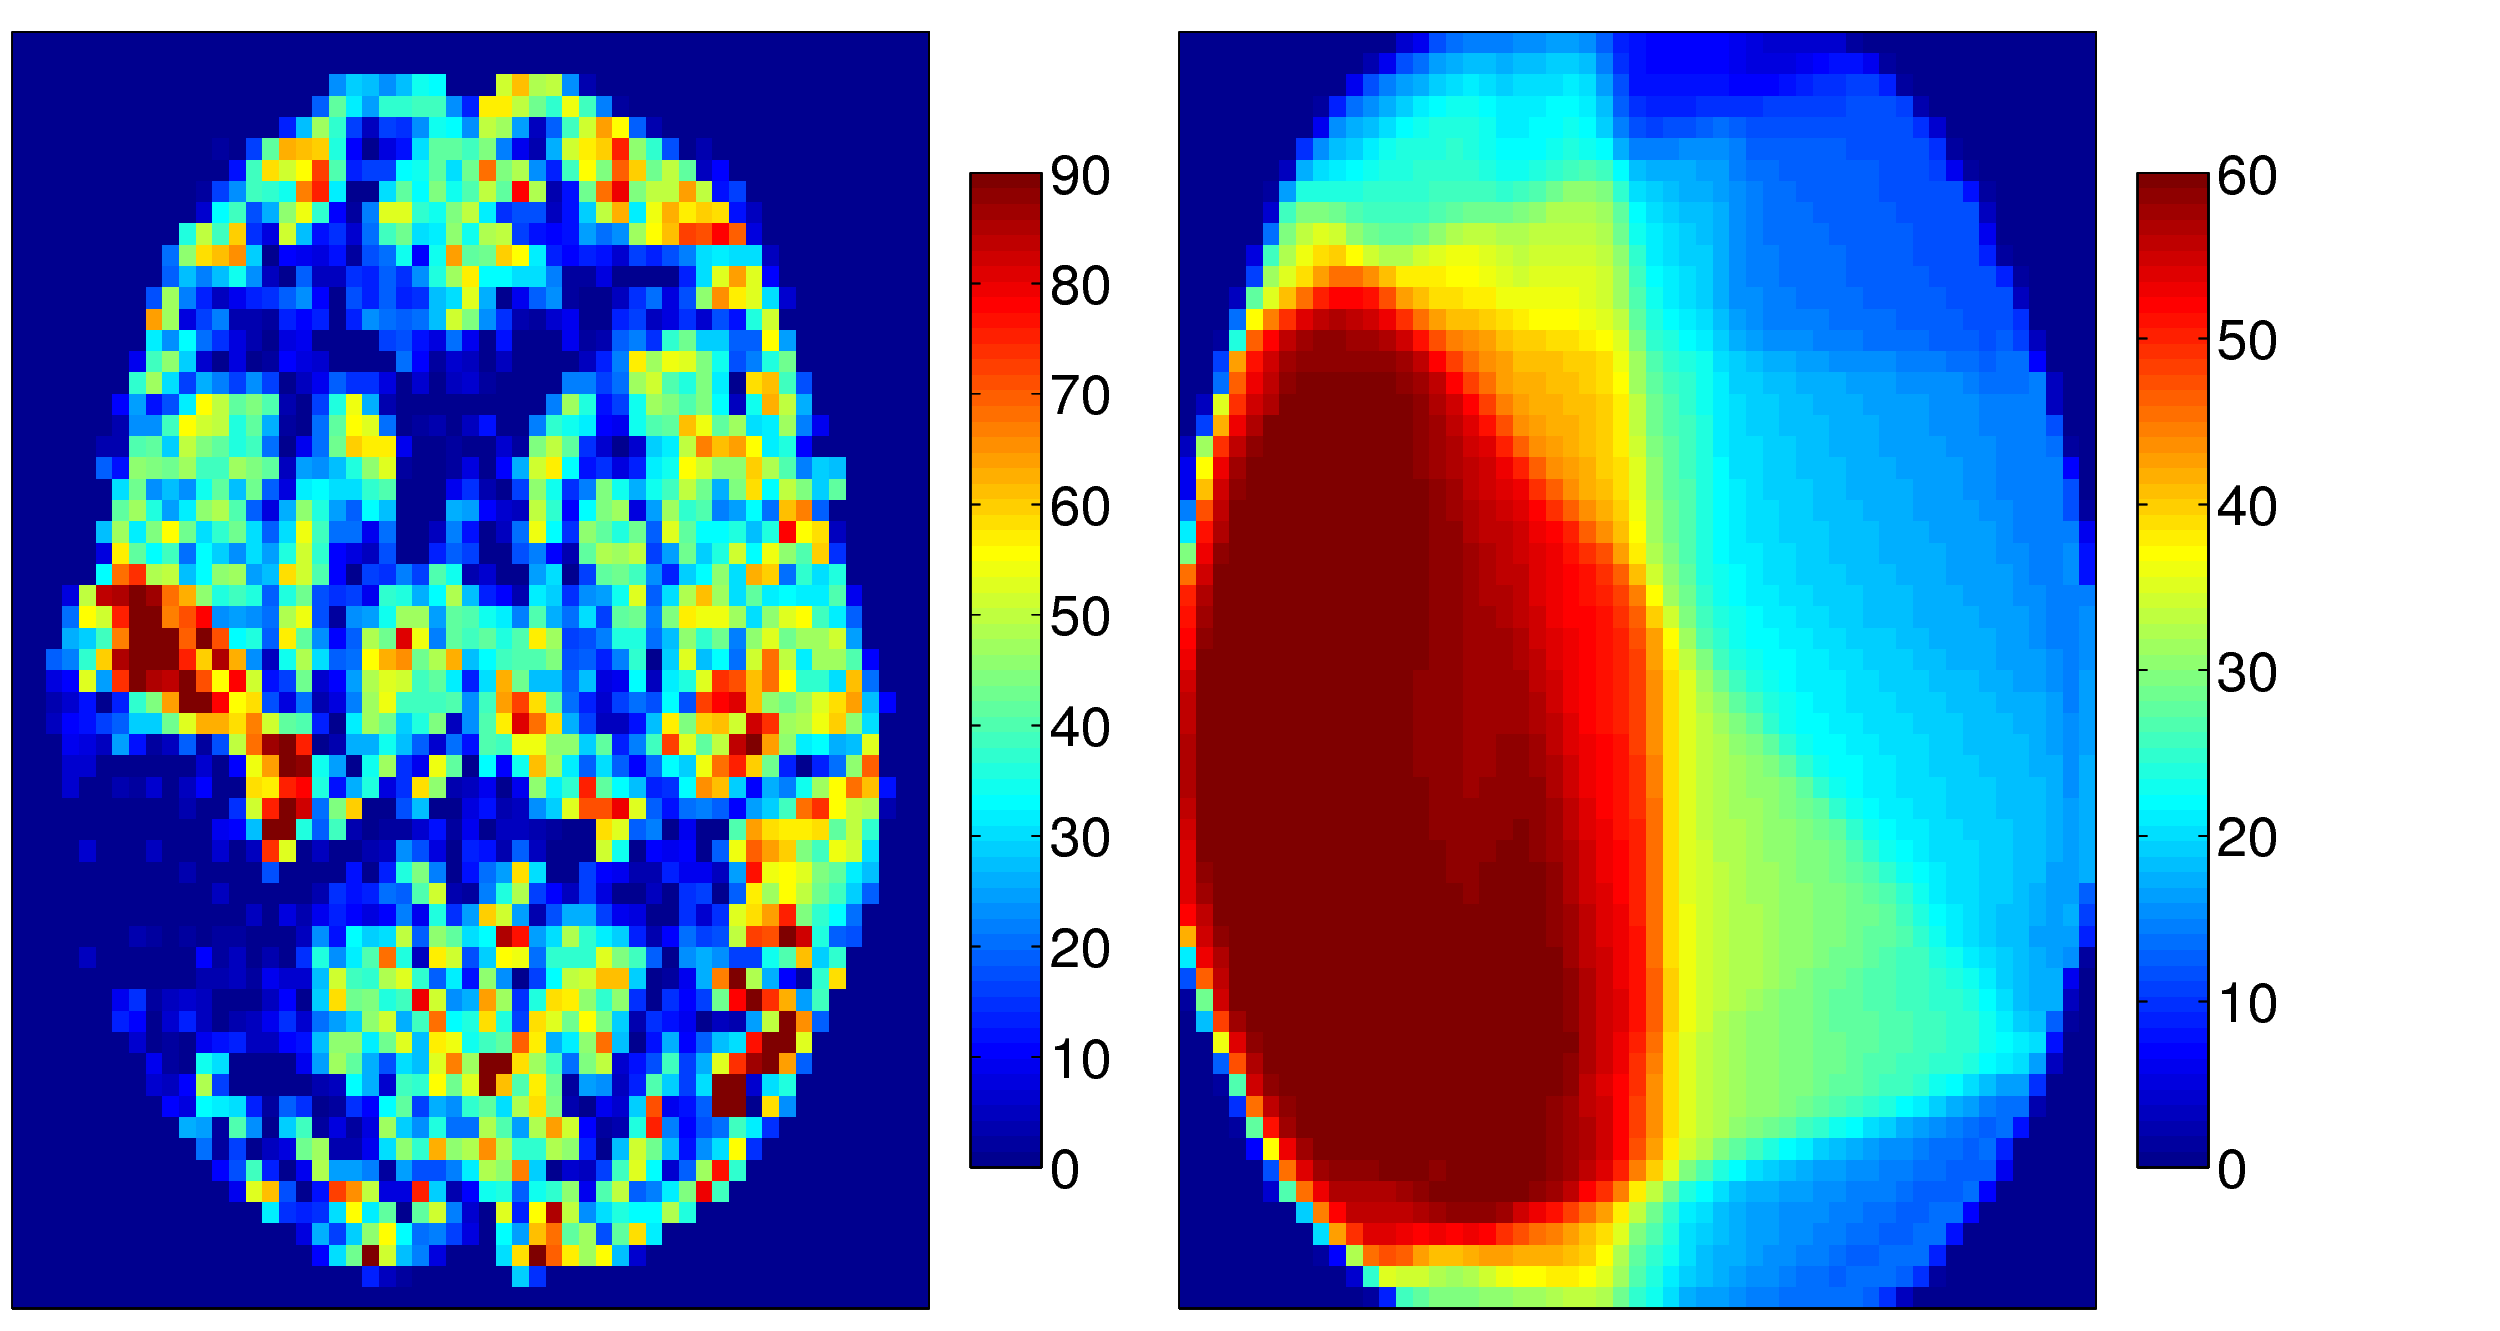
Thirty-eight patients (mean age 54.0±13.7 years) with unilateral glioblastoma multiforme were studied. Intensity modulated radiation therapy (6 weeks, 2 Gy fractions 5 days/week) with concomitant Temozolomide chemotherapy (75 mg/m2) and 6 months of adjuvant Temozolomide (150 mg/m2) was delivered to all patients1. 3D T1-weighted and pseudo-continuous ASL (pCASL) images were acquired on a 3T Philips Ingenuity MR. Parameters of pCASL were: 2D EPI readout, voxel size 2.75x2.75x6 mm3, 17 slices (0.6 mm gap), TR/TE 3765/11 ms, 30 averages, background suppression, labeling time 1650 ms, post-labeling delay (first-last slice range) 1525-2037 ms. A reference M0 image was acquired 5000 ms after saturation. 3D-TFE (Turbo Field Echo) T1-w images were acquired with 1 mm isotropic resolution. First session was after tumor resection, but before RCT with two follow-ups in 3-months intervals after the RCT end. Data were processed using Matlab and the SPM12 toolbox. pCASL images were motion corrected, quantified using the single-compartment model10, and co-registered with the T1-w image. The T1-w images were segmented to GM and white matter (WM) posterior probability maps and used to estimate the pGM and pWM PV-fractions in the pCASL space. T1-w images, and the RT-dose plans were co-registered to the T1-w image of the first session for each patient (Figure 1). PV-correction of the CBF images was performed using the linear regression method by Asllani et al. with a 7x7x3 voxel kernel9. Mean CBFGM changes in the healthy hemisphere contralateral to the tumor were calculated for a pGM>70% region of interest (ROI) with/without PV-correction. The CBFGM changes were also assessed regionally according to the received RT-dose with division to 0-10-20-30-60 Gy. The mean CBFGM change relative to the first session was calculated for the second and third session. The significance of the change was assessed using a paired t-test.Results
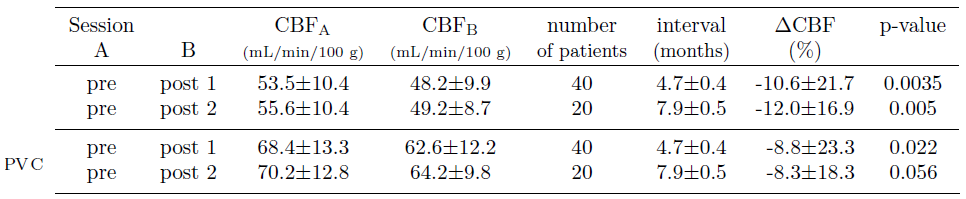
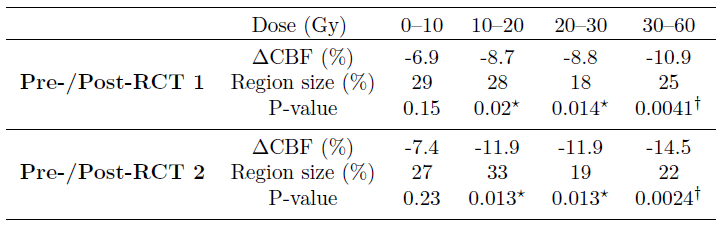
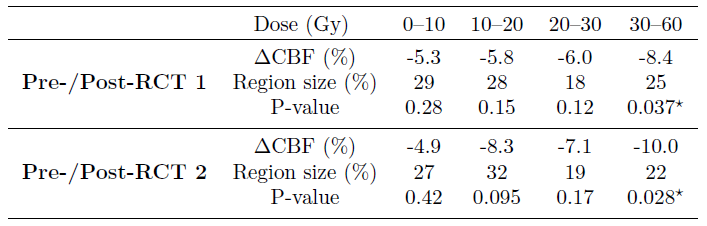
The CBF decrease following RCT was 10.6-12.0 % for the PV-uncorrected data and 8.3-8.8% when PV-correction was applied (Table 1). CBF decreased in all regions with a RT-dose higher than 10 Gy (p<0.02 for all, Table 2). The CBF decrease in the high-dose regions was 58% and 96% higher than in the low dose region on the first and second post-RCT session, respectively. For PV-corrected CBF, the difference between low-dose and high dose was comparable: 58% and 104% respectively (Table 3). However, the difference from the first session was only statistically significant (p<0.05) for the high-dose regions.Discussion and conclusions
We have shown a statistically significant CBF decrease around 10% at 3/6 months after the RCT end compared to the pre-therapy baseline. This CBF decrease was 50-100% higher for high RT-dose regions compared with the low RT-dose regions. This result could be tentatively interpreted as a combination of whole-brain CBF decrease caused by chemotherapy with an additional CBF decrease caused by received RT-dose ‒ hence a cumulative effect of radio- and chemo-therapy. The PV-correction reduced the CBF decrease by 17-30%, implying that, while to a certain extent the apparent CBF decrease measured by ASL was caused by GM atrophy, still functional CBFGM changes remained that cannot be explained by structural changes. The dependence of the CBFGM decrease on RT-dose seemed also to be independent of structural GM changes. The results of this study show that investigation of volumetric GM changes together with PV-uncorrected and PV-corrected changes can help to differentiate structural from functional effects.Acknowledgements
No acknowledgement found.References
1. Stupp, R., Mason, W. P., van den Bent, M. J., Weller, M., Fisher, B., Taphoorn, M. J. B., … Mirimanoff, R. O. Radiotherapy plus concomitant and adjuvant temozolomide for glioblastoma. The New England Journal of Medicine. 2005; 352(10):987–96.
2. Prust, M. J., Jafari-Khouzani, K., Kalpathy-Cramer, J., Polaskova, P., Batchelor, T. T., Gerstner, E. R., & Dietrich, J. Standard chemoradiation for glioblastoma results in progressive brain volume loss. Neurology. 2015; 85(8):683–691.
3. Karunamuni, R. A., Moore, K. L., Seibert, T. M., Li, N., White, N. S., Bartsch, H., … Hattangadi-Gluth, J. A. Radiation sparing of cerebral cortex in brain tumor patients using quantitative neuroimaging. Radiotherapy and Oncology. 2016; 118(1):29–34.
4. Wenz, F., Rempp, K., Hess, T., Debus, J., Brix, G., Engenhart, R., … Wannenmacher, M. Effect of radiation on blood volume in low-grade astrocytomas and normal brain tissue: quantification with dynamic susceptibility contrast MR imaging. AJR. 1996; 166(1):187–93.
5. Fuss, M., Wenz, F., Scholdei, R., Essig, M., Debus, J., Knopp, M. V, & Wannenmacher, M. (2000). Radiation-induced regional cerebral blood volume (rCBV) changes in normal brain and low-grade astrocytomas: quantification and time and dose-dependent occurrence. International Journal of Radiation Oncology*Biology*Physics. 2000; 48(1):53–58.
6. Petr, J., Platzek, I., Seidlitz, A., Mutsaerts, H. J. M. M., Hofheinz, F., Schramm, G., … van den Hoff, J. Early and late effects of radiochemotherapy on cerebral blood flow in glioblastoma patients measured with non-invasive perfusion MRI. Radiotherapy and Oncology. 2016; 118(1):24–8.
7. Chen, J. J., Rosas, H. D., and Salat, D. H. Age-associated reductions in cerebral blood flow are independent from regional atrophy. NeuroImage. 2011; 55(2):468–78.
8. Asllani, I., Habeck, C., Borogovac, A., Brown, T. R., Brickman, A. M., and Stern, Y. Separating function from structure in perfusion imaging of the aging brain. Human Brain Mapping. 2009; 30(9):2927–35.
9. Asllani, I., Borogovac, A., & Brown, T. R. Regression algorithm correcting for partial volume effects in arterial spin labeling MRI. Magnetic Resonance in Medicine. 2008; 60(6):1362–71.
10. Alsop, D. C., Detre, J.A., Golay, X., Günther, M., Hendrikse, J., Hernandez-Garcia, L., Hanzhang, L., MacIntosh, B.J., Parkes, L. M., Smits, M., van Osch, M. J. P., Wang, D. J. J., Wong, E. C., Zaharchuk, G. Recommended implementation of arterial spin-labeled perfusion MRI for clinical applications: A consensus of the ISMRM perfusion study group and the European consortium for ASL in dementia. Magnetic Resonance in Medicine. 2015; 73(1):102-16.
Figures