1894
3-Dimensional cerebral blood flow and transit time mouse brain mapping using Dynamic Arterial Spin Labeling (DASL)1Grenoble Institut des Neurosciences, Université Grenoble Alpes, Grenoble, France, 2Inserm U1216, Grenoble, France, 3Bruker Biospin, Ettlingen, Germany
Synopsis
Measuring the arterial transit time (ATT) helps for the optimization and quantification of arterial spin labeling experiments. Moreover, ATT may provide information on potential underlying vascular pathologies. In preclinical perfusion studies, multiple 2D-slices are commonly acquired to measure perfusion. However, this readout limits the number of slices for which ATT can be measured accurately in rodents. In this study, we implemented and optimized a dynamic ASL labeling scheme with a 3D echo planar imaging (EPI) readout to simultaneously map cerebral blood flow, arterial transit time and tissue T1 in the mouse brain at 9.4T.
Introduction
Measuring the arterial transit time (ATT), i.e. the time it takes for the blood to travel from the labeling slice to the tissue of interest, helps for the optimization and quantification of perfusion measurement by means of arterial spin labeling (ASL)1. Moreover, ATT may provide information on potential underlying vascular pathologies2.
In preclinical perfusion studies, multiple 2D-slices are commonly acquired to measure perfusion3,4,5. However, this readout limits the number of slices for which ATT can be measured accurately in rodents: the time it takes to acquire all slices (~30ms/slice) rapidly exceeds the short ATTs, which are around 100ms in healthy mice5. Thus, accurate blood arrival sampling becomes difficult for the last acquired slices. A 3D-readout is therefore particularly interesting, since it allows for having the same postlabeling delay (PLD) for all acquired slices, without any additional delay due to the acquisition order.
In this study, we implemented and optimized a dynamic ASL labeling scheme6,7 with a 3D echo planar imaging (EPI) readout to simultaneously map CBF, ATT and tissue T1 (T1t) in the mouse brain. Then, we applied the developed sequence on a mouse model of schizophrenia to evaluate the effect of knocking-out (KO) the microtubule-associated protein 6 (MAP6) – a protein that has been shown to play a critical role during the development of cerebral axonal tracts8- on ATT and CBF.
Methods
Experiments were performed on a 9.4T horizontal scanner (Bruker Biospec, AVIII-HD) with a 86mm-volume coil for excitation and a 4-channel cryoprobe surface coil for reception. Mice were anesthetized using isoflurane (1.5-2%) in air:O2 70:30%. Two groups of C57Bl6/129Sv male mice (n=4/group) were studied: a wild type (WT) group and a group for which MAP6 was knocked out (KO).
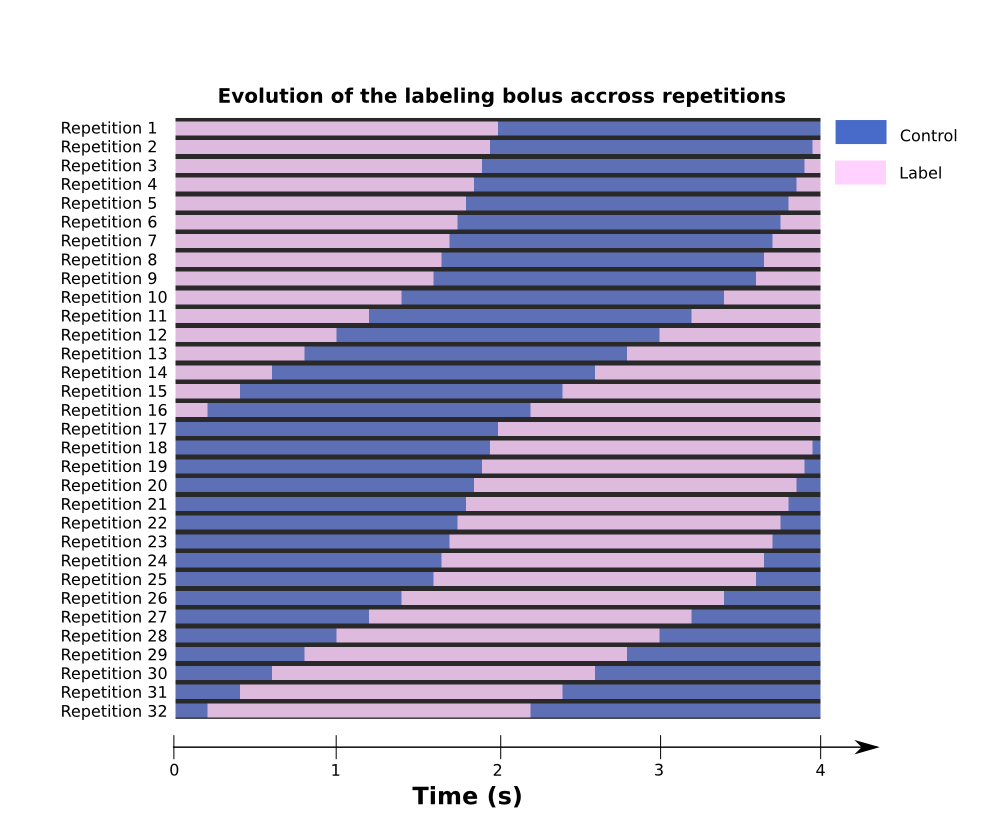
Unbalanced pCASL labeling pulses were applied in the mice’s neck (at -12mm from the isocenter) during 4s following the DASL scheme shown on Fig.1. This scheme is optimized to sample the signal with high accuracy (50ms temporal resolution) around the blood arrival time (i.e.between 0-0.4s and 2-2.4s) and with lower temporal resolution (200ms) during the capillary blood filling (i.e.from 0.4-2s and 2.4-4s).
The labeling pulses consisted of Hanning window shaped RF pulses with an average amplitude of 5μT, duration of 400μs, repeated every 800μs, with optimized phases. Gmax/Gave was set to 90/10 mT/m. Image acquisition was performed through single-shot EPI: TE/TR=4000/22ms, resolution=0.2*0.2*1.6 mm3, number of slices=10, Tacq=22min. For CBF-quantification, the labeling efficiency was measured 4mm downstream the labeling plane with a flow-compensated, ASL-encoded FLASH.
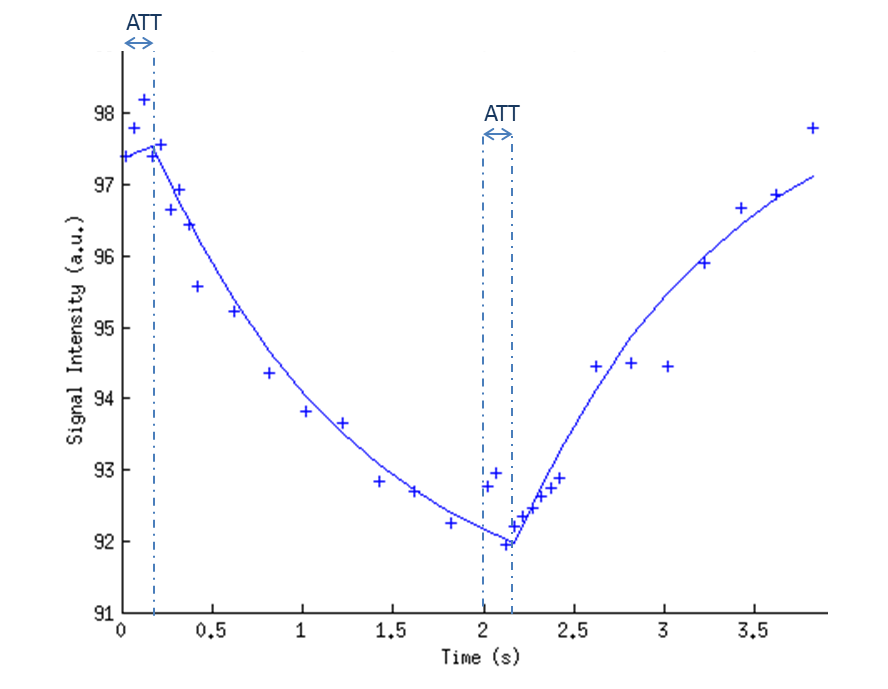
The signal time-course from the DASL experiment was fitted voxel-by-voxel to the model described by Barbier et al6,7 (Fig.2) to obtain quantitative CBF, ATT and T1t maps. ROIs were manually drawn in four brain regions.
Results and discussion
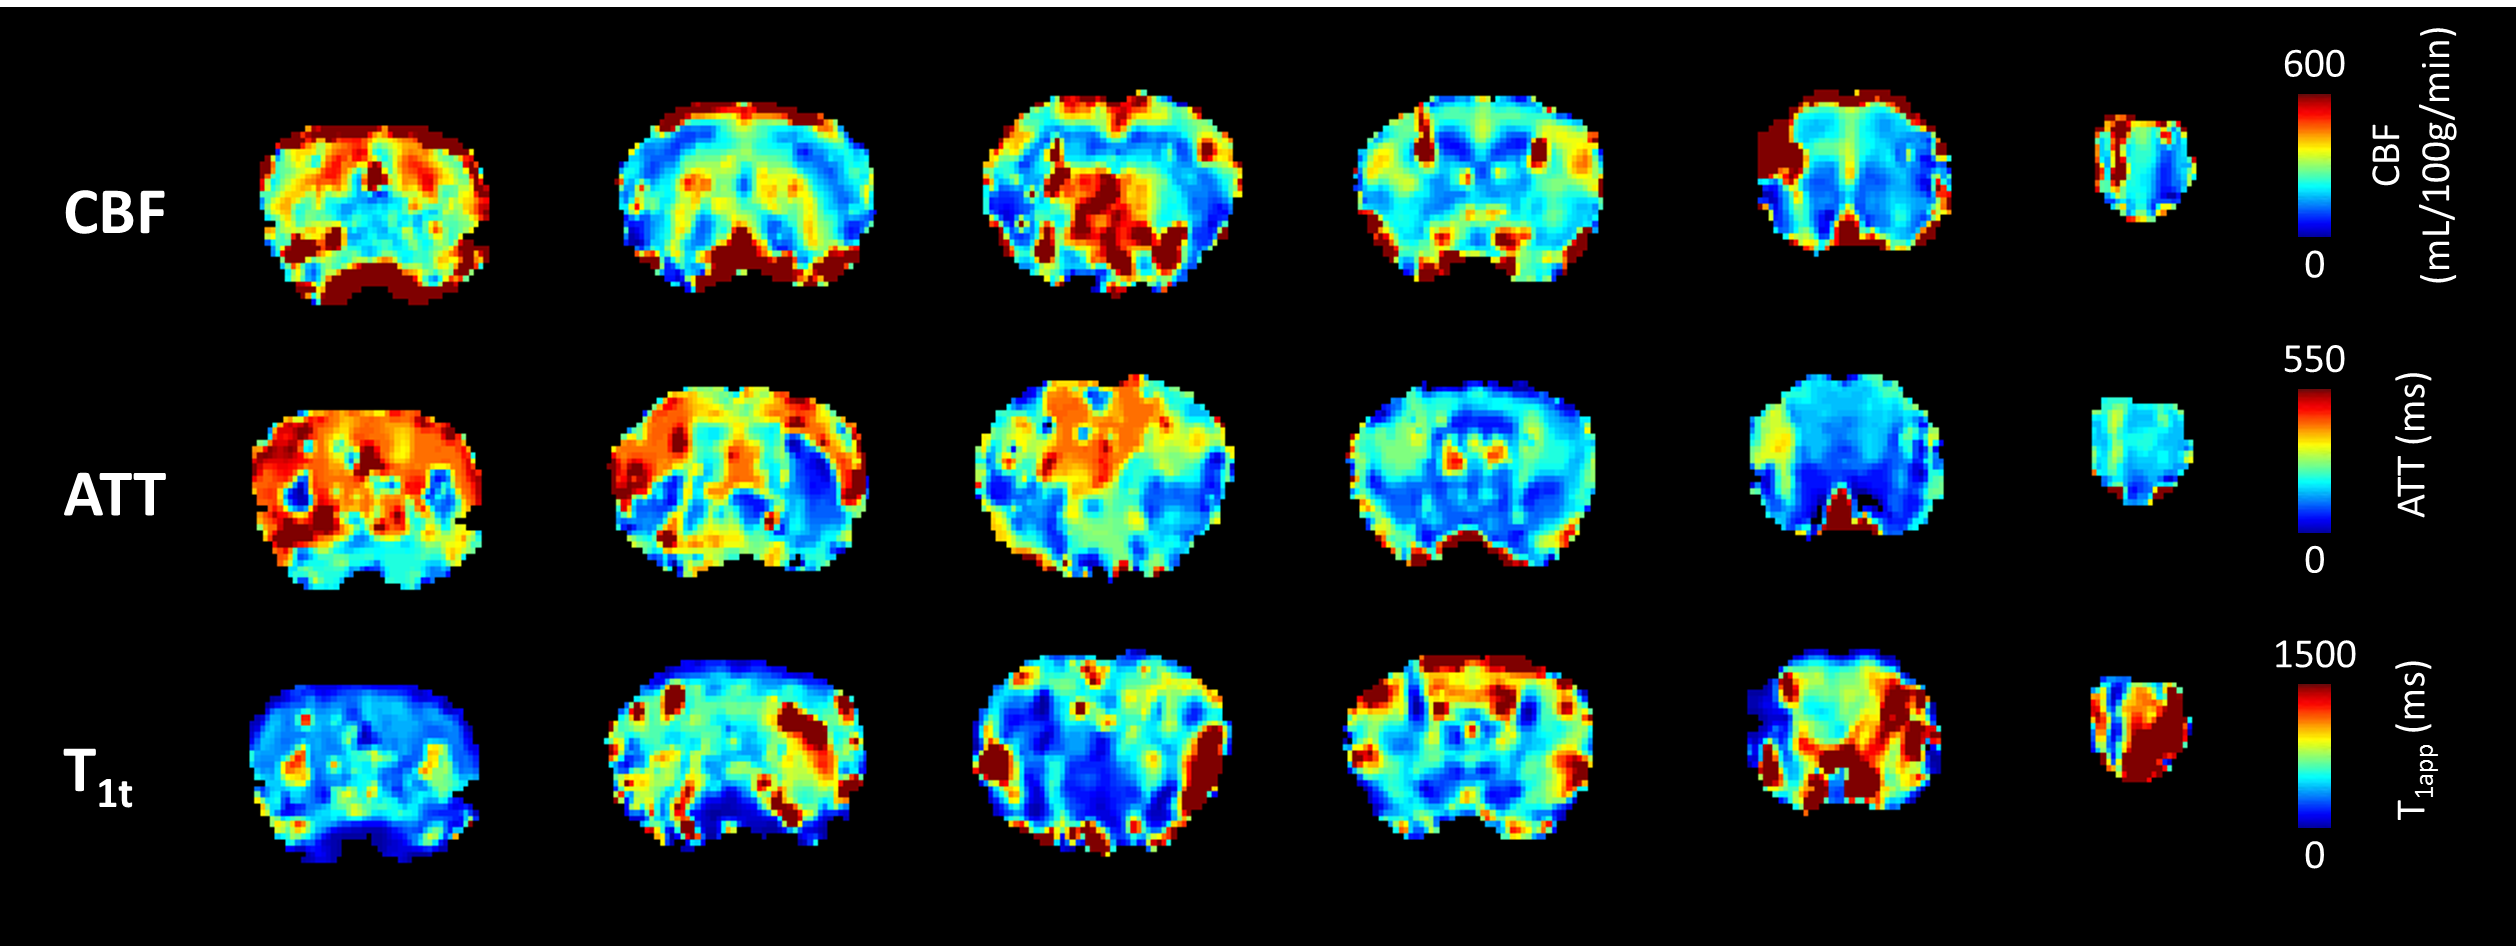
Fig.3 shows examples of CBF, ATT and T1t maps obtained from a 3D-DASL-EPI experiment. The observed contrast in the CBF maps is as expected, with higher cortical and thalamic perfusion values compared to white matter. Although the quantitative CBF values (Fig.4a) are much higher than that acquired with standard, 2D, pCASL3,5, they are in the range of those measured with an Hadamard-encoded ASL scheme5: in WT mice we measured an average brain CBF of 350±128mL/100g/min. ATT values (246±80ms on average, Fig.4b) are also in the same range as the one previously reported5 and the regional variations are similar, with lower hippocampal transit times compared to other grey matter structures (cortex, thalamus and striatum). For all slices, T1t (811±282ms on average in the brain, Fig.4c) is lower than the expected tissue T1 (i.e. 1.7s at 9.4T). This low T1t may be ascribed to the presence of intravascular signal in our time-encoded ASL approach (inflow and outflow effects). This intravascular signal and short T1t may explain the high CBF values. Contrary to time-encoded measurements performed on humans (with longer transit times), short ATT values in rodents induce more intravascular signal and require a finer temporal sampling.
In our study, the WT and KO mice showed similar CBF and ATT values (Fig.4a and b). The WT/KO variability (i.e. SD/mean) on CBF and ATT was 5 and 7%, respectively, suggesting a reproducible approach.
Conclusion
This study shows the successful implementation of 3D-DASL-EPI in mice. The obtained preliminary results are promising, since the ATT and CBF values are in good agreement with those previously observed in mice with Hadamard-encoded-ASL. T1t appears to be higher than expected. Therefore, the use of a separate T1 map could produce more precise and more robust CBF maps. Finally, the previous limitation to ~3 2D-slices has been overcome with an optimized 3D-readout that allows for measuring the desired number of slices.Acknowledgements
Grenoble MRI facility IRMaGe was partly funded by the French program “Investissement d’Avenir” run by the ‘Agence Nationale pour la Recherche’; grant 'Infrastructure d’avenir en Biologie Santé' - ANR-11-INBS-0006.References
(1) Alsop DC, Detre JA, Golay X, Günther M, Hendrikse J, Hernandez-Garcia L, Lu H, Macintosh BJ, Parkes LM, Smits M, et al. 2014. Recommended implementation of arterial spin-labeled perfusion MRI for clinical applications: A consensus of the ISMRM perfusion study group and the european consortium for ASL in dementia. Magn Reson Med 116:102–116.
(2) Hendrikse J et al.; Internal carotid artery occlusion assessed at pulsed arterial spin-labeling perfusion MR imaging at multiple delay times. Radiology. 2004 Dec;233(3):899-904.
(3) Duhamel G, Callot V, Tachrount M, Alsop DC, Cozzone PJ. 2012. Pseudo-continuous arterial spin labeling at very high magnetic field (11.75 T) for high-resolution mouse brain perfusion imaging. Magn. Reson. Med. 67:1225–36.
(4) Debacker CS, Daoust A, Köhler S, Voiron J, Warnking JM, Barbier EL. 2016. Impact of tissue T 1 on perfusion measurement with arterial spin labeling. Magn. Reson. Med. 0:1–9.
(5) Hirschler L, Munting LP, Teeuwisse WM, Suidgeest E, Warnking JM, van Osch MJP, Barbier EL, and van der Weerd L. 2016. Transit time mapping in the mouse brain using time-encoded pCASL. In: Proceedings of the ISMRM 24th Annual Meeting, Singapore.
(6) Barbier EL, Silva AC, Kim HJ, Williams DS, Koretsky AP. 1999. Perfusion analysis using dynamic arterial spin labeling (DASL). Magn. Reson. Med. 41:299–308.
(7) Barbier EL, Silva AC, Kim SG, Koretsky AP. 2001. Perfusion imaging using dynamic arterial spin labeling (DASL). Magn. Reson. Med. 45:1021–1029.
(8) Deloulme, J.C et al. Microtubule-associated protein 6 mediates neuronal connectivity through Semaphorin 3E-dependent signalling for axonal growth. Nat. Commun. 6:7246 doi: 10.1038/ncomms8246 (2015).
Figures