1893
Multiphase pseudo-continuous ASL to image cerebral blood flow in mice at 9.4T1Oxford Institute for Radiation Oncology, Department of Oncology, University of Oxford, Oxford, United Kingdom, 2Institute of Biomedical Engineering, Department of Engineering Science, University of Oxford, Oxford, United Kingdom
Synopsis
Pseudo-continuous arterial spin labelling is regarded as the gold standard for clinical ASL, and can be improved in humans using multiphase sequences, but has not previously been implemented in mice. A multiphase pseudo-continuous ASL sequence to measure cerebral blood flow in mice was successfully implemented using respiratory triggering and optimisation of imaging readout, tag placement, labelling bolus duration, and post-label delay. Multiphase pseudo-continuous ASL is sensitive to changes in perfusion in an intracerebral glioma model.
Introduction
Pseudo-continuous arterial spin labelling (pCASL) has been recommended as the gold standard for clinical ASL1. Many challenges exist in the adaptation of pCASL in mice, including faster blood velocity, smaller brain size, proximity of blood vessels, susceptibility artefacts, and B0 inhomogeneities. A previous implementation of pCASL to measure cerebral blood flow (CBF) in mice showed advantages over pulsed ASL, but also showed a loss of inversion efficiency due to phase errors2. The use of multiphase pCASL (MP-pCASL) has been shown to reduce these errors in humans3, but this sequence has not yet been implemented in mice. This study represents a first attempt to adapt MP-pCASL to image CBF in mice.Methods
MP-pCASL experiments were performed on isofluorane anaesthetised mice (n=4 naïve female BALB/c; n=3 female SCID injected intracerebrally with U87 glioma cells) using a 9.4T MRI spectrometer (Agilent) with a 26mm diameter volume transmit-receive coil (Rapid Biomedical). T1 and T2 maps, angiography, and anatomical scans were acquired. The MP-pCASL scan was acquired with FOV=20x20mm (64x64 matrix, slice thickness=1mm), TE=19.45ms, a labelling bolus consisting of a train of 600μs 40° Hanning-shaped pulses every 1.2 ms, with phase arrayed between 0˚ and 315˚, each 45˚ apart, followed by an echo-planar imaging (EPI) readout. Parameters varied to optimise the imaging readout were TR (1-4s), spin-echo excitation, number of shots, and respiratory triggering. Eight slices were acquired posterior to the olfactory sulcus. The parameters varied to optimise MP-pCASL were TR (4-7.6s, dependent on bolus duration), labelling bolus duration=0.4-5s, and post-label delay (0.01-1s). MP-pCASL data from eight phases were fit to a modified Fermi function using BASIL before processing with oxford_asl4. Reference scans acquired without tagging were used for absolute quantitation of CBF.Results
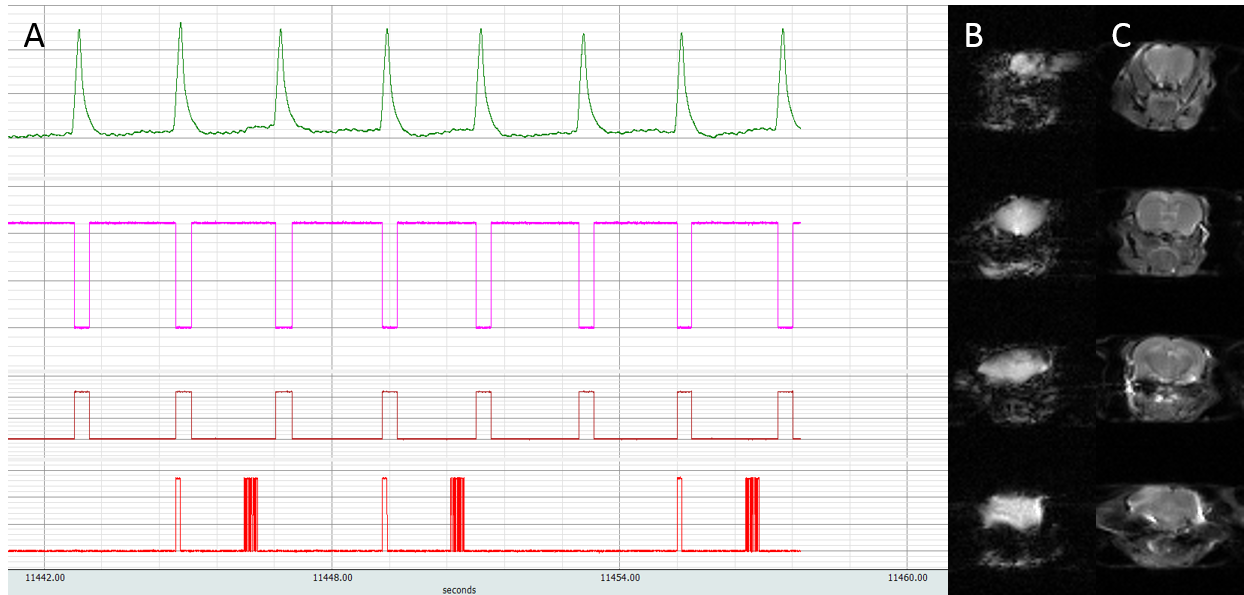
The EPI readout was optimised (Figure 1) as a spin-echo scan with a TR=4s to maximise SNR and tissue contrast. A 2-shot sequence was determined to be optimal for reducing image distortion within a reasonable scan time. Respiratory triggering whereby the imaging readout was acquired during the plateau phase of respiration, was found to reduce signal fluctuation at the base of the brain. Finally, a variable post-trigger delay was implemented to allow adjustment for changing respiration rates in subsequent scans.
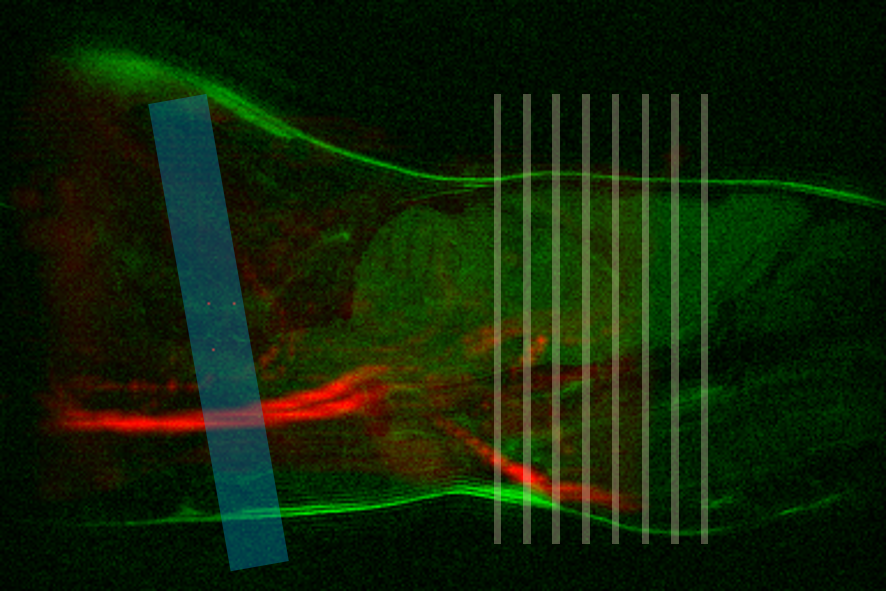
For the MP-pCASL a tagging plane positioned at 10° relative to the coronal plane was optimal as this was perpendicular to the major vessels, and posterior to the vertebral flexure. Tag placement just posterior to the medulla oblongata enabled consistent tag placement between animals (Figure 2). A 2mm tag thickness was chosen as it provided the maximum labelling efficiency.
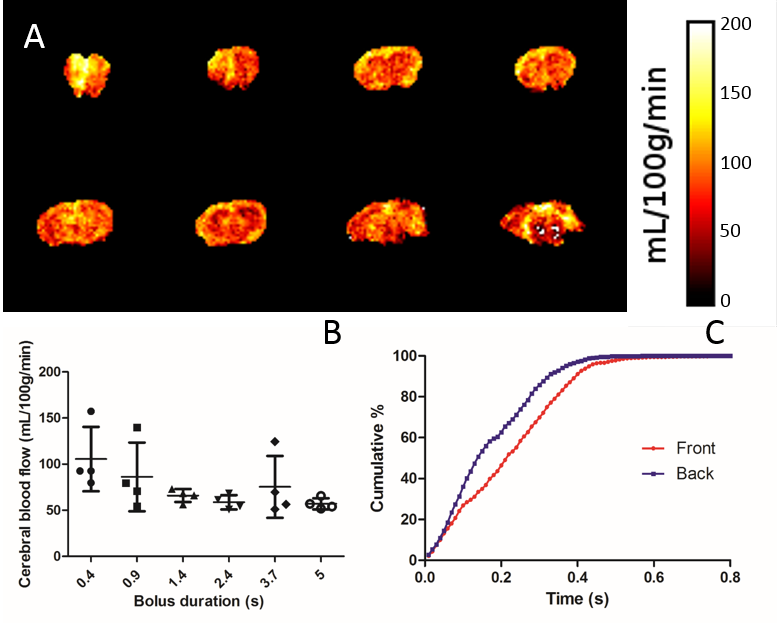
To measure bolus arrival time, 12 post-label delays from 10ms to 1s were acquired. Cumulative arrival maps showed that the bolus arrived at over 95% of voxels in the front slice, and at 99% of voxels in the back slice within 0.4s (Figure 3). Thus, 0.4s was chosen as the optimal post-label delay to reduce signal loss from relaxation. Labelling bolus duration was also optimised, with a short bolus of 0.4s producing overly high CBF values with substantial variability. Longer bolus durations produced more reasonable results, on average 86±22mg/100mL/min across the whole brain, with proportionally less variability (Figure 3). To minimise scan time whilst producing consistent CBF values, 0.9s was chosen as the optimal bolus duration.
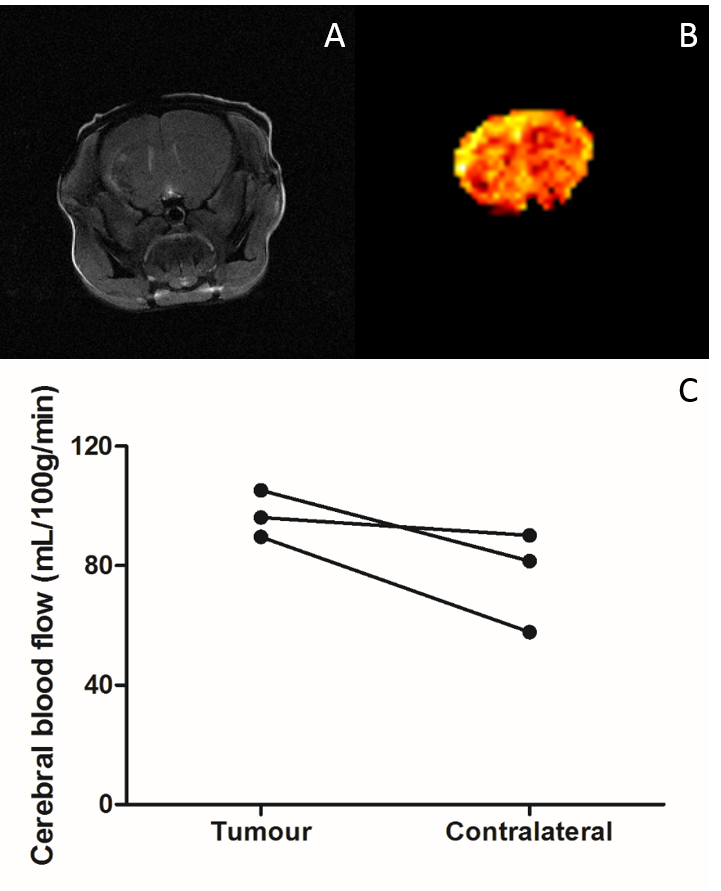
Application of these parameters to mice with intracerebral U87 glioma tumours (Figure 4) showed a trend (p=0.11) towards increased perfusion in the tumour area (97±15mg/100mL/min) compared to the contralateral striatum (76±18mg/100mL/min).
Discussion
pCASL is the gold standard ASL sequence for clinical use, and multiphase sequences have many advantages in reducing off resonance effects. Despite these advantages, no studies have implemented multiphase pCASL in mice. Here we have shown that MP-pCASL can produce CBF maps in mice which show similar perfusion values to published values. It has also shown that the sequence is sensitive to differences in perfusion in a brain tumour model. The implementation of this sequence in mice is advantageous to the study of disorders of perfusion, as it provides a more robust and reliable method of measuring CBF than non-multiphase ASL models. Optimisation of parameters in mice will also ensure that imaging biomarkers developed in mouse models are translatable to the clinic. Work to validate the CBF measurements using autoradiography as a gold standard is ongoing. Moreover, there are additional recommendations in the clinical white paper that could be further implemented in the future, including background suppression and a 3D readout.Conclusion
Multiphase pCASL has been successfully implemented for imaging
CBF in mice, and is sensitive to changes in perfusion in an
intracerebral tumour model. Acknowledgements
Robert Westphal, Sean Smart, Paul Kinchesh, Stuart GilchristReferences
1 Alsop, D. C. et al. Recommended implementation of arterial spin-labeled perfusion MRI for clinical applications: A consensus of the ISMRM perfusion study group and the European consortium for ASL in dementia. Magnetic Resonance in Medicine 73, 102-116, doi:10.1002/mrm.25197 (2015). 2 Duhamel, G., Callot, V., Tachrount, M., Alsop, D. C. & Cozzone, P. J. Pseudo-continuous arterial spin labeling at very high magnetic field (11.75 T) for high-resolution mouse brain perfusion imaging. Magnetic Resonance in Medicine 67, 1225-1236, doi:10.1002/mrm.23096 (2012). 3 Jung, Y., Wong, E. C. & Liu, T. T. Multiphase pseudocontinuous arterial spin labeling (MP-PCASL) for robust quantification of cerebral blood flow. Magnetic Resonance in Medicine 64, 799-810, doi:10.1002/mrm.22465 (2010). 4 Chappell, M. A., Groves, A. R., Whitcher, B. & Woolrich, M. W. Variational Bayesian Inference for a Nonlinear Forward Model. IEEE Transactions on Signal Processing 57, 223-236, doi:10.1109/tsp.2008.2005752 (2009).Figures