1892
Combined 3D perfusion and diffusion MRI to phenotype the mouse brain: evaluation and application to a model of schizophrenia1Grenoble Institut des Neurosciences, Université Grenoble Alpes, Grenoble, France, 2INSERM U1216, Grenoble, France, 3Bruker Biospin, Ettlingen, Germany, 4NeuroSpin, CEA Saclay, Gif-sur-Yvette, France
Synopsis
Perfusion and diffusion imaging both represent powerful tools in order to phenotype mouse models of brain diseases. Indeed, imaging cerebral blood flow (CBF) may be seen as a surrogate marker of brain metabolism while diffusion imaging provides the structural aspects of brain wiring. To evaluate the potential of combined CBF/Diffusion phenotyping, we evaluated the effect of knocking-out (KO) the microtubule-associated protein 6 (MAP6), which plays a critical role during the development of cerebral axonal tracts. Experiments were performed on homogeneous C57Bl6/129Sv mice using 3D pseudo-continuous Arterial Spin Labeling (pCASL) and 3D diffusion tensor imaging (DTI) at 9.4T.
Purpose
To phenotype mouse models of brain diseases, perfusion and diffusion imaging both represent powerful tools: they do not require the use of contrast agents and provide quantitative, complementary, metrics. Indeed, imaging cerebral blood flow (CBF) may be seen as a surrogate marker of brain metabolism while diffusion imaging provides the structural aspects of brain wiring. To evaluate the potential of combined CBF/Diffusion phenotyping, we first optimized this protocol on C57Bl6 mice and then evaluated the effect of knocking-out (KO) the microtubule-associated protein 6 (MAP6), which has been shown to play a critical role during the development of cerebral axonal tracts [1]. Experiments were performed on homogeneous C57Bl6/129Sv mice using 3D pseudo-continuous Arterial Spin Labeling (pCASL) and 3D diffusion tensor imaging (DTI) at 9.4T.Material and methods
Acquisition Protocol - Experiments were performed on a 9.4T system (Bruker Biospec, AVIII-HD) with an 86mm-volume coil for excitation and a 4-channel cryoprobe surface coil for reception. Mice were anesthetized using isoflurane (1.5-2%) in air:O2 70:30%. After anatomical images, we acquired one 3D diffusion weighted imaging sequence as follows: 4-shot SE-3D-EPI sequence (TR/TE=500/17.3ms; 200µm isotropic resolution) with diffusion gradients characteristics δ/∆=3.3/6.5ms, 15 diffusion directions with a b-value of 1000s/mm² + 3 b=0s/mm² reference images for an acquisition time of 49min. Before and after the DTI sequence, a 3D-pCASL-EPI sequence was performed: unbalanced pCASL-labeling pulses [2] were applied in the mouse’s neck (at -12mm from the isocenter) during 3s followed by a 300ms post-labeling delay. The labeling consisted of Hanning-shaped RF pulses (average amplitude:5μT, duration=400μs, repeated every 800μs, with optimized label and control phases [3]); Gmax/Gave was set to 90/10mT/m. Image acquisition was performed through single-shot EPI: TR/TE=3500/13ms, resolution=0.2*0.2*0.6mm3, 4 repetitions, acquisition time 15min. For CBF-quantification, the labeling efficiency was measured 4mm downstream the labeling plane with a flow-compensated, ASL-encoded FLASH. The total acquisition time per mouse was 2h.Animals - The protocol was first adjusted on twelve C57Bl6 mice. Afterwards, it was applied on 4 wild type (WT) (22±2 weeks old) and 4 MAP6 KO (21±2 weeks old) male mice with a C57Bl6/129Sv genetic background.
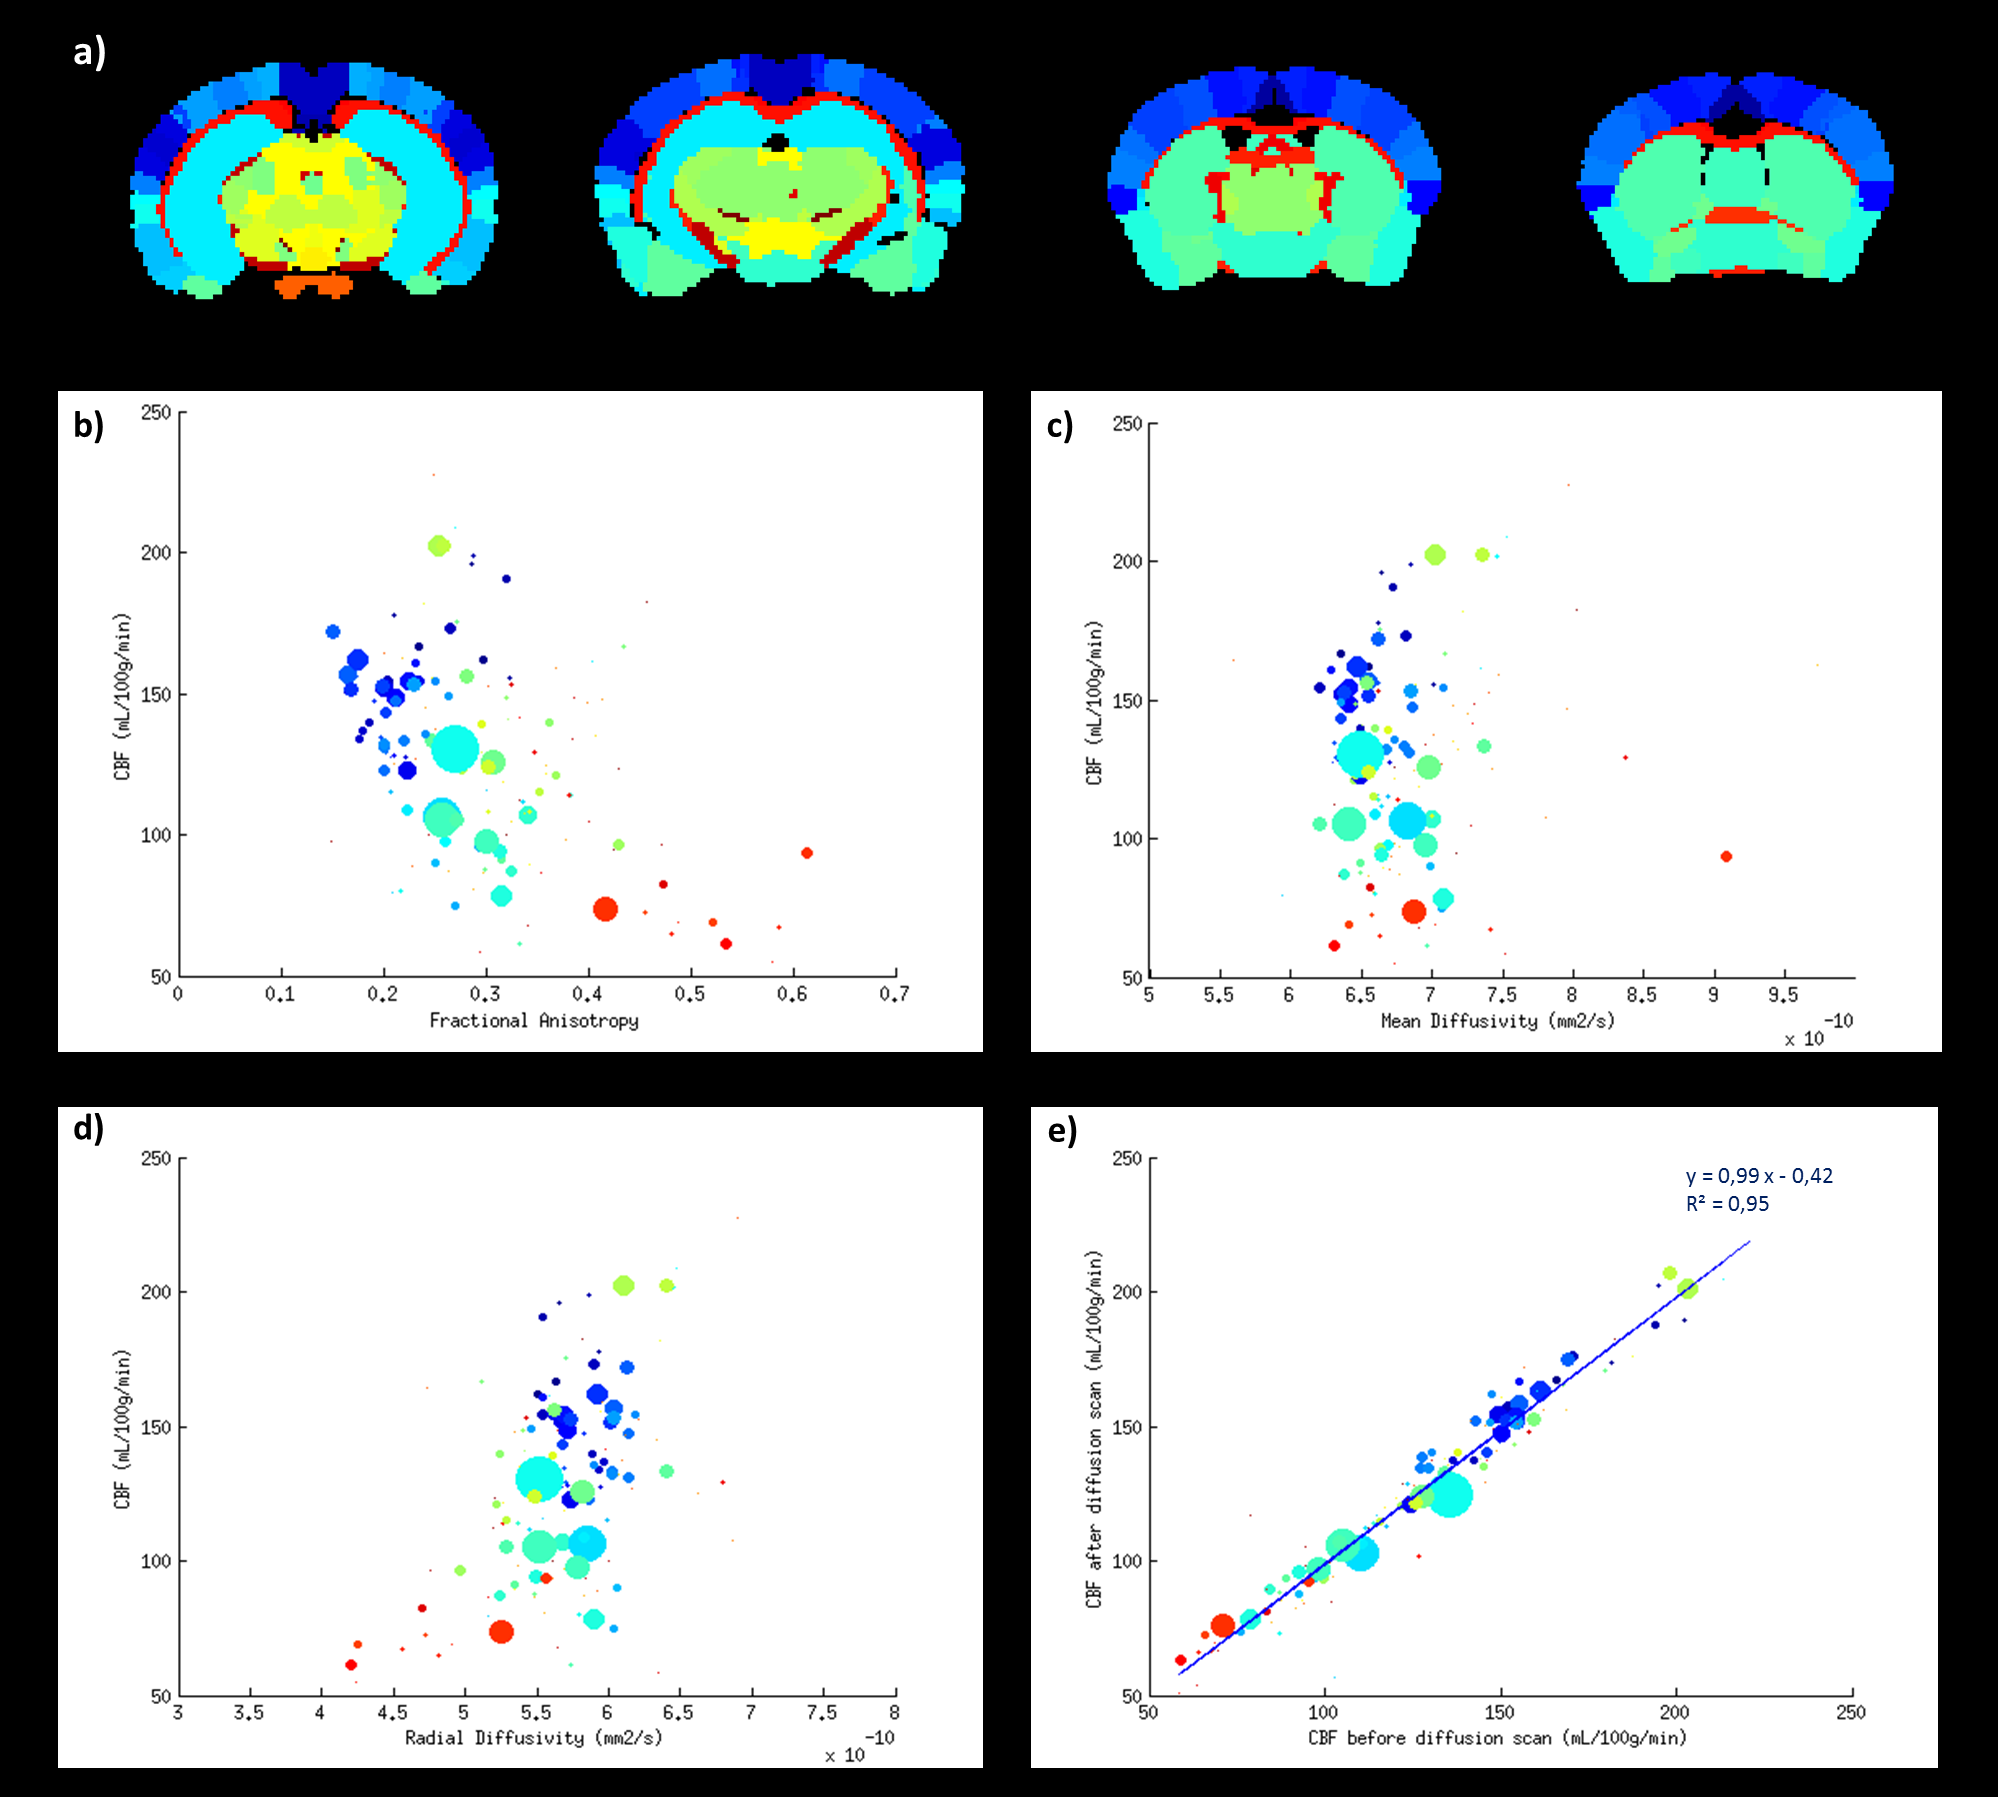
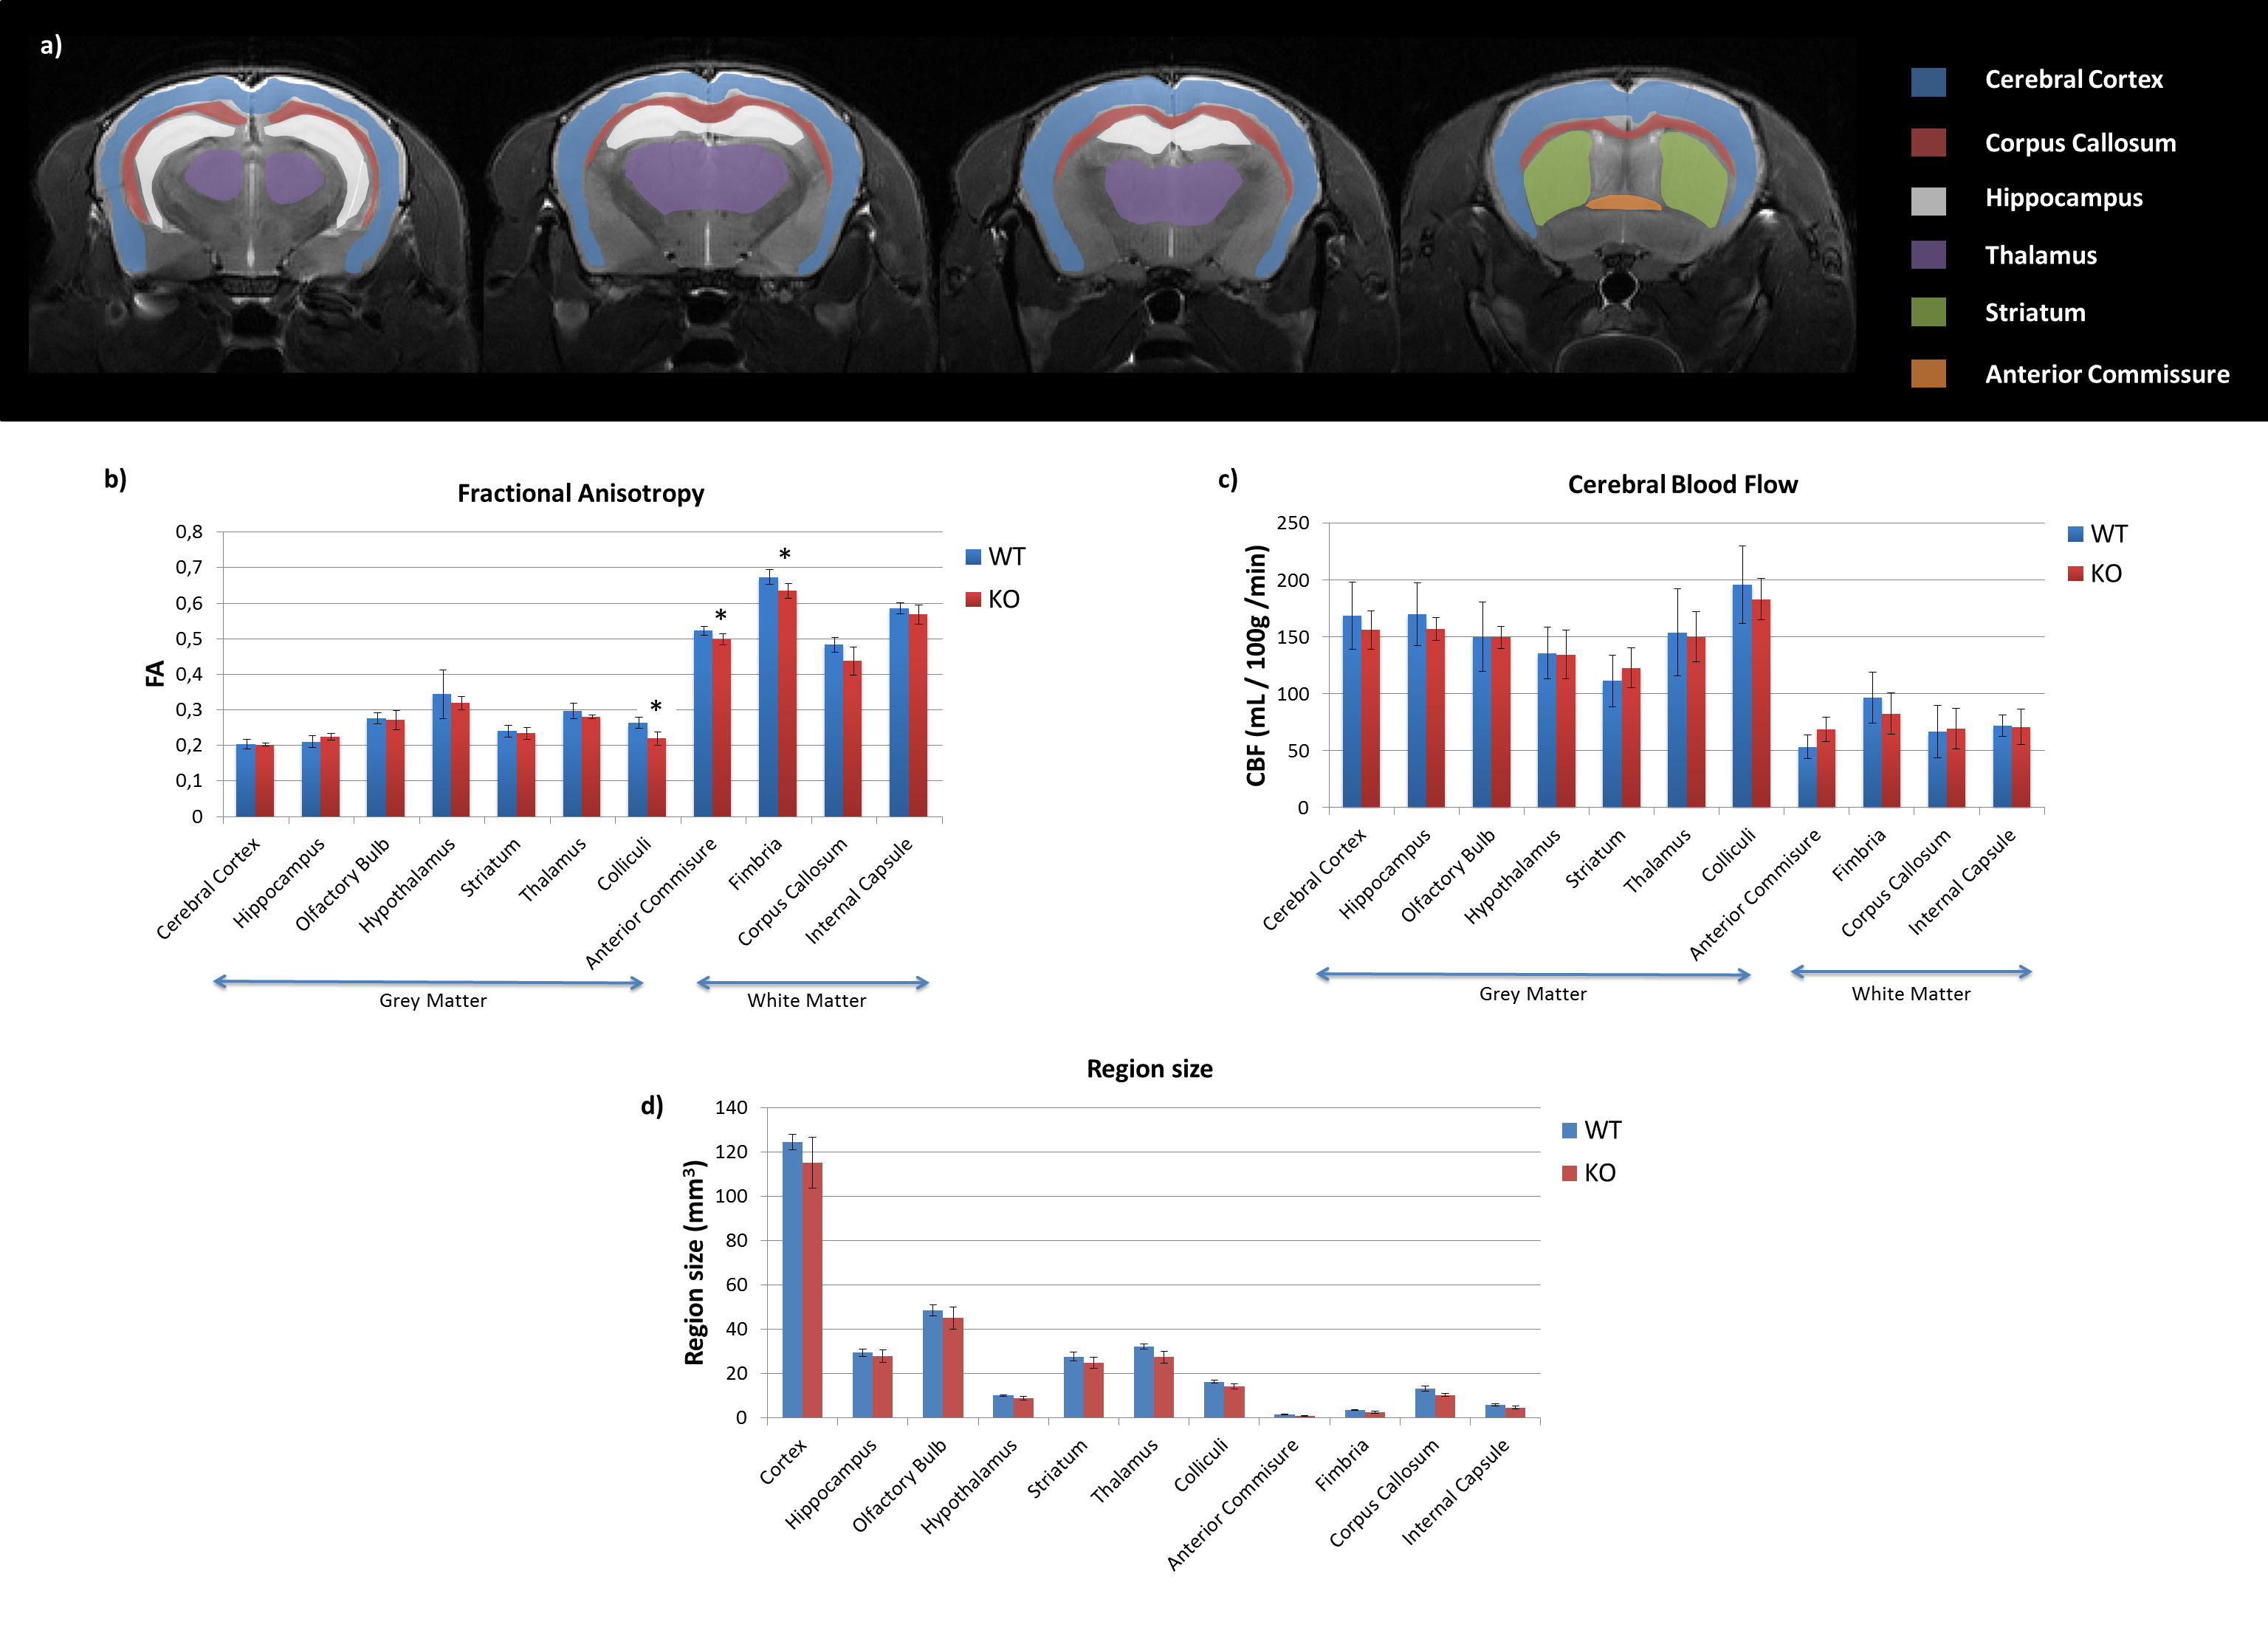
Post-processing - DTI data were processed using the Connectomist toolbox [4]. Quantitative CBF-maps were calculated [5] with an assumed value of 300ms for arterial transit time (ATT). For the twelve C57Bl6 mice, the data were carefully registered to the atlas [6], which allowed automatic segmentation of 148 regions. As the genetic background of the WT/KO mice differs from C57Bl6 and as we observed alterations in the volume of the structures between WT and KO mice (see Fig.4d), brain structures were not properly registered with the previous approach. Therefore, eleven ROIs were manually drawn (Fig.4a) on the diffusion and perfusion scans using ITK-SNAP [7].
Results
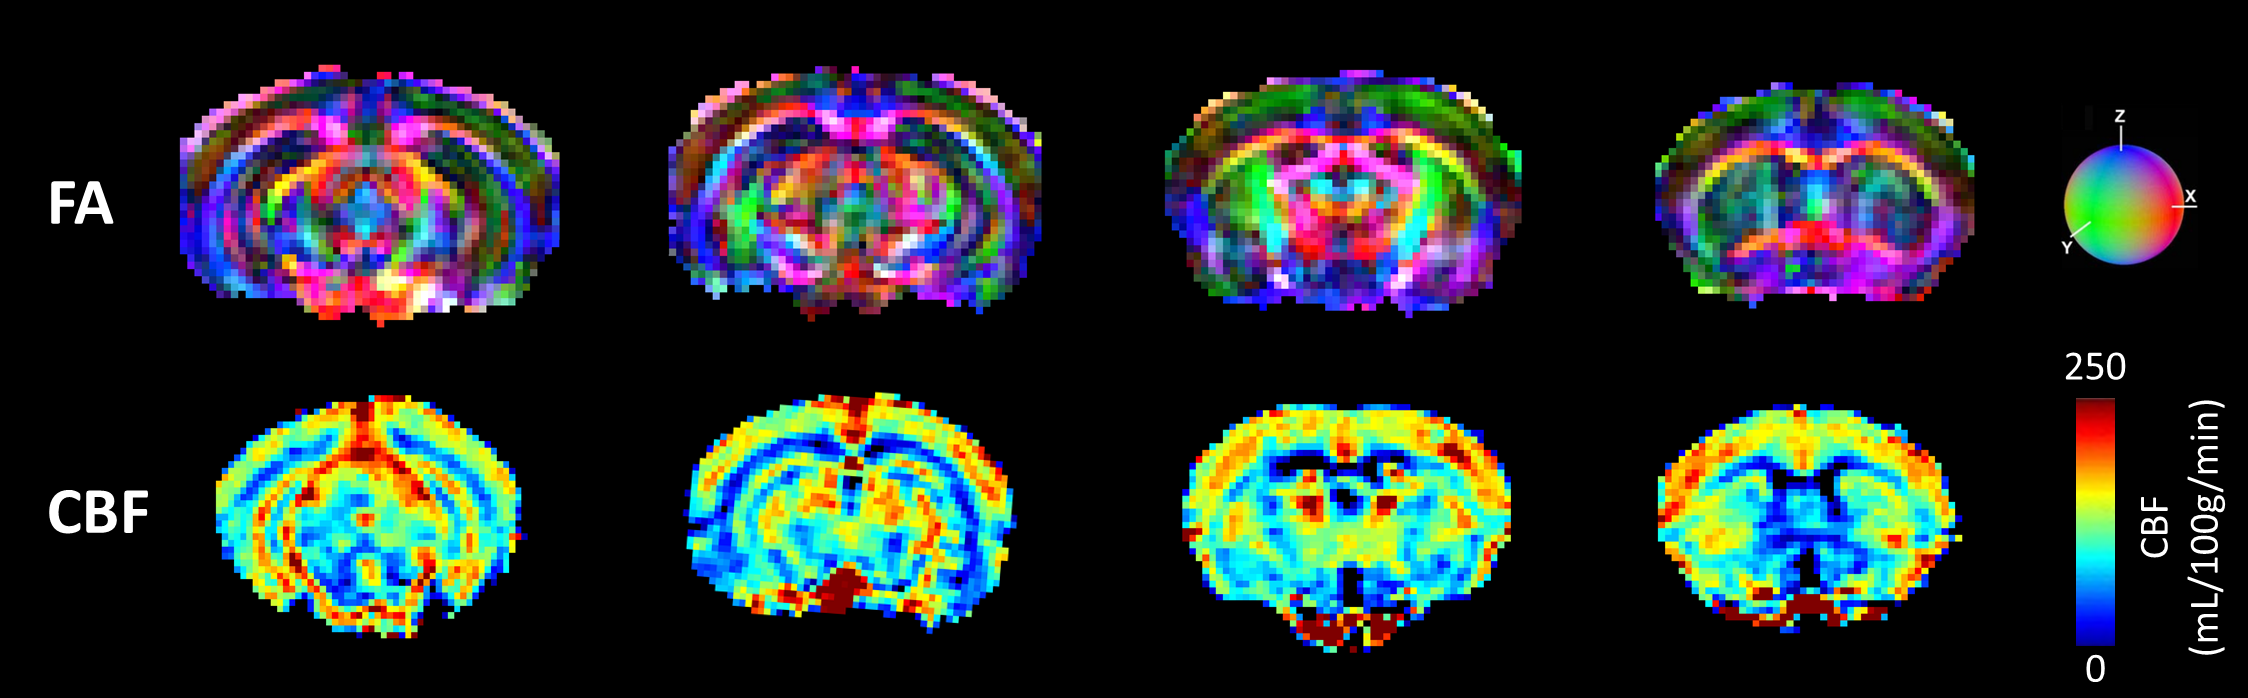
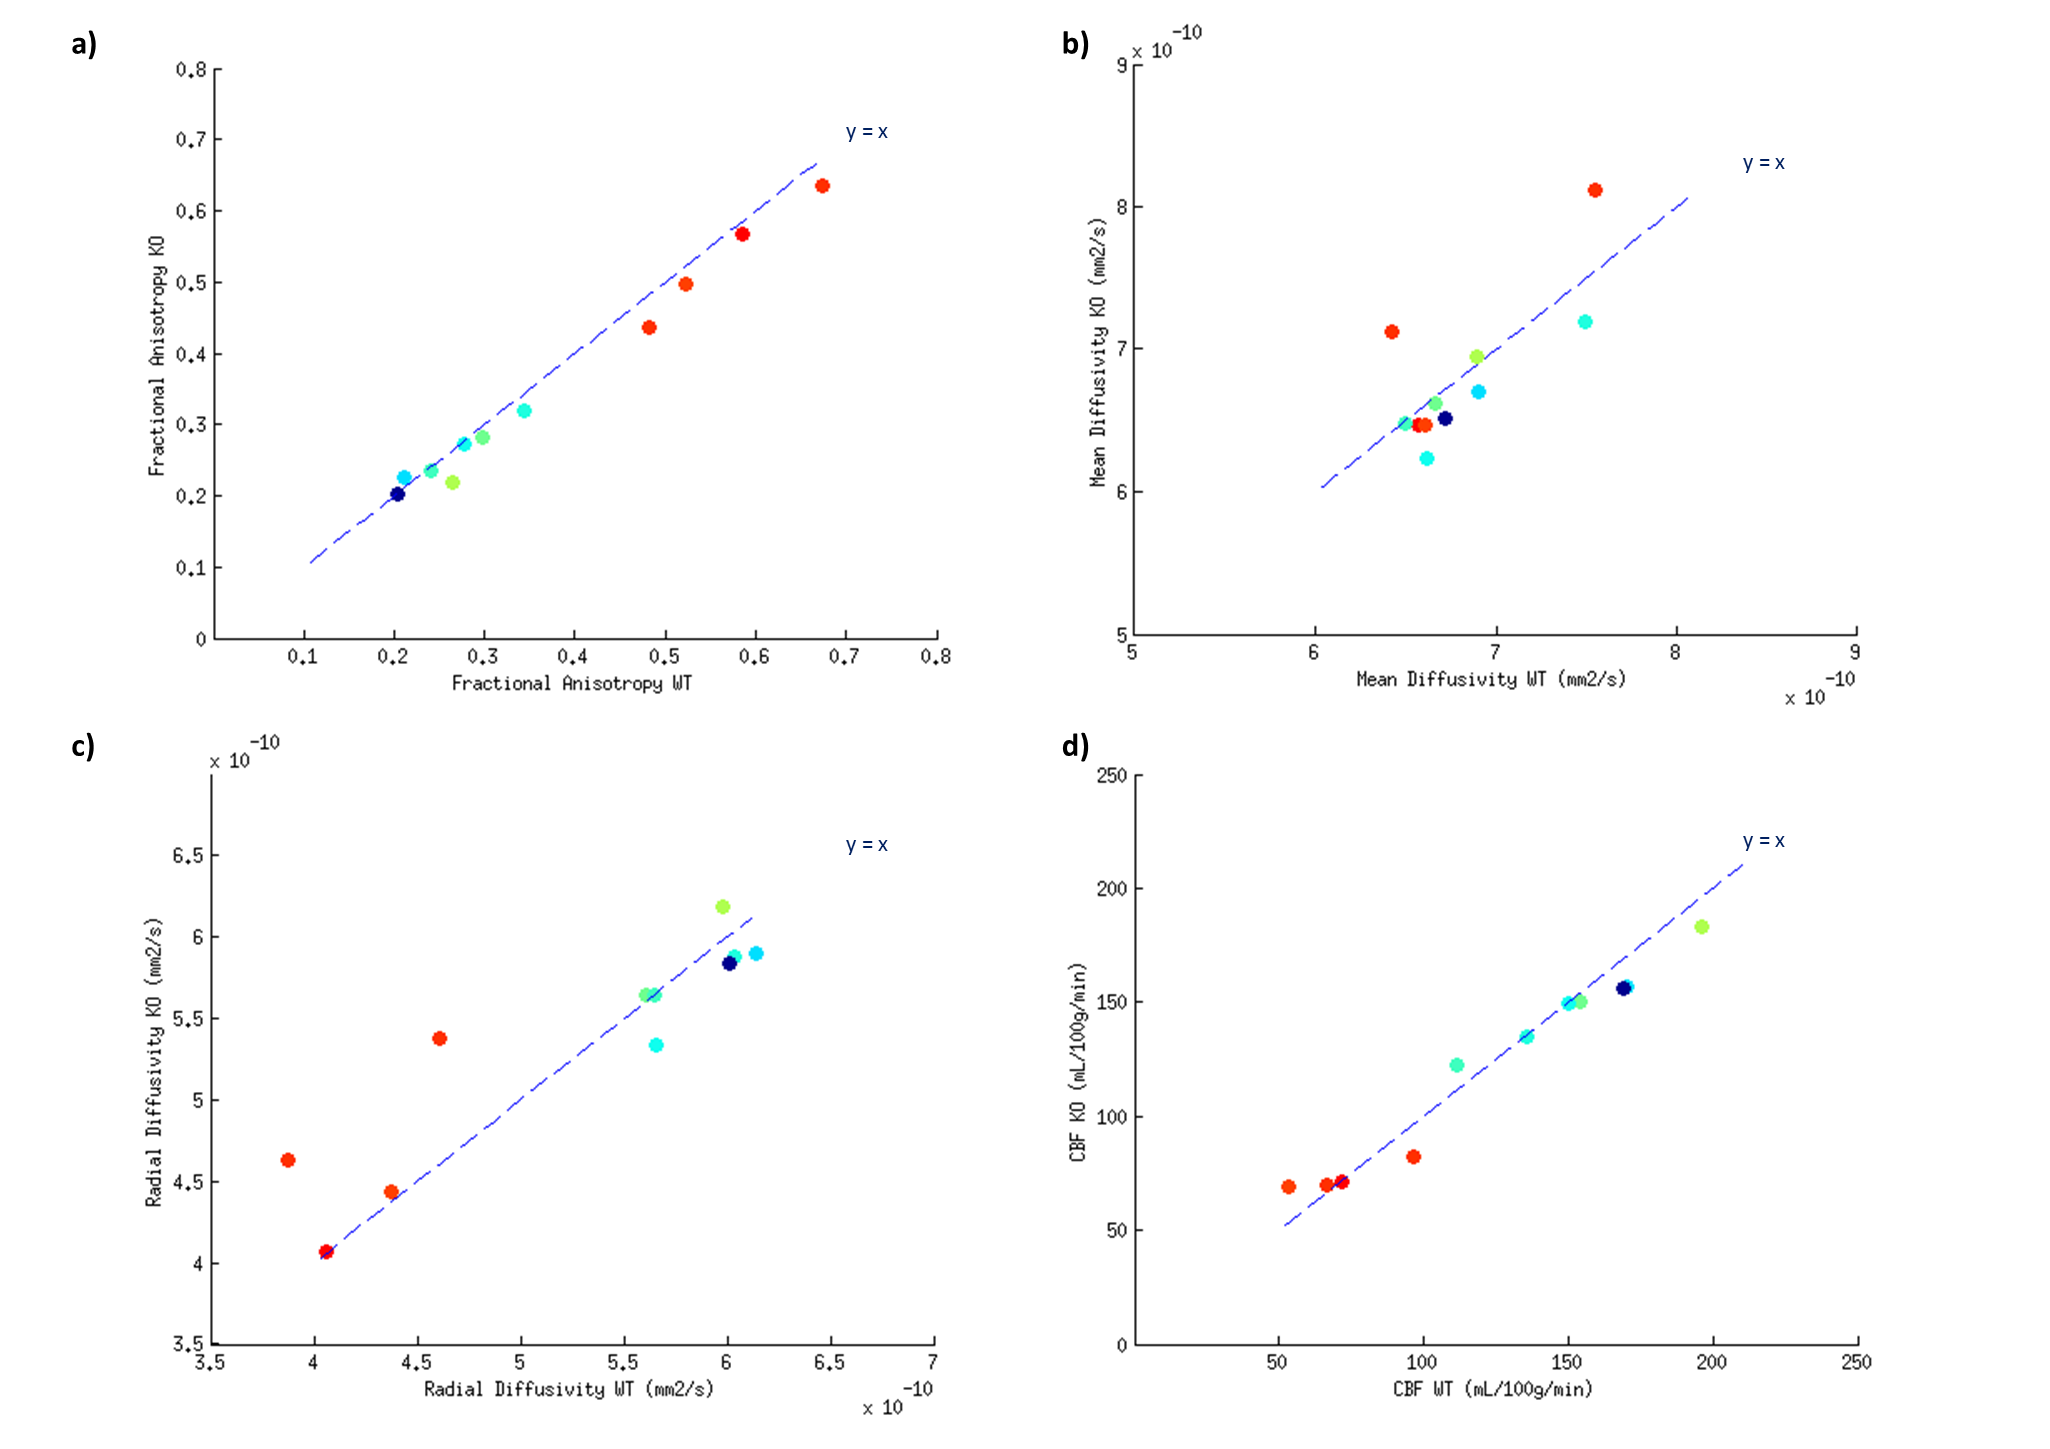
Fig.1 shows a slice selection of CBF and fractional anisotropy (FA) maps. The mean CBF and DTI parameters values in C57Bl6 mice were calculated in 148 ROIs. A region-size-weighted correlation between FA and CBF with R=0.58 (p<0.05) was found (Fig.2b): the higher the FA, the lower the CBF. Radial diffusivity (RD) follows an inverse trend (Fig.2d), whereas mean diffusivity (MD) appears to be CBF-independent (Fig.2d). Regions that show high FA and low CBF are predominantly white matter regions (red dots), whereas grey matter (blue dots; cf. atlas Fig.2a) show low FA and high perfusion. CBF remained globally stable during the diffusion scan (Fig.2e). For the KO mice, the FA was significantly reduced in three regions (Fig3+4b), and the RD was increased in the fimbria. No significant CBF changes were observed between KO and WT mice. An average GM/WM CBF of (153±23)/(73±13) mL/100g/min and FA of (0.26±0.04)/(0.55±0.08) was found.Discussion
This study shows the successful measurement of in vivo high-resolution whole-brain 3D perfusion and diffusion sequences in 20 mice. The trends of FA-decrease in white matter regions that are not accompanied by significant CBF variations in MAP6-KO compared to WT mice may show that a white matter alteration does not necessarily induce vascular changes. This may be consistent with the fact that the MAP6-KO mouse model is known to show morphological and structural deficits but no neurodegenerative alterations [1], for which both CBF and white matter variations are expected [8]. Influence of ATT on the CBF quantification could also bias the CBF evaluations in the KO/WT mice [9]. Mapping this parameter will allow for more reliable perfusion comparisons. In order to consolidate our results, more data will be acquired on fifteen mice (7 KO and 8 WT).Acknowledgements
Grenoble MRI facility IRMaGe was partly funded by the French program “Investissement d’Avenir” run by the ‘Agence Nationale pour la Recherche’; grant 'Infrastructure d’avenir en Biologie Santé' - ANR-11-INBS-0006References
1. Deloulme, J.C et al. Microtubule-associated protein 6 mediates neuronal connectivity through Semaphorin 3E-dependent signalling for axonal growth. Nat. Commun. 6:7246 doi: 10.1038/ncomms8246 (2015).
2. Dai W, Garcia D, de Bazelaire, Alsop DC. Continuous flow-driven inversion for arterial spin labeling using pulsed radio frequency and gradient fields, Magn Reson Med., 2008; 60(6):1488-97.
3. Hirschler L, Debacker CS, Voiron J, Warnking JM, Barbier EL. 2015. Robust Inter-Pulse Phase Correction for Brain Perfusion Imaging at Very High Field using pCASL. In: Proceedings of the ISMRM 23th Annual Meeting, Toronto, Canada.
4. D. Duclap, A. Lebois, B. Schmitt, O. Ri, P. Guevara, M. L, B. V, P. F, M. J-F, and P. C. Connectomist-2.0: a novel diffusion analysis toolbox for brainvisa. In Proceedings of the European Society Magnetic Resonance in Medicine and Biology, 2012.
5. Buxton RB et al.; A general kinetic model for quantitative perfusion imaging with arterial spin labeling. Magn Reson Med. 1998 Sep;40(3):383-96.
6. E. Calabrese, A. Badea, G. Cofer, Y. Qi, and G. Allan Johnson. A Diffusion MRI Tractography Connectome of the Mouse Brain and Comparison with Neuronal Tracer Data Cereb. Cortex first published online June 5, 2015 doi:10.1093/cercor/bhv121
7. Paul A. Yushkevich, Joseph Piven, Heather Cody Hazlett, Rachel Gimpel Smith, Sean Ho, James C. Gee, and Guido Gerig. User-guided 3D active contour segmentation of anatomical structures: Significantly improved efficiency and reliability. Neuroimage 2006 Jul 1;31(3):1116-28
8. Wells JA, O’Callaghan JM, Holmes HE, Powell NM, Johnson RA, Siow B, Torrealdea F, Ismail O, Walker-Samuel S, Golay X, et al. 2015. In vivo imaging of tau pathology using multi-parametric quantitative MRI. Neuroimage 111:369–378.
9. Alsop DC et al.; Recommended implementation of arterial spin-labeled perfusion MRI for clinical applications: A consensus of the ISMRM perfusion study group and the European consortium for ASL in dementia. Magn Reson Med. 2015 Jan;73(1)
Figures