1891
Validation of quantitative pre-clinical pseudo-continuous ASL in rat brain1CRUK and MRC Oxford Institute for Radiation Oncology, Department of Oncology, University of Oxford, Oxford, United Kingdom, 2FMRIB Centre, Nuffield Department of Clinical Neurosciences, University of Oxford, Oxford, United Kingdom, 3Institute of Biomedical Engineering, Department of Engineering, University of Oxford, Oxford, United Kingdom
Synopsis
Guidelines for pre-clinical ASL are lacking. We propose MRI parameters for the use of pseudo-continuous ASL in rats. Carotid artery velocity was determined in three rat strains. Bloch simulations for ASL with this information and with parameters for pre-clinical scanners were used to determine the optimal width of the tagging plane required for blood inversion in this smaller species. The use of multiple post-label delays (PLD) in ASL-MRI generated blood arrival maps indicating that a PLD of 550ms was sufficient. Validation of CBF maps generated from ASL was performed using autoradiography, the current gold-standard technique for pre-clinical perfusion measurement.
Purpose
Arterial spin labelling (ASL), a method for measuring blood flow by non-invasively tagging endogenous blood and measuring the exchange of blood water with surrounding tissue, has proven to be of clinical value for assessment of cerebral blood flow in brain disorders. The ISMRM Perfusion Study Group, with the European consortium for ASL in dementia, published recommended guidelines to standardise ASL in the clinic1. Such standardisation, however, is still lacking in the pre-clinical use of ASL, with an unrealistically wide range of rodent cerebral blood flow (CBF) values being reported. We sought to assess the clinical ASL guidelines on pre-clinical scanners to standardise ASL research in pre-clinical models, taking into account factors such as the higher field strengths used and the proximity of the brain in rodents to air in the nasal cavities and oesophagus. Here, we present our most recent developments in quantitative pre-clinical ASL in rats including validation of MRI perfusion maps with autoradiography, the gold-standard for measuring CBF in animals.Methods
Power Doppler ultrasound (Vevo3100, VisualSonics) of rat right carotid artery was performed on three strains of rats (Sprague-Dawley (SD), Berlin-Druckrey IX (BD-IX) and Wistar; weight 200-250g) whilst varying anaesthetic depth, to determine mean blood velocity in this brain-feeding artery. We conducted Bloch simulations using this mean blood velocity, rat blood T1 and T2 relaxation times2,3 whilst varying Gmax and Gmean gradient strengths (1/20th) then converted these gradients to tagging plane thickness in millimetres for our MRI scanner. Blood flow velocities between 1-100cm/s were used with flip angle between 0 and 90˚ for a train of 600μs Hanning-shaped pulses, starting every 1.2ms.
pCASL experiments were performed on isoflurane anaesthetised female SD, BD-IX and Wistar rats using a 9.4T MRI spectrometer (Agilent) with a 72mm volume transmit coil and a 4-channel surface receive array (Rapid Biomedical). pCASL imaging readout was a multislice single-shot spin echo EPI (FOV=32x32mm, 64x64 matrix, slice thickness=1mm), TR=4s, TE=28.7ms, labelling bolus duration=1.4s (acquisition=89s). The blood tagging plane was placed perpendicular to the brain feeding arteries, directly behind the medulla oblongata, and ten imaging slices were acquired, starting 1mm behind the olfactory bulb sulcus, as described previously4. Multiple post-label delays (12 between 10-1000ms) were used to determine arterial transit time of tagged blood to the imaging region. Multiphase pCASL5 used eight phase increments between 0˚ and 315˚, in steps of 45˚ (4.4µT, FA=40˚). T1 (9xTI; 13ms-8s) and T2 maps (10xTE; 30-160ms; same imaging slice pattern as pCASL) were also acquired. pCASL data from the eight phases were fit to a modified Fermi function with α=66 and β=21 using a modified version of BASIL6. Autoradiography was performed on one Wistar rat following pCASL MRI, by injecting 0.5mL of 0.1mCi/mL 14C-iodoantipyrine in sterile saline (specific activity=55mCi/mmol; American Radiolabeled Chemicals) into the femoral vein and killing the rat 1 minute later. The head was frozen in isopentane with dry-ice, the brain removed and 20µm cryo-sections cut. Sections were exposed to film (Carestream® Kodak® Biomax® MR film) for 3 days to generate autoradiographs7.
Results
Carotid blood velocity was measured to provide an accurate parameter for Bloch simulations of the tagging plane in each rat strain. Significant differences in peak and mean blood velocity were observed between rat strains (Figure 1). Mean blood velocity for all rats combined was of 37.4±9.4cm/s. According to simulations of the Bloch equations, optimal Gmax and Gmean to be used were of 1.62mT/m and 0.081mT/m, respectively, corresponding to a tagging plane of 6.2mm, for more consistent blood spin inversion (Figure 2). With these gradient strengths, estimation of blood arrival time to the imaging region was obtained by varying pCASL PLD. A PLD of 550ms was sufficient for blood arrival time to over 99% of brain voxels throughout the imaging region (Figure 3). A tag bolus duration of 1.4s yielded consistent CBF values similar to those obtained in literature from autoradiography studies (Figure 4). Our preliminary autoradiography experiments, in a rat in which pCASL had been performed, yielded CBF values ranging from 42-121mL/100/min, very similar to pCASL CBF results obtained in the same animal (Figure 5).Discussion
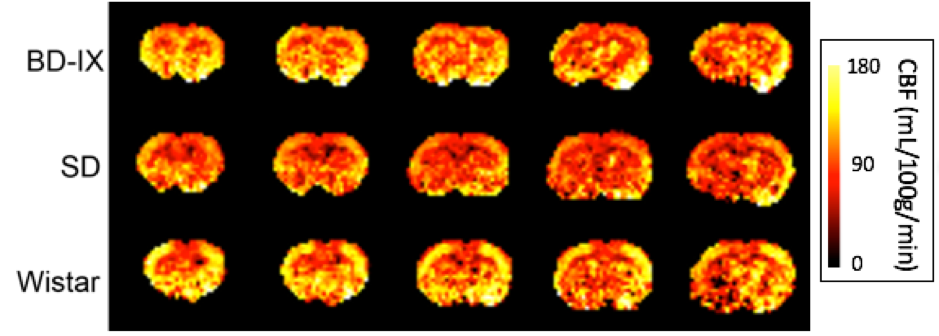
Our optimised multiphase pCASL methodology yields consistent quantitative CBF values from rat brain at 9.4T in three rat stains (SD, BD-IX and Wistar). pCASL CBF values in normal brain are in line with published gold-standard autoradiography measurements of CBF, as well as our own preliminary measurements.Conclusion
Optimal parameters for multiphase rat pCASL have been determined. Pre-clinical ASL will benefit from a similar standardisation to that implemented in the clinic for improved accuracy and reproducibility in CBF measurements.Acknowledgements
This work was funded by the CRUK/EPSRC Cancer Imaging Centre (grant number C5255/A16466) in Oxford and Cancer Research UK (grant number C5255/A15935).
The authors thank Sean Smart and Paul Kinchesh for their assistance with MRI troubleshooting.
References
1 Alsop, D. C., Detre, J. A., Golay, X., et al. Recommended implementation of arterial spin-labeled perfusion MRI for clinical applications: A consensus of the ISMRM perfusion study group and the European consortium for ASL in dementia. Magnetic Resonance in Medicine 73, 102-116, doi:10.1002/mrm.25197 (2015).
2 Kim, T., Kim, S. G. Quantification of Cerebral Arterial Blood Volume and Cerebral Blood Flow using MRI with Modulation of Tissue and Vessel (MOTIVE) Signals. Magnetic Resonance in Medicine 54, 333-342, doi:10.1002/mrm.20550 (2005).
3 Lee, S. P., Silva, A. C., Ugurbil, K., Kim, S. G. Diffusion-weighted spin-echo fMRI at 9.4 T: Microvascular/tissue contribution to BOLD signal changes. Magnetic Resonance in Medicine 42, 919-928, doi: 10.1002/(SICI)1522-2594(199911)42:5<919::AID-MRM12>3.0.CO;2-8 (1999).
4 Larkin, J. R., Simard, M. A., Khrapitchev, A. A., et al. Multiphase pCASL for imaging blood flow in rodent brains. Proc. Intl. Soc. Magn. Reson. Med. 24 #5333 (2016).
5 Jung, Y., Wong, E. C. & Liu, T. T. Multiphase pseudocontinuous arterial spin labeling (MP-PCASL) for robust quantification of cerebral blood flow. Magnetic Resonance in Medicine 64, 799-810, doi:10.1002/mrm.22465 (2010).
6 Chappell, M. A., Groves, A. R., Whitcher, B. & Woolrich, M. W. Variational Bayesian Inference for a Nonlinear Forward Model. IEEE Transactions on Signal Processing 57, 223-236, doi:10.1109/tsp.2008.2005752 (2009).
7 Sakurada, O., Kennedy, C., Jehle, J., et al. Measurement of local cerebral blood flow with iodo [14C] antipyrine. American Journal of Physiology 234, H59-H66 (1978).
Figures
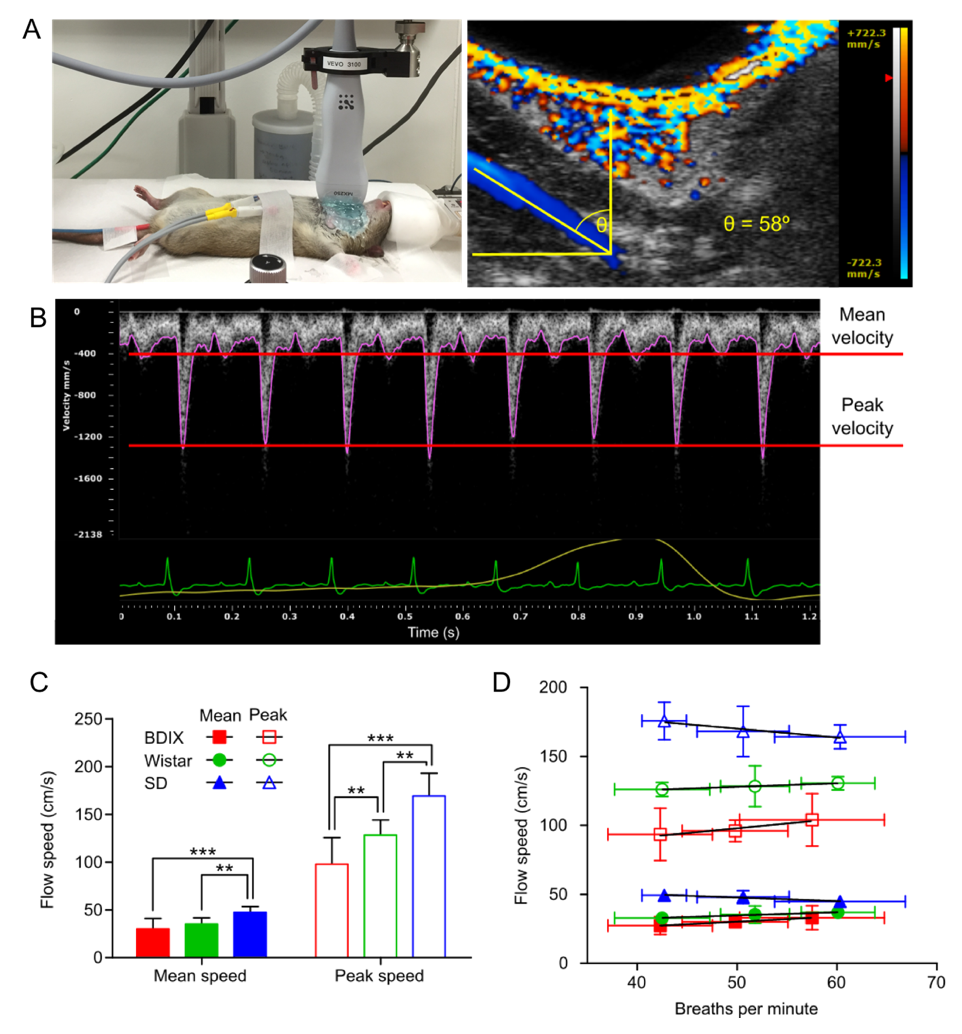
Determining pCASL tag thickness with Power Doppler ultrasound and Bloch simulations.
A Power Doppler rat carotid ultrasound set-up. B Mean and peak carotid blood velocities in all three strains of naïve rats. C Mean and peak carotid blood velocities across varying anaesthetic depth (D) in each strain of rat.
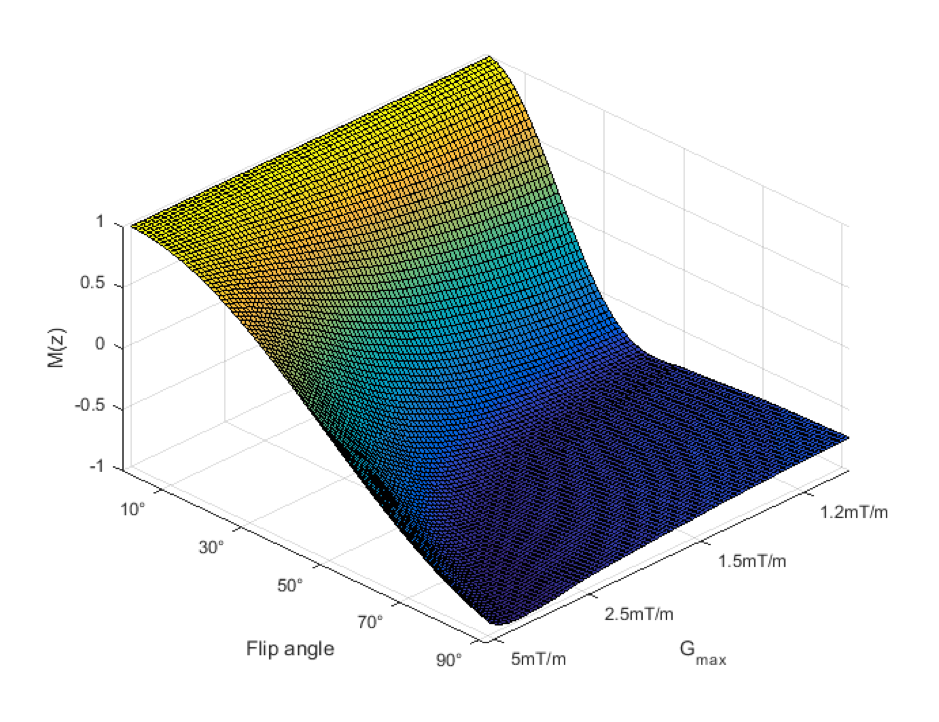
Blood inversion efficiency at mean rat carotid blood velocity resulting from Bloch simulations.
Flip angle and Gmax were varied to determine optimal inversion efficiency. Mean rat carotid velocity (37cm/s) was obtained from Power Doppler ultrasound results from three rat strains (SD, BD-IX, Wistar).
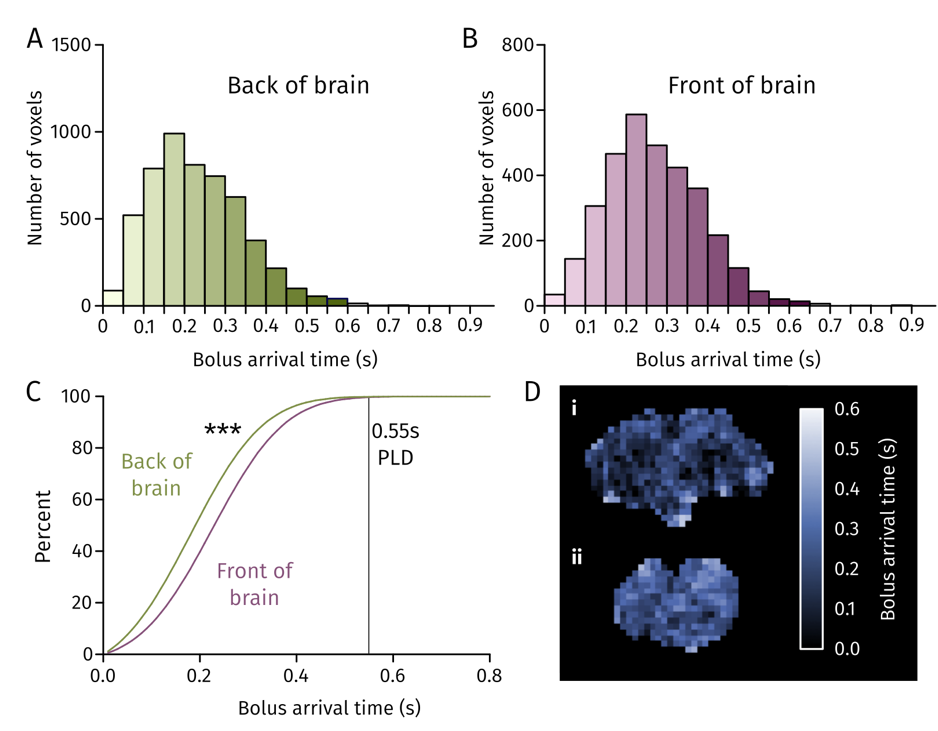
Blood bolus arrival time at the front and back of rat brain.
A, B Distribution of blood arrival time in voxels of brain at the back and front of the brain, respectively. C Percentage of voxels having received tagged blood at a given time for the front and back of brain. D Blood arrival maps for the back (i) and front (ii) of the brain.
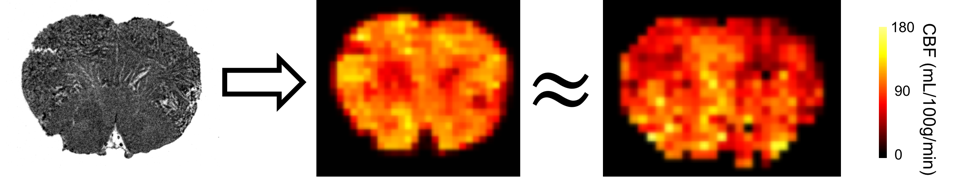
Comparison of preliminary autoradiography CBF with pCASL CBF in a Wistar rat.
From left to right: 20 µm brain section autoradiograph section, downsized and transformed autoradiograph section into calculated CBF map7, 1 mm thick pCASL CBF map of similar brain slice.