1890
Quantification of mouse renal perfusion using arterial spin labeled MRI at 1 Tesla1Radiology, University of Texas Southwestern Medical Center, Dallas, TX, United States, 2Advanced Imaging Research Center, University of Texas Southwestern Medical Center, Dallas, TX, United States, 3Aspect Imaging, Shoham, Israel
Synopsis
The current work demonstrates the use of a 1 Tesla desktop MR system to study mouse kidney perfusion through arterial spin labeling (ASL) technique. The validity of the implementation was tested by (1) comparing obtained perfusion results with literature values for normal mice and (2) challenging the technique with mice treated with a blood vessel vasoconstrictor drug. Potential applications include easy assessments of disease state, metabolism, and tissue perfusion using a compact MR system.
Purpose
We have been using a preclinical, commercially available, 1Tesla(T) MRI (M2Compact, Aspect Imaging, Israel) with a small footprint and a self-contained fringe field. These features permit flexibility in siting, e.g, behind the barrier in mouse facilities and in multi-modality preclinical imaging facilities. Although this 1T MRI provides morphological information of rodent models, its ability to perform functional analysis of tissue perfusion has been limited. Quantitative measurement of tissue perfusion is important because it provides information regarding organ physiology and offers further understanding of inter-and intratumoral metabolic heterogeneity.1 Our objective was to evaluate the capability of the desktop MRI to measure mouse renal perfusion without the administration of exogenous contrast agents. This was an important step in validating MRI-based perfusion methods in the assessment of tumor perfusion and the evaluation of treatment response to anti-angiogenic therapies in small animal models using this desktop MRI scanner.Methods
We implemented the flow alternating inversion recovery (FAIR)-based arterial spin labeling(ASL) sequence with a mouse volume coil on a 1T desktop MR scanner. The general imaging protocol consisted of a spoiled gradient echo sequence (TR/TE=5.4/2.4msec, TI=1200msec, Shot Repetition=4000msec), acquiring a single, 4-mm axial section of the mouse kidney (128x128,FOV=6cm). Thirty-six pairs of label (slab-selective inversion) and control (slice-selective inversion) images were acquired and averaged for ASL acquisition. A reference proton density image was acquired using the same acquisition parameters, but by turning off the inversion pulses in the ASL preparation and acquiring six averages.
DICOM images were processed offline in Matlab (Mathworks, Natick, MA, USA). The label and control images were averaged and then subtracted to generate the perfusion image. Additionally, the quantitative renal blood flow (RBF) maps were obtained using equation(1)2,3: $$RBF=\frac{\lambda(S_{sel}-S_{nonsel})}{2\alpha*TI*S_{ref}}e^{\frac{TI}{T_{1}}}$$ where λ is the tissue-blood partition coefficient, assumed to be 1mL/g4; S is the signal for: nonselective(Snonsel), selective(Ssel)ASL images, and the reference proton density image(Sref); TI is the inversion time, 1200msec; the T1 of blood is assumed to be 1426msec at 1T5; and α is the inversion efficiency, assumed to be 1.4 RBF was evaluated as the mean±standard deviation(SD) of pixel values in manually-drawn regions of interest(ROIs) on perfusion maps.
The first group of mice (n=15,19-43g) was imaged as described above to verify the implementation of the ASL. To test the sensitivity of the sequence to renal perfusion changes, a second group (n=12,19-41g) was treated with furosemide, a renal vasoconstrictor drug (8mg/kg). Renal perfusion values were measured before I.P injection of furosemide, and at 1,4,8, and 24hours post-injection time points.
Results
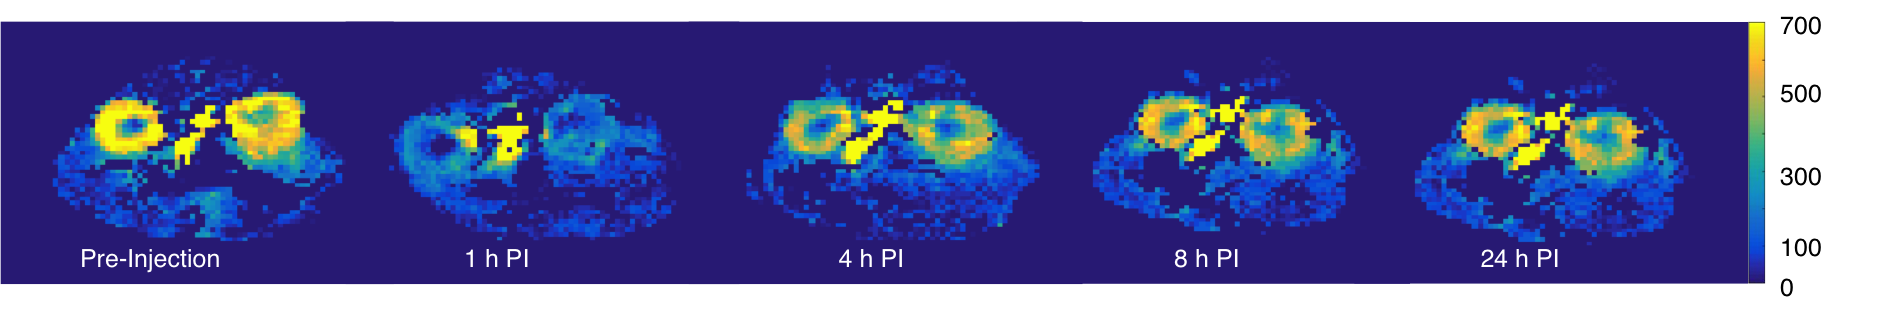
Figure1 shows a schematic of the FAIR pulse sequence implemented on the 1T MRI. Figure2 shows representative anatomical, FAIR, and quantitative RBF map images of a mouse. The cortical RBF is higher than that of the medulla with both renal substructures clearly distinguishable on the FAIR images. As Figure3a indicates, the RBF increases with the mouse weight, however, the ratio between cortex to medullary RBF stays within a narrow range between 2 and 3 (Figure3b). Figure4 shows renal perfusion in a mouse showing decreased RBF after furosemide injection and returning to normal values in 24hours. Figure5 shows the cortical perfusion before and after furosemide administration. Before injection, the cortical perfusion is stable. Shortly after injection, blood flow gradually decreases and RBF reaches minimum value~30minutes P.I. We employed paired t-test to compare the measured renal perfusion pre-and post-injection (one-sided p value<0.0001). The point estimate of the mean difference is -210mL/100g/min, with a corresponding 95% confidence interval of -141 and -278mL/100g/min.Discussion
Across the mice population, cortical and medulla perfusion was quantified to be 402±95 and 184±52(mL/100g/min). These perfusion values are in agreement with literature values.6 We also showed that the ratio of cortex to medulla RBF is independent of the mouse weight. Additionally as expected, upon furosemide injection, a decrease (~50%) in cortical perfusion was observed. There is statistically significant evidence that furosemide decreases perfusion and this change in RBF was observed with FAIR-based perfusion measurement, providing a validation to our method.Conclusion
We reported the successful application of FAIR-based ASL at 1Tesla for mouse kidney perfusion. We demonstrated that perfusion values obtained using a desktop scanner are in agreement with literature data and decrease as expected when challenged with furosemide. The easy implementation of the FAIR sequence on a 1Tesla desktop MRI offers the potential for perfusion studies using PET/MR-multimodality imaging. The current laboratory set up–with the PET and MR scanners housed in the same room-will allow future work of unique opportunity to validate the MR results with H215O-labeled-PET and first pass perfusion measurements using 18FDG-PET on the same animal, in close temporal proximity.Acknowledgements
This work was supported by CPRIT (R1107).References
1. Hensley CT, Faubert B, Yuan Q, et al. Metabolic Heterogeneity in Human Lung Tumors. Cell. 2016;164(4):681-694.
2. Alsop DC, Detre JA. Reduced transit-time sensitivity in noninvasive magnetic resonance imaging of human cerebral blood flow. J Cereb Blood Flow Metab. 1996; 16(6):1236-1249.
3. De Bazelaire C, Rofsky NM, Duhamel G, et al. Arterial spin labeling blood flow magnetic resonance imaging for the characterization of metastatic renal cell carcinoma. Acad Radiol. 2005;12(3):347-357.
4. Schor-Bardach R, Alsop DC, Pedrosa I, et al. Does arterial spin-labeling MR imaging-measured tumor perfusion correlate with renal cell cancer response to antiangiogenic therapy in a mouse model? Radiology. 2009; 251(3):731-742.
5. Zhang X, Petersen ET, Ghariq E, et al. In vivo blood T1 measurements at 1.5 T, 3T, and 7 T. Magn. Reson. Med. 2013;70(4):1082-1086.
6. Rajendran R, Lew SK, Yong CX, et al. Quantitative mouse renal perfusion using arterial spin labeling. NMR Biomed. 2013; 26: 1225-1232.
Figures

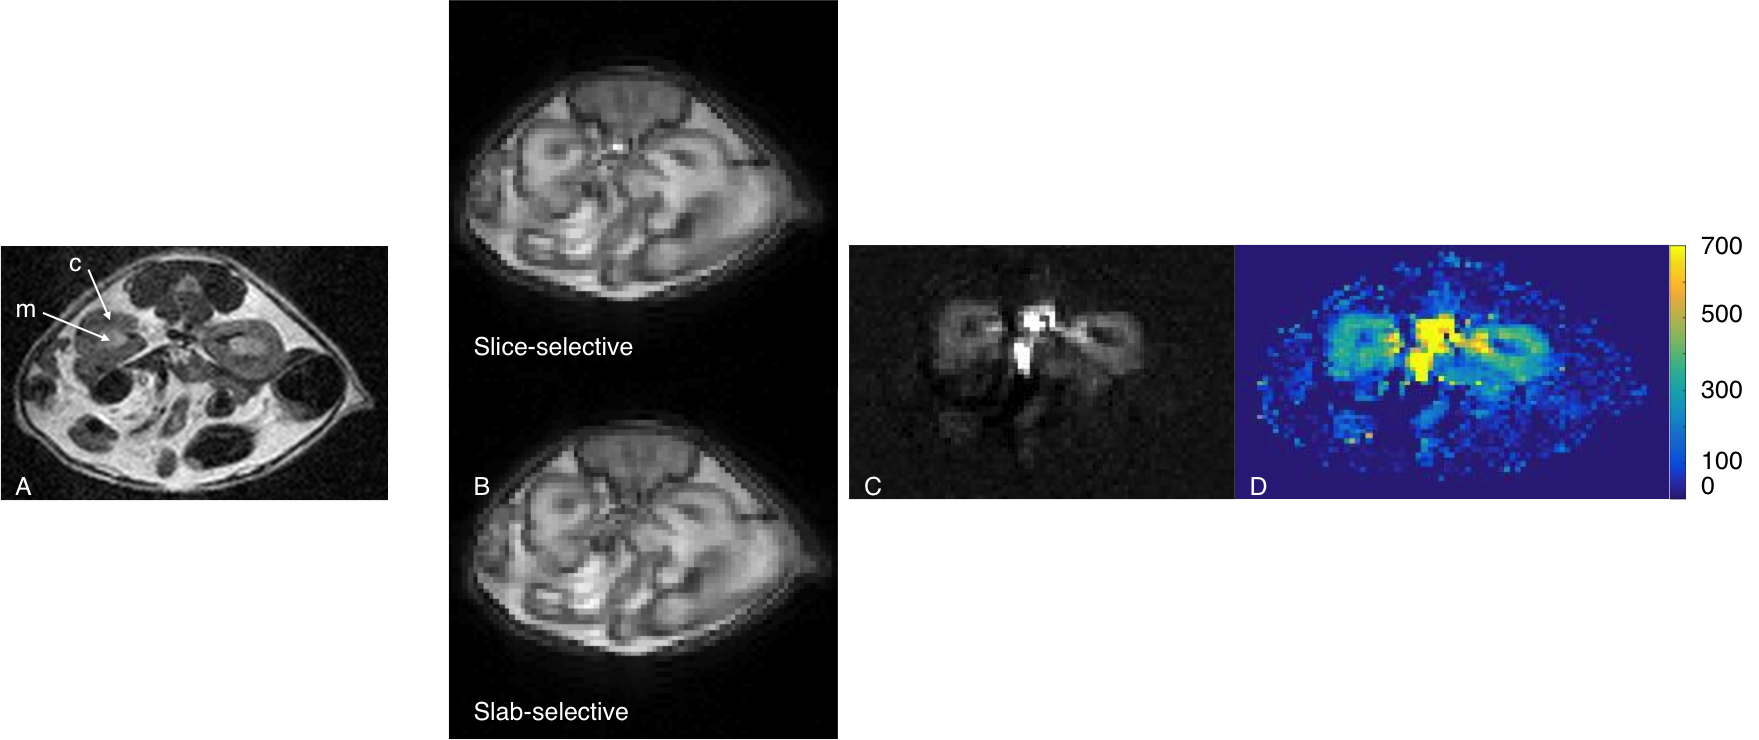
The 1T desktop MRI can provide both anatomical and functional images of mouse kidneys in vivo.
A. T2 weighted FSE image of mouse kidney. Renal substructures [cortex (c) and medulla (m)] are indicated.
B. Slice-selective (control) and slab-selective (label) images of mouse kidney acquired by the FAIR sequence.
C. FAIR perfusion image, obtained by taking the difference between the control and label images.
D. Quantitative renal blood flow map in kidneys. Using equation (1)2,3, the cortical perfusion value of this particular mouse was found to be 390±60 mL/100 g/min.