1887
Improved reproducibility of longitudinal renal ASL perfusion measurements in children with chronic kidney disease using retrospective motion correctionFabio Nery1, Enrico De Vita2,3, Chris A. Clark1, Isky Gordon1, and David L. Thomas3
1UCL Great Ormond Street Institute of Child Health, Developmental Imaging and Biophysics Section, London, United Kingdom, 2National Hospital for Neurology and Neurosurgery, Lysholm Department of Neuroradiology;, 3UCL Institute of Neurology, Department of Brain Repair and Rehabilitation
Synopsis
Arterial spin labelling (ASL) is a unique MR approach for quantifying tissue perfusion non-invasively. However, it is prone to motion-related artefacts which limit its application in the clinical domain, especially outside the brain. In this work, we combine a motion-insensitive ASL acquisition scheme with a specifically tailored retrospective motion correction pipeline. This enabled repeatable renal perfusion measurements to be obtained in the first ASL study in paediatric patients with moderate/severe chronic kidney disease.
Introduction
Arterial spin labelling (ASL) is a unique MR approach for quantifying tissue perfusion non-invasively. More than two decades of developments enabled great strides in translating this technique from specialized research labs into clinical implementation [1,2]. Nevertheless, ever since its inception ASL has been hindered by its propensity to motion-related artefacts which limit its application in the clinical domain, especially outside the brain [3,4]. In this work, we combine a motion-insensitive ASL acquisition scheme with a specifically tailored image processing pipeline to enable accurate and repeatable renal perfusion measurements to be obtained in paediatric patients with kidney disease.Purpose
To evaluate the effect of retrospective motion correction approaches in ASL for renal perfusion assessment in paediatric patients with moderate/severe chronic kidney disease (CKD stages 3-4).Methods
Eleven children with chronic kidney disease (CKD) (age 12±3) were scanned twice on a 1.5T Avanto scanner (Siemens Healthcare, Erlangen). The time between scans was 23±10 days. Coronal-oblique ASL data volumes were obtained using a single-shot FAIR Q2TIPS 3D-GRASE acquisition scheme with respiratory triggering and background suppression (BS). Main scan parameters include: 25 ASL pairs; inflow time (TI) 1200ms; TR/TE 3000ms/31.54ms; nominal scan time 150 seconds; matrix size 64x64x10; voxel size 4.5x4.5x6.0mm; Partial Fourier (factor 3/4) along the second PE direction. The ASL scan was repeated 2 times in each session with a ~30min gap between acquisitions, to assess intra-session reproducibility. A separate saturation recovery (SR) scan was performed to obtain T1/M0 maps for ASL quantification. Scan parameters were identical except BS was disabled and 9 post-saturation delays (TD) were used (range: 100-2500ms; increment 300ms; saturation pulse spatially non-selective). A proton-density (PD) volume was also obtained with similar scanning parameters (without saturation pulse) to serve as reference for image registration and functional renal parenchyma ROI drawing during data analysis. Care was taken not to include high intensity regions (corresponding to a dilated collecting system) in the ROIs. Three post-processing approaches were used: A) no registration; B) image-registration only and C) image-registration + weighted averaging scheme based on [5] (Fig.1). 3D rigid body registrations were performed using elastix [6] with masks for independent registration of both kidneys and a mutual information-based image similarity measure. Each image volume in the SR recovery time series was also registered to the same reference PD image for ensuring alignment between the T1/M0 maps and the perfusion-weighted datasets (not shown in Fig.1). ASL quantification was performed using a single-compartment model [7]. Repeatability of renal blood flow (RBF) estimates was evaluated as assessed by the intra-class correlation coefficient (ICC) and the within-subject coefficient of variation (WSCV). The effect of registering the individual control/tag images (before averaging) was evaluated by computing the temporal standard deviation (tStdev) of the ASL difference signal in the ROIs, as motion is the major source of variability in the perfusion-weighted signal across ASL pairs (assuming no significant change in physiology during the scan).Results and Discussion
Examples of PD, PWIs, as well as tStdev decrease and RBF maps of in 3 slices of 3 patients are shown in Fig.2. Descriptive statistics and repeatability measures regarding the RBF estimates obtained using the different processing pipelines are summarised in Fig.3. Image registration was particularly successful in improving the inter-session repeatability of the measurements. The intra-session repeatability without applying image registration was unexpectedly high. Because the SR dataset was acquired only once at the beginning of the scanning session, systematic errors due to consistent misalignment between the SR and the ASL dataset in both ASL runs resulted in a repeatable mean RBF despite severe corruption in the RBF maps in the no-registration case. Ensuring alignment of the SR and ASL datasets was found to be the most challenging step in the pipeline because of their dissimilar contrast (due to the use of BS in the ASL scans), in particular in patients 4 and 5 (Fig. 4). We therefore would recommend acquiring a SR dataset (~1min using our acquisition protocol) immediately before/after the ASL acquisition, to minimise the likelihood of significant motion between acquisitions, particularly in challenging patient populations such as the one in this study. Registration of the BS control/tag time series (unaveraged data) was feasible, despite reduced tissue contrast, as seen by significant decrease in the tStdev of the ASL difference signal in the ROIs (decrease of 15.7±11.2% (two-tailed paired t-test, p<0.001), range=0.4-37.8%).Conclusion
We have combined a robust ASL acquisition technique (single-shot 3D readout with multiple averages), with a dedicated image registration pipeline and obtained reproducible RBF estimates in the first study applying ASL to a paediatric cohort of patients with CKD.Acknowledgements
The authors would like to thank Kidney Research UK (www.kidneyresearchuk.org) for funding this work. Part of this work was supported by the National Institute for Health Research University College London Hospitals Biomedical Research Centre. DLT is supported by the UCL Leonard Wolfson Experimental Neurology Centre (PR/ylr/18575).References
[1] Alsop, D., Arterial spin labeling: its time is now, MAGMA, 25, 75-77, 2012 [2] Alsop, D., et. al., Recommended implementation of arterial spin-labeled perfusion MRI for clinical applications: A consensus of the ISMRM perfusion study group and the European consortium for ASL in dementia, MRM, 73, 102-116, 2014 [3] Robson, P., et. al., Strategies for reducing respiratory motion artifacts in renal perfusion imaging with arterial spin labeling, MRM, 61, 1374-1387, 2009 [4] Gardener, A., et. al., Multislice perfusion of the kidneys using parallel imaging: Image acquisition and analysis strategies, MRM, 63,1627-1636, 2010 [5] Tanenbaum, A., et. al., A method for reducing the effects of motion contamination in arterial spin labeling magnetic resonance imaging, JCBFM, 35, 1697-1702, 2015 [6] Klein, S., et. al., A Toolbox for Intensity-Based Medical Image Registration, IEEE TMI, 29, 196-205, 2010 [7] Song, R. et. al., Improved renal perfusion measurement with a dual navigator-gated Q2TIPS fair technique, MRM, 64, 1352-1359, 2010;Figures
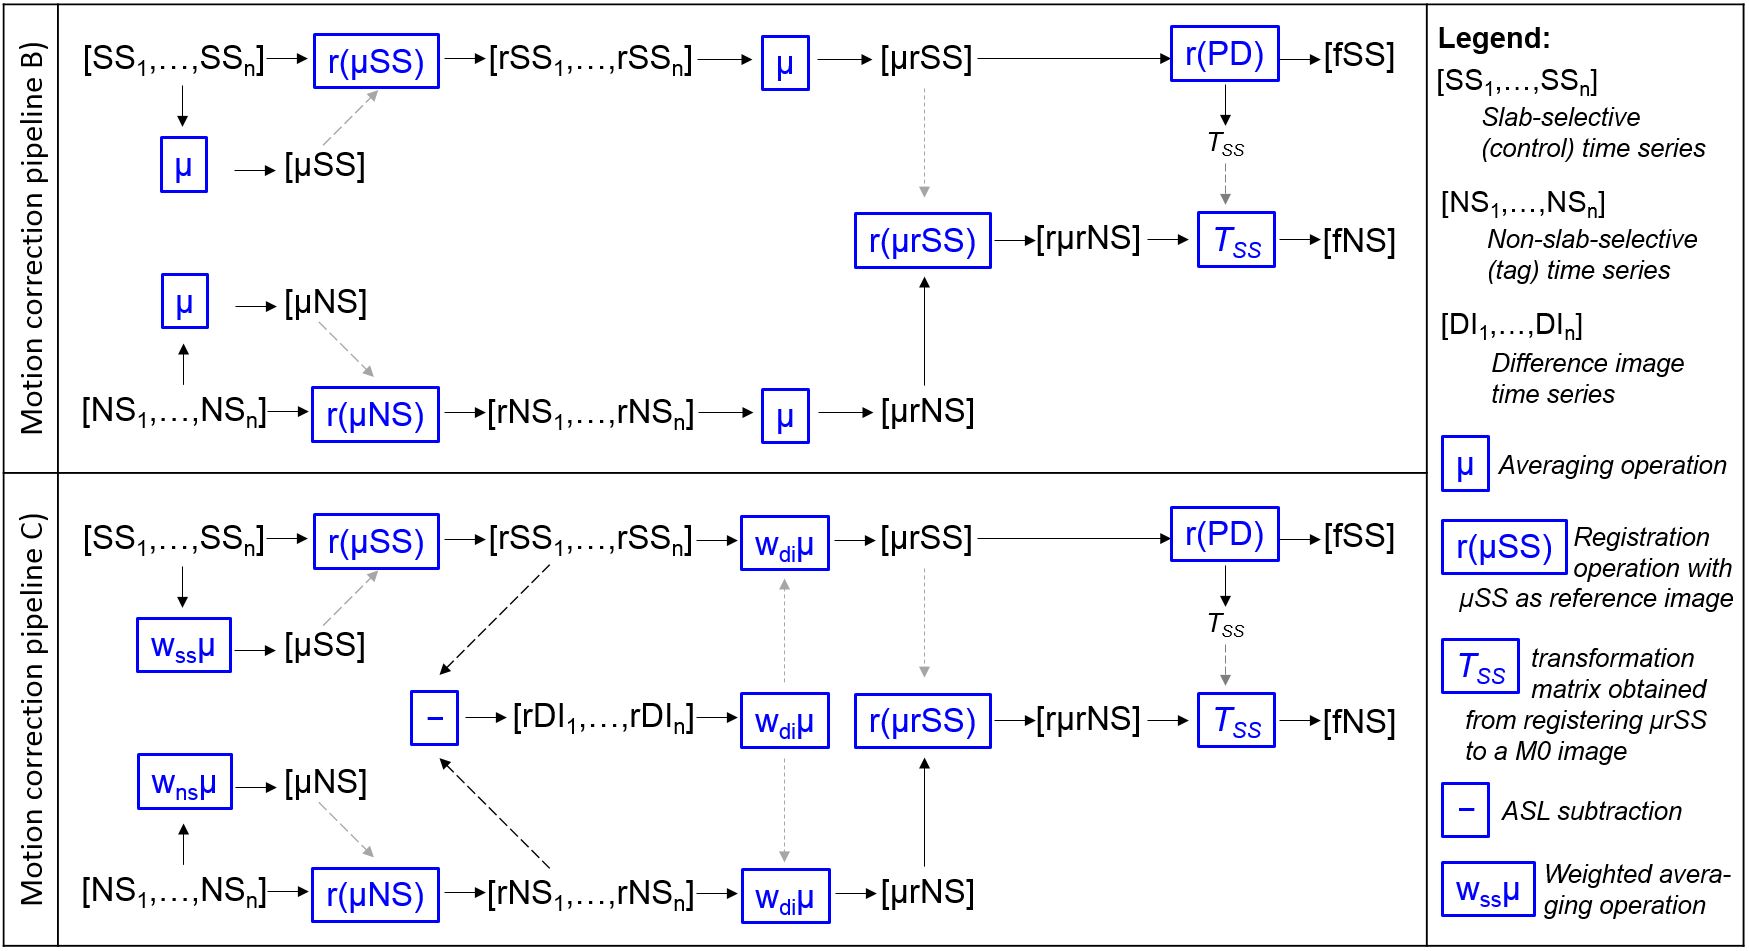
Fig.1 Motion correction pipelines. The main difference
between the two is that in motion correction pipeline C), all image averaging
steps were performed assigning weights to each of the individual images
(smaller weights for individual images which deviate more from the unweighted
average of the scans).
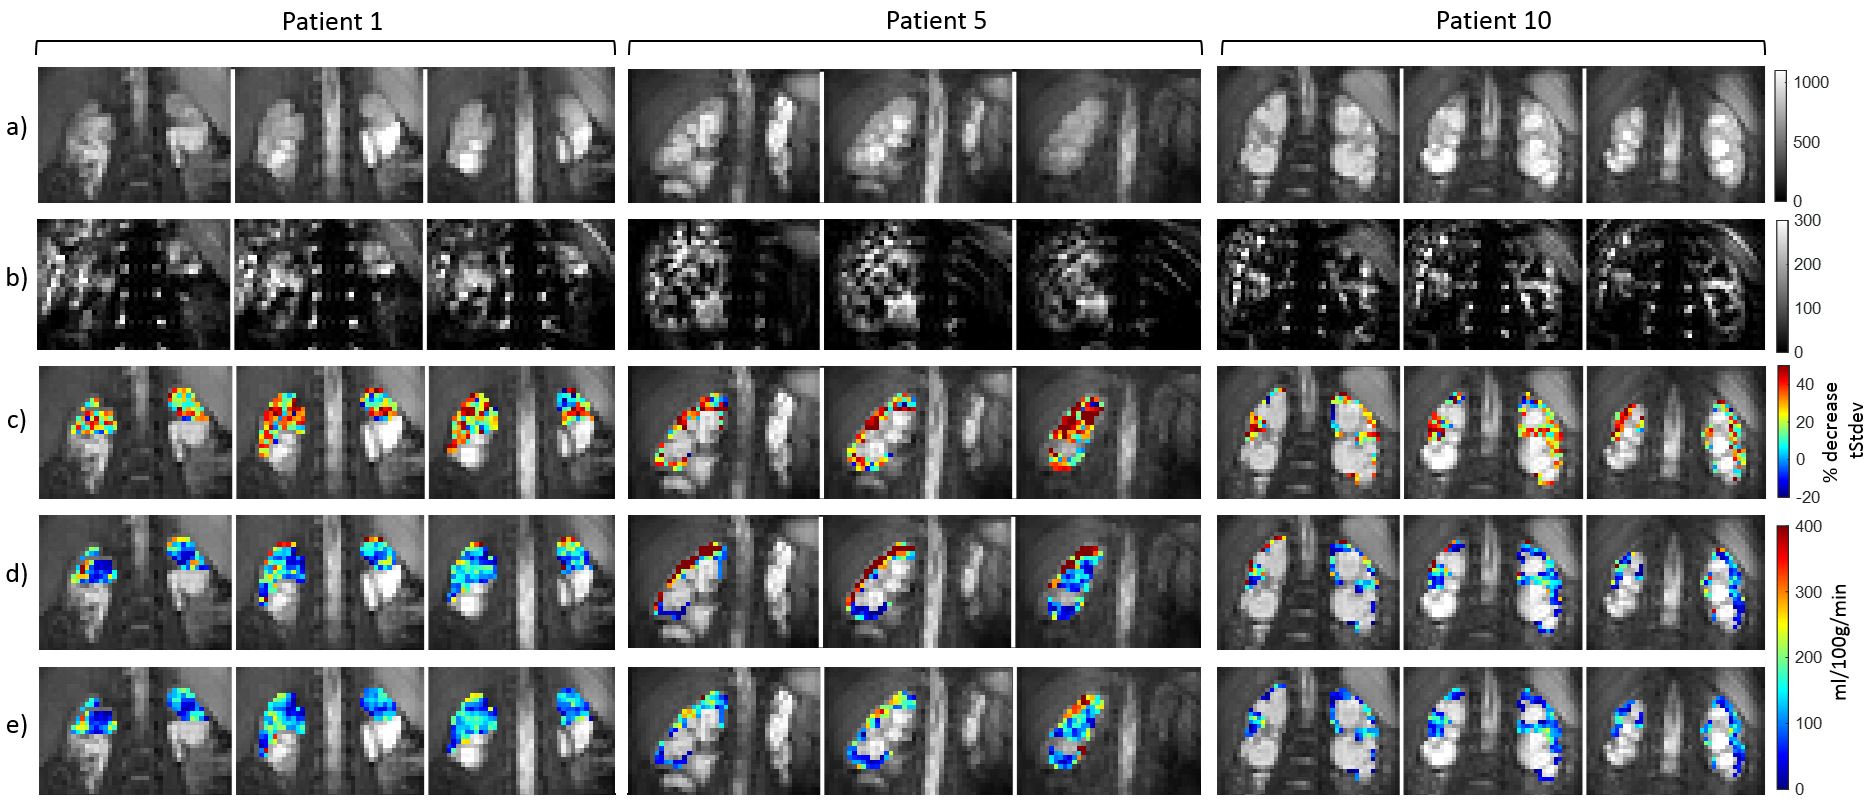
Fig.2 a) Proton-density (PD) images; b) Averaged ASL
perfusion weighted images (using pipeline B); c) Relative decrease in temporal
standard deviation maps due to registration (in %); d),e) RBF maps in the
functional renal parenchyma ROIs using pipeline A (no registration) and
pipeline B (registration only), respectively. Image registration was successful
in reducing boundary artefacts, mostly arising from misregistration of the
M0/T1 maps resulting from the SR fits and the ASL datasets.
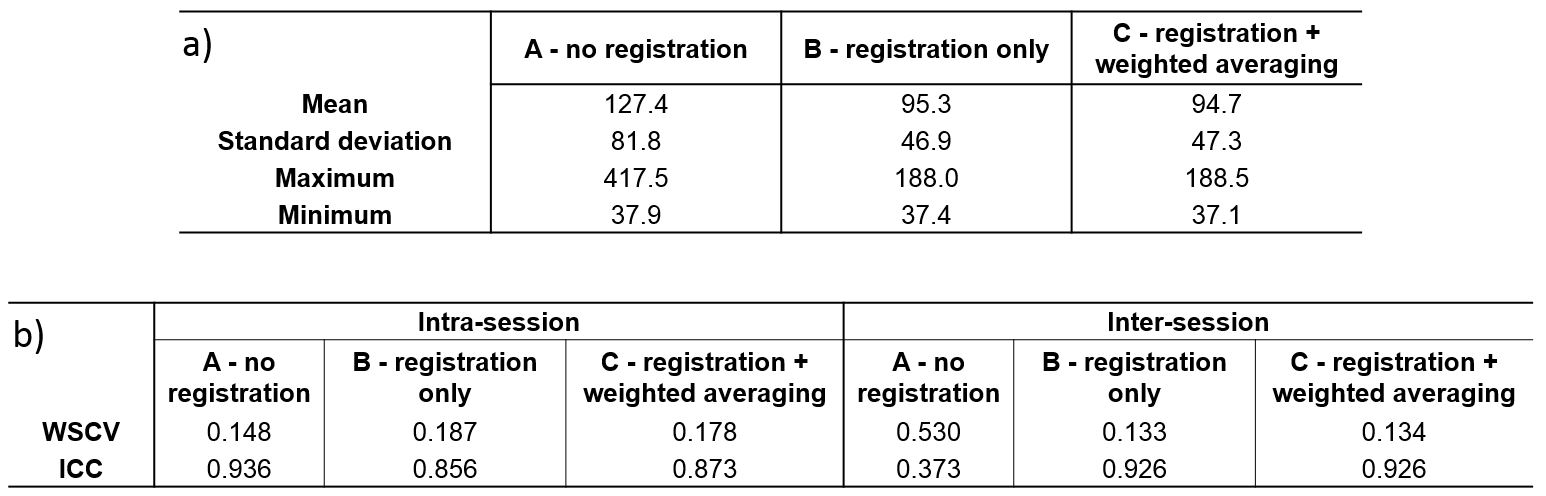
Fig.3 a) Descriptive
statistics across the whole cohort (all days/runs) for different processing
pipelines (all values in ml/100g/min) b) Repeatability measures for different
processing pipelines – WSCV: within-subject coefficient of variation = ratio
between within-subject standard deviation and the mean; ICC: intraclass
correlation coefficient
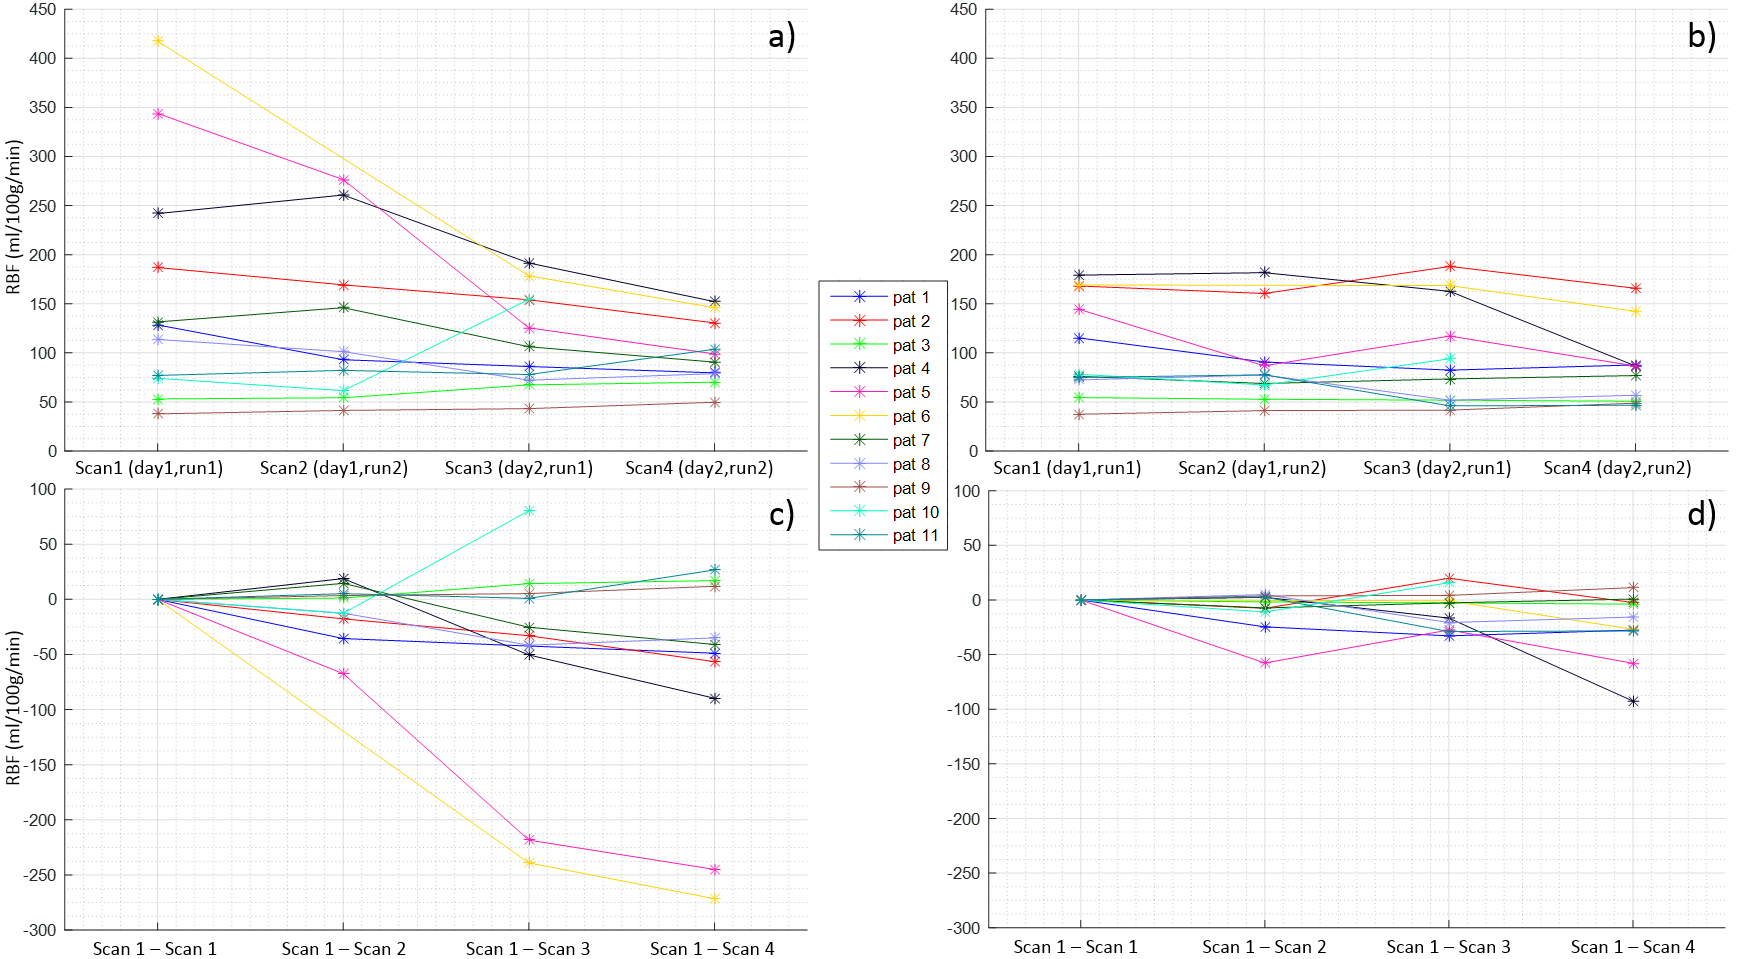
Fig.4 Renal blood flow
(RBF) plots in all scans for each patient a) Absolute values without
registration; b) Absolute values with registration (processing pipeline B); c)
RBF changes relative to the first scan without registration; d) RBF changes
relative to the first scan with registration (processing pipeline B). For
simplicity, corresponding plots using pipeline C not shown (results comparable
to pipeline B). Note that Scan2 of patient 6 was excluded from all analyses
(fat saturation failure) as well Scan4 of patient 10 due to respiratory
triggering failure (respiratory belt stopped tracking due to extreme motion
from the patient)