1886
Pseudo-continuous arterial spin labeling considerations in patients with sickle cell anemia1Radiology and Radiological Sciences, Vanderbilt University Medical Center, Nashville, TN, United States, 2Pediatrics - Division of Pediatric Neurology, Vanderbilt University Medical Center, Nashville, TN, United States, 3Medical Scientist Training Program, Vanderbilt University, Nashville, TN, United States
Synopsis
Pseudo-continuous arterial spin labeling (pCASL) MRI involves labeling of flowing arterial blood water; therefore, the flow velocity of the blood water affects the efficiency of pCASL labeling. This effect has been quantified in healthy subjects but has not been examined in adults with sickle cell anemia (SCA). In this study, we illustrate that cervical flow velocities are elevated in adults with SCA, resulting in a reduced pCASL labeling efficiency of 0.72, and errors associated with this phenomenon are more than twice as large as those associated with bolus arrival time variability when long post-labeling delays times are used.
Introduction
Pseudo-continuous arterial spin labeling (pCASL) is an MRI technique for quantitative cerebral blood flow (CBF) mapping that is becoming increasingly popular in studies of sickle cell anemia (SCA)1,2. pCASL utilizes flow-driven arterial blood water labeling, and flow velocity has a well-known and demonstrable effect on the efficiency of pCASL labeling3. Here, we investigate errors associated with (i) labeling efficiency, (ii) bolus arrival time (BAT) variation, and (iii) kinetic model choice in patients with SCA. Results are interpreted in the context of arterial blood velocity elevations secondary to vasculopathy, as well as limitations of existing recommended pCASL kinetic models for CBF determination. The overall hypothesis is that in patients with variable arterial flow velocities, which could be due to vasculopathy or altered cardiac output, labeling efficiency, and not BAT, is the dominant error source in pCASL and personalized labeling efficiencies should be incorporated into analysis.Methods
Experiment. SCA adults (n=19) and age- and race-matched controls (n=7), provided informed consent and were scanned at 3T (Philips Achieva). T1-weighted images were acquired using an MPRAGE sequence (TR/TE=8.2/3.7 ms; spatial resolution=1x1x1 mm3). Single-PLD pCASL data were acquired with Hanning-windowed RF pulses and post-labeling delay (PLD)=1900 ms (spatial resolution=3x3x7 mm3; TR/TE = 3675/13 ms; averages=20). In all control participants and a subset (n=8) of SCA participants, multi-PLD pCASL data were acquired with PLD=100, 400, 700, 1000, 1300, 1600, and 1900 ms for BAT determination. Single-slice phase contrast angiography (PC) data were acquired3,4 at the approximate level of the pCASL labeling plane for the left and right internal carotid (ICA) and vertebral arteries with in-plane spatial resolution=0.5x0.5 mm2.
Analysis. Mean flow velocities were computed for each of the four vessels-of-interest. Total blood flow was computed as the product of the mean velocities in and cross-sectional areas of the ICAs and vertebral arteries. Brain parenchymal mass was derived as the product of parenchymal volume, measured from brain-extracted T1-MR images, and brain density=1.06g/mL2. Parenchymal CBF (CBFPC) was computed from the PC data as the total blood flow (ml/min) normalized by the parenchymal mass (g). pCASL labeling efficiencies were then calculated by requiring that the CBF computed using PC and pCASL (using a 3-stage kinetic model5) be identical. BATs were computed for all participants with multi-PLD data using kinetic model fitting with the BASIL tool (FSL Toolbox, FMRIB). The mean BAT for controls and SCA adults was used along with the 3-stage model to simulate expected differences in pCASL due to BAT variations. A Wilcoxon rank-sum test was applied to determine differences in study measurements at two-sided significance level of 0.05.
Results
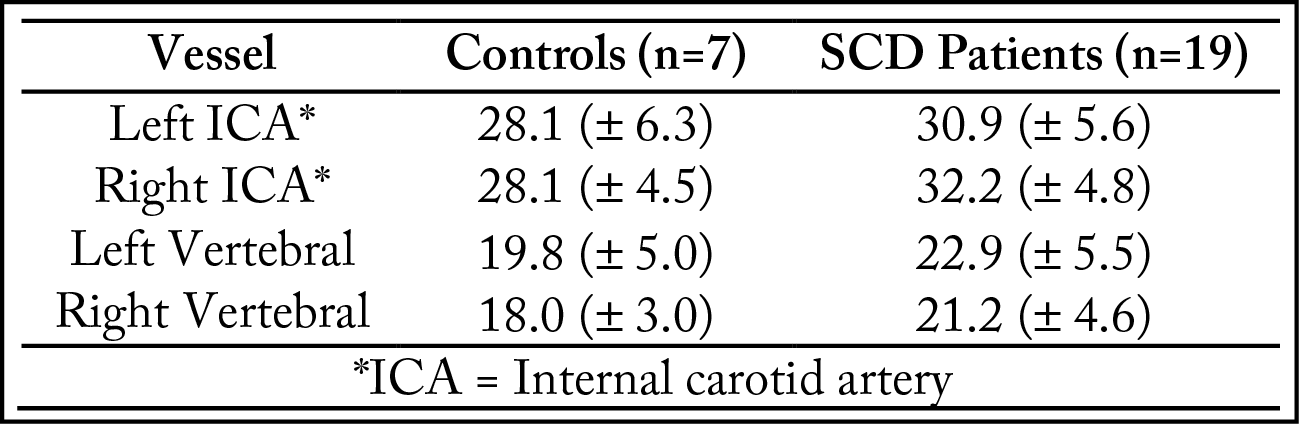
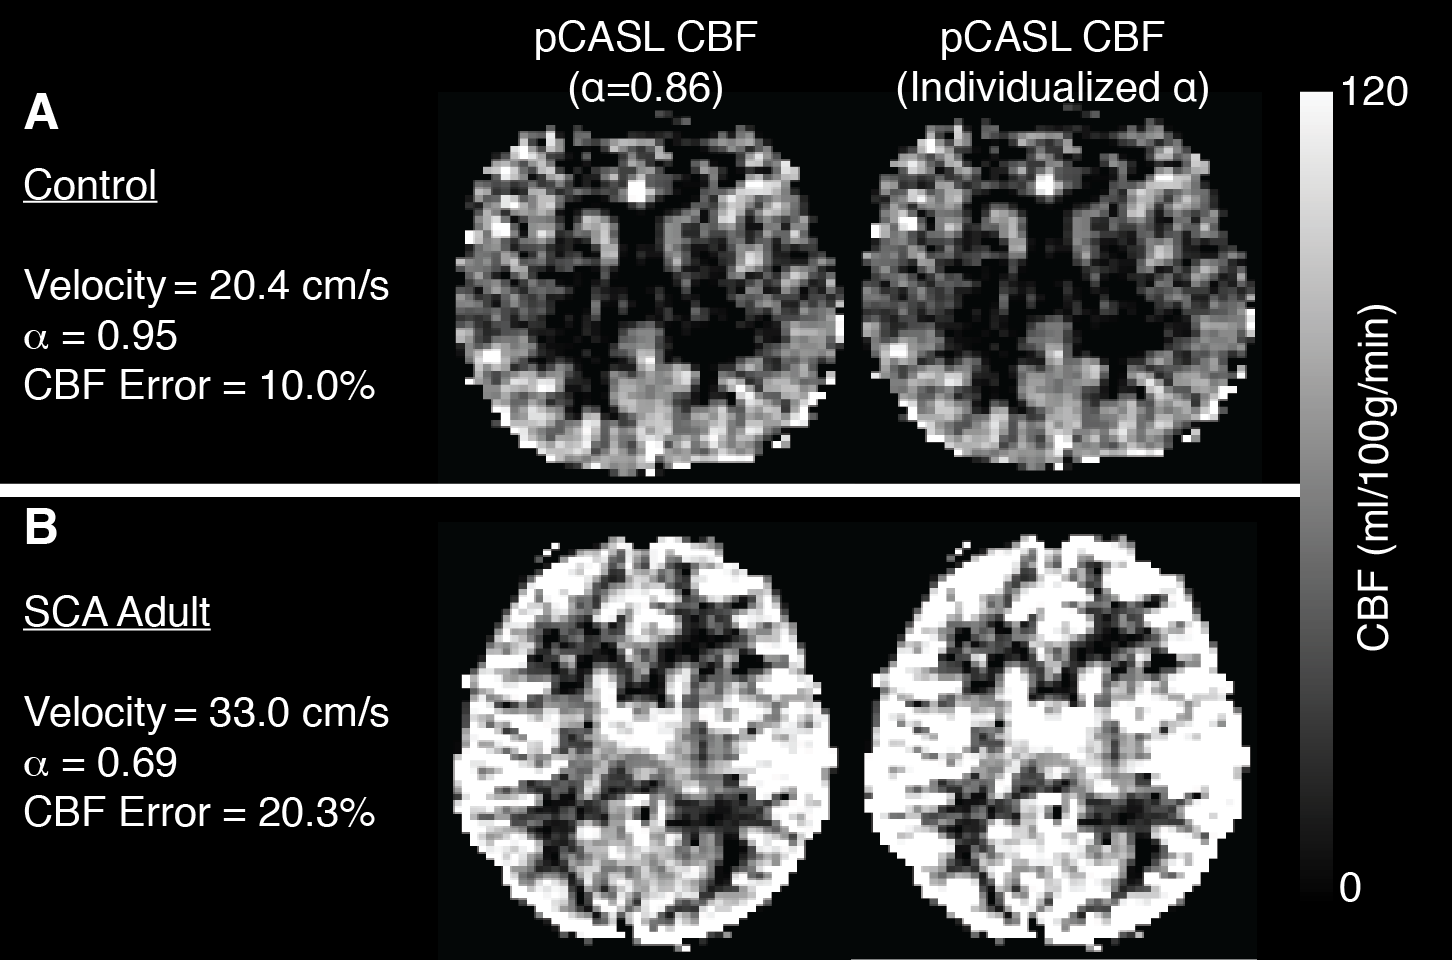
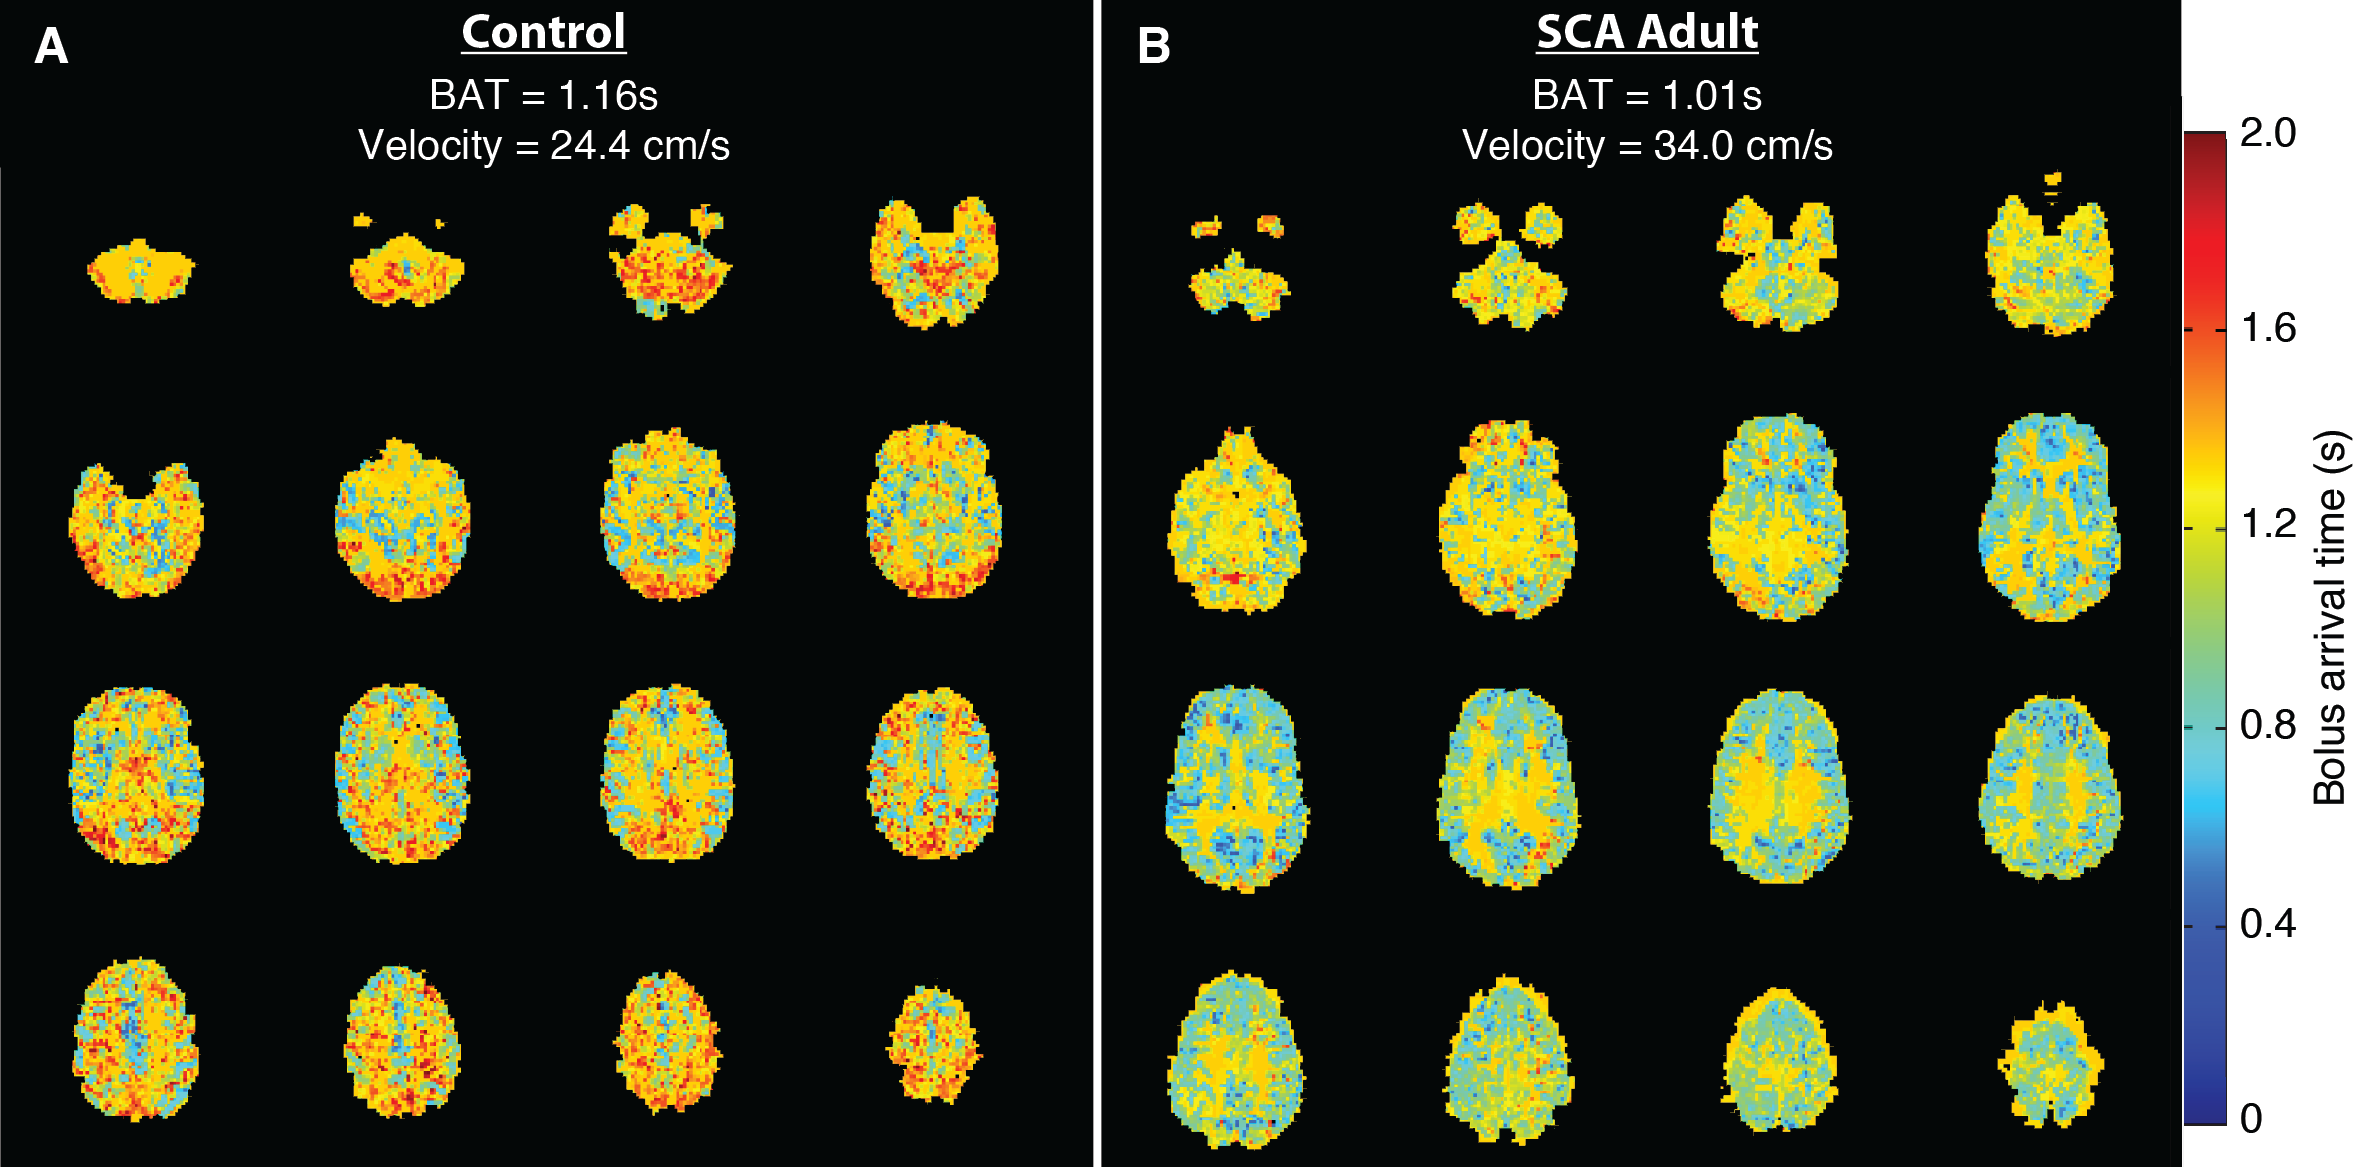
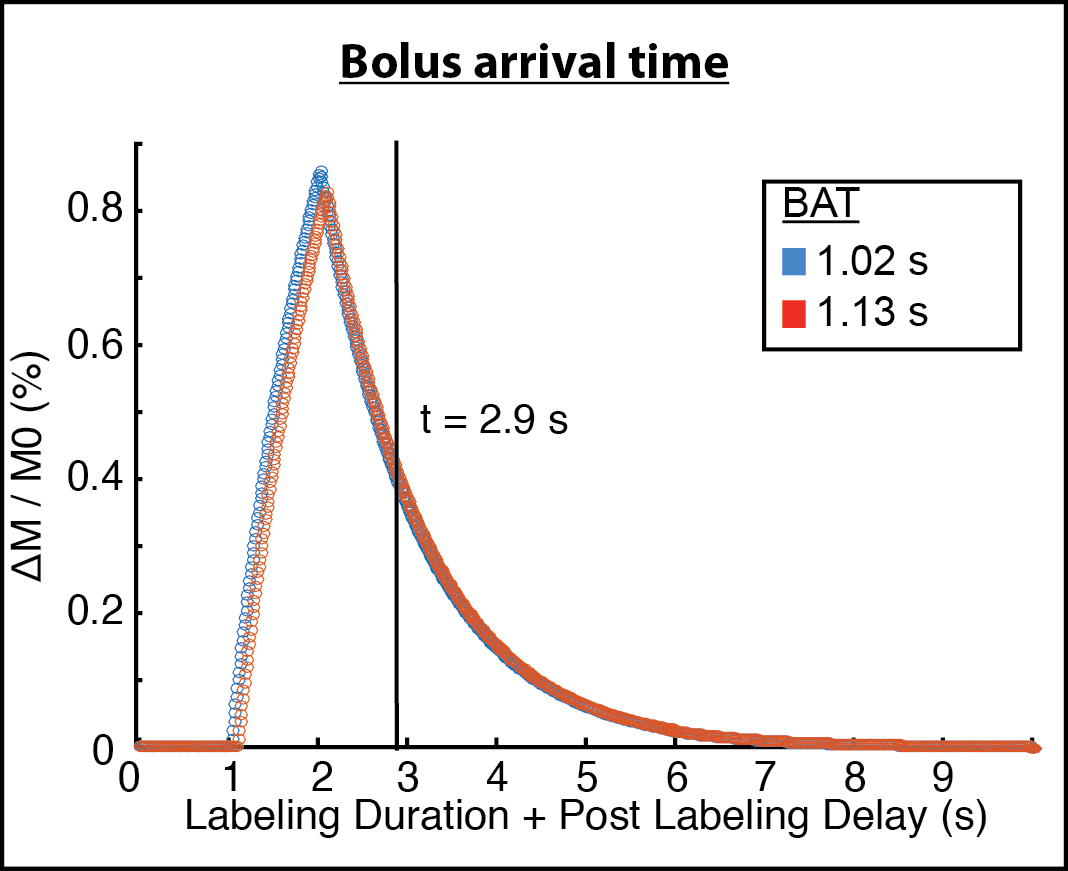
ICA flow velocities were significantly (p<0.05) elevated and vertebral artery flow velocities were marginally (p=0.06) elevated in adults with SCA compared to controls (Figure 1). The mean±standard deviation pCASL labeling efficiency was 0.91±0.13 for the control group and 0.72±0.16 for the SCA adult group (p<0.01). The mean±standard deviation of the absolute percent-error of pCASL with suboptimal labeling efficiency (α=0.86) compared to CBFPC was 13.4%±7.2 for controls and 22.5%±10.4 for SCA adults (p<0.05). The effect of such errors on CBF maps is shown in Figure 2. The mean±standard deviation of global gray matter BAT values (Figure 3) was 1.13±0.06s for controls and 1.02s±0.09s for SCA adults (p<0.01). The simulated difference (Figure 4) in pCASL signal with PLD=1900 ms was approximately 3% when utilizing these BAT values. Finally, the mean CBF value in SCA adults when utilizing a simplified model6 was 59.3±9.44 ml/100g/min compared to 96.6±15.98 ml/100g/min when utilizing the 3-stage model5, an underestimation of approximately 40%.Discussion
Flow velocity of cervical arterial blood water affects the efficiency of pCASL labeling in healthy subjects3. In this study, we illustrate that cervical flow velocities are elevated in adults with SCA, resulting in reduced pCASL labeling efficiencies. Furthermore, we demonstrate that the resulting error cannot be attributed to differences in BAT alone. Since the differences between T1 of blood and T1 of tissue are exaggerated in SCA adults (due to lower hematocrit), the use of the 3-stage model5 as opposed to the simplified model6, which equates blood and tissue water T1, is more appropriate. It is possible to correct for the effect of flow velocity differences on pCASL-derived CBF maps during acquisition with vessel-encoded pCASL7 and vessel-specific pulse train B1.Conclusion
We illustrate that cervical flow velocities are elevated in adults with SCA, resulting in a reduced pCASL labeling efficiency of 0.72, and errors associated with this phenomenon are more than twice as large as those associated with bolus arrival time variability when long post-labeling delays times are usedAcknowledgements
No acknowledgement found.References
1. Jordan LC, Gindville MC, Scott AO, et al. Non-invasive imaging of oxygen extraction fraction in adults with sickle cell anaemia. Brain. 2016;139:738-75.
2. Vaclavu L, van der Land V, Heijtel DF, et al. In vivo t1 of blood measurements in children with sickle cell disease improve cerebral blood flow quantification from arterial spin-labeling mri. AJNR Am J Neuroradiol. 2016.
3. Aslan S, Xu F, Wang PL, et al. Estimation of labeling efficiency in pseudocontinuous arterial spin labeling. Magn Reson Med. 2010;63:765-771.
4. Borzage MT, Bush AM, Choi S, et al. Predictors of cerebral blood flow in patients with and without anemia. J Appl Physiol (1985). 2016;120:976-981.
5. Buxton RB, Frank LR, Wong EC, et al. A general kinetic model for quantitative perfusion imaging with arterial spin labeling. Magn Reson Med. 1998;40:383-396.
6. Alsop DC, Detre JA, Golay X, et al. Recommended implementation of arterial spin-labeled perfusion mri for clinical applications: A consensus of the ismrm perfusion study group and the european consortium for asl in dementia. Magn Reson Med. 2015;73:spcone.
7. Wong EC. Vessel-encoded arterial spin-labeling using pseudocontinuous tagging. Magn Reson Med. 2007;58:1086-1091.
Figures