1885
Arterial spin labelling measurements of cortical perfusion in multiple sclerosis show widespread reduced cortical metabolism1Brain and Mind Centre, University of Sydney, Sydney, Australia, 2Neuroimmunology Clinic, Concord Hospital
Synopsis
Multiple sclerosis (MS) is primarily an inflammatory demyelinating disease of the central nervous system. However, there is also growing evidence that cortical dysfunction may also be associated with disability in MS. Few studies have investigated cortical cerebral perfusion in MS, and even fewer have utilised arterial spin labelling (ASL) MRI, which offers noninvasive quantitative assessment of cerebral function using endogenous contrast. ASL is an inherently low resolution imaging modality known to be affected by the partial volume (PV) effect, leading to an underestimation of grey matter (GM) perfusion. Decreases in GM perfusion could reflect neuronal loss or metabolic dysfunction; PV correction techniques allow decoupling of structure and function. It is hypothesized that reduced regional GM perfusion after PV correction reflects a genuine decreased tissue metabolism, rather than atrophy.
INTRODUCTION
Multiple
sclerosis (MS) is an inflammatory demyelinating disease of the
central nervous system characterized by multifocal white matter (WM) lesions,
visualised on T2-weighted images1. In more recent times, grey matter
(GM) pathology has emerged as an important feature of the disease. GM atrophy
appears to commence early in the disease course and been found to correlate
with disability progression in MS2. There is growing
evidence that cortical dysfunction may be associated with disability in MS3.
Few studies have
investigated cortical cerebral perfusion in MS, fewer still have utilised
arterial spin labeling (ASL) MRI, which offers noninvasive quantitative
assessment of cerebral function. ASL
is an inherently low resolution imaging modality known to suffer from the
partial volume (PV) effect, leading to an underestimation of GM perfusion4.
Decreases in GM perfusion could reflect neuronal loss or metabolic dysfunction;
PV correction techniques allow decoupling of structure and function. It is
hypothesized that reduced regional GM perfusion after PV correction reflects a
genuine decreased tissue metabolism.
This
work is part of an ongoing study of cortical function and structure in
patients with Relapse-remitting MS.
METHODS
12 Relapse-remitting MS patients (8F, 4M aged 24-59Y, mean=40.3Y, EDSS 0-4, mean=2.3, disease duration 0.5-18.6Y, mean=6.1Y ) and 12 control subjects (11F, 1M aged 24-43Y, mean=32.5Y) were imaged on GE MR750 3T scanner with 8 ch head coil. Acquisitions included: T2 FLAIR (TE/TR=162/8000ms, TI= 2181ms, resolution = 0.47x0.47x0.6 mm3, IR-SPGR (TE/TR=2.8/7.1 ms, TI=450 ms, FA=12°, resolution = 0.47x0.47x0.7 mm3), ASL pCASL labeling with 8-arm 3D stack-of-spirals read-out (inflow time=1525 ms, bolus length=1525 ms, resolution=1.88x1.88x5 mm3). Icometrix5 was used to automatically detect and calculate lesion burden for patients, and partial volume tissue maps, whole brain and GM volume estimates (normalised for head size) for all subjects. The proton density and ASL difference images were partial volume corrected in a two step process: the images were first deblurred in the through-plane direction using a Richardson-Lucy deconvolution technique to remove the effect of the point spread function, prior to application of a linear regression algorithm to separate voxel signal into GM, WM and CSF components6. The GM signal from both images were combined using a modified general kinetic model to produce GM cerebral blood flow (CBF) maps7. Five regions of interest were created from a Freesurfer parcellation8, transformed to perfusion space, and mean region GM CBF was calculated for each.RESULTS
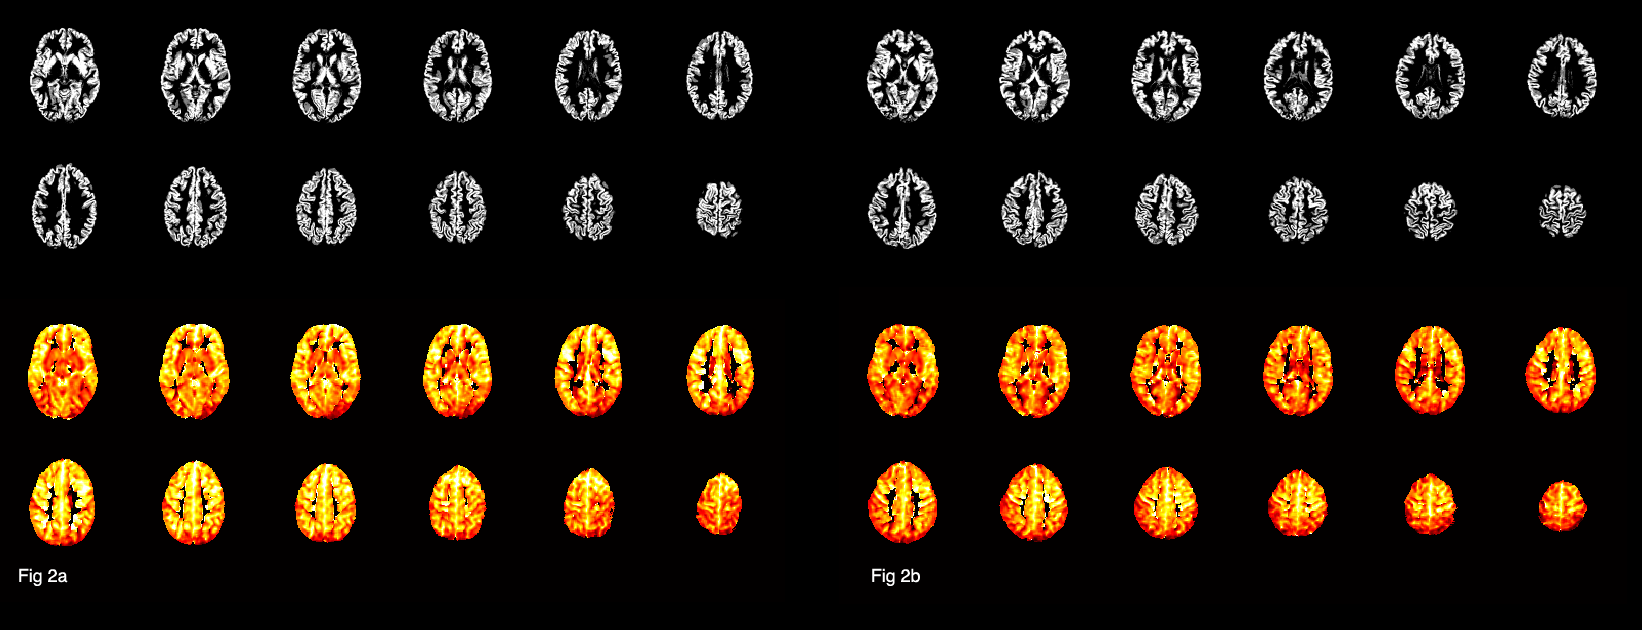
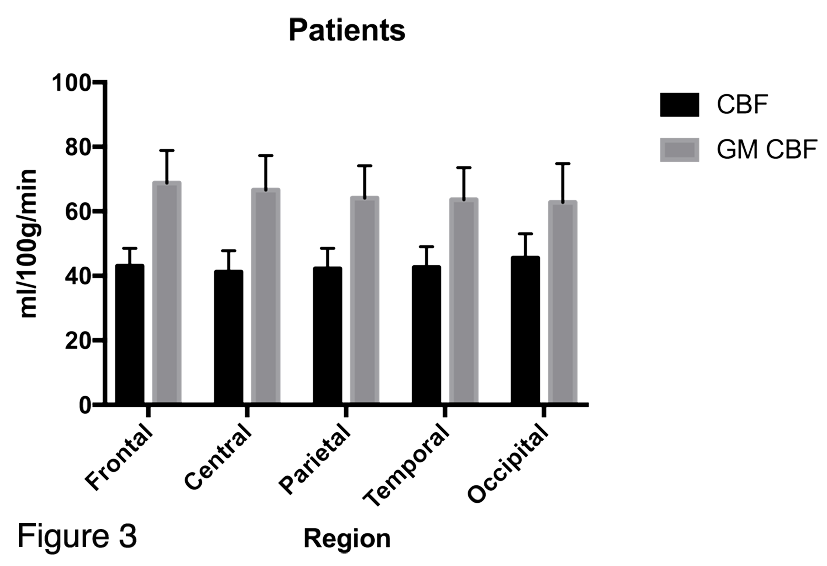
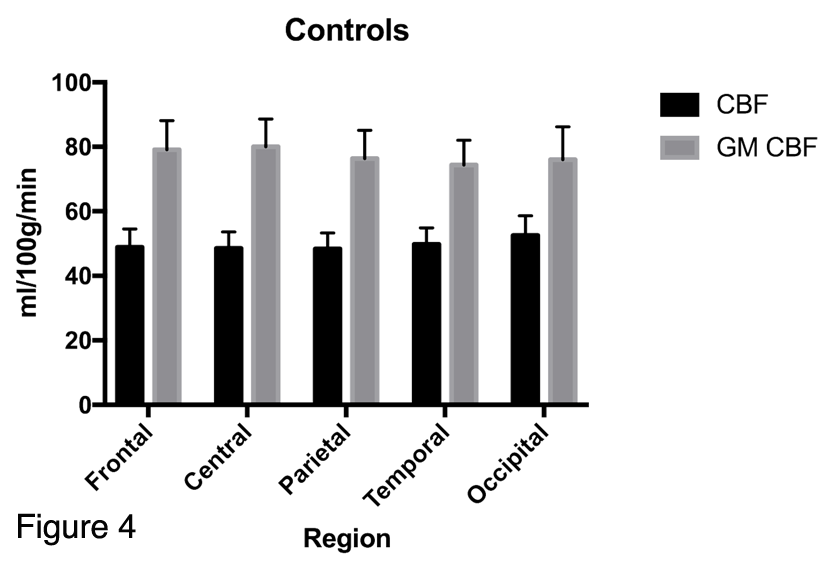
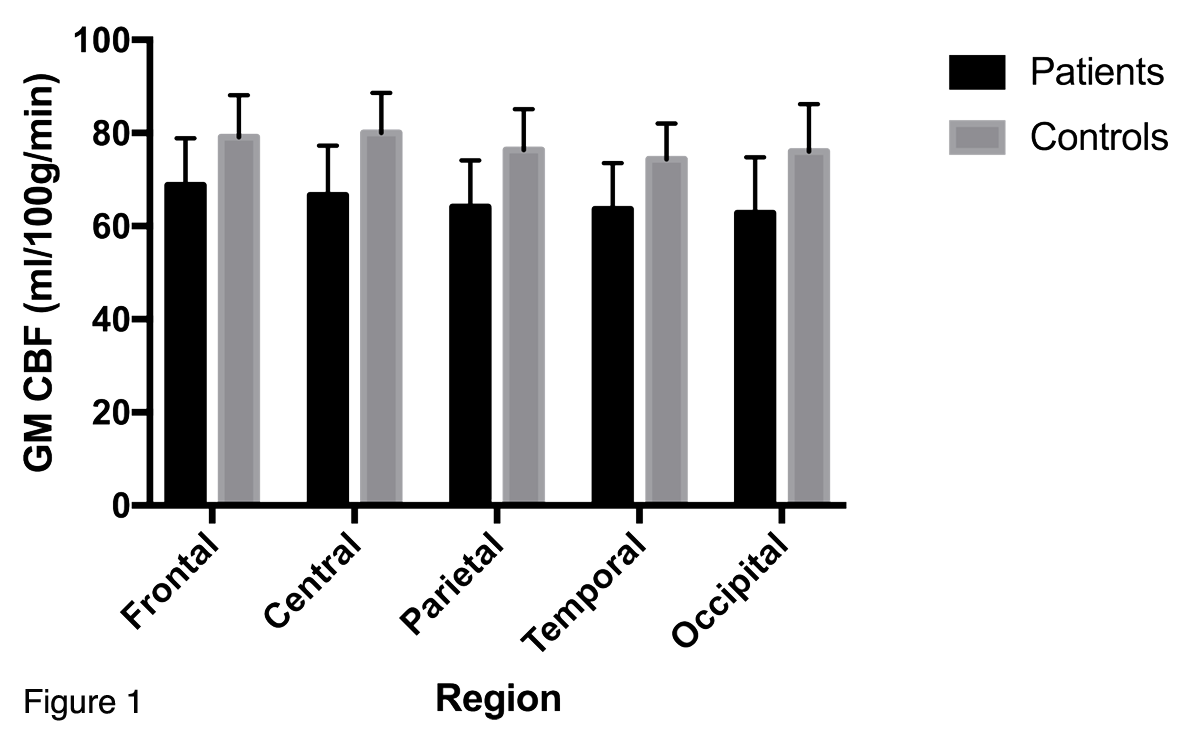
The mean GM CBF was significantly lower in the patient group for every cortical region (see figure 1) compared to the control group, (p<0.0001, unpaired two-tailed t-test): Frontal: 68.8±10.1 v 79.1±9.0, Central: 66.6±10.7 v 80.0±8.6, Parietal: 64.1±10.0 v 76.4±8.7, Temporal: 63.6±9.9 v 74.4, Occipital: 62.8±12.0 v 76.0±10.2. (All units ml/100g/min). Representative GM CBF and corresponding GM PV fraction of a control and patient subject are shown in figure 2, which shows global hypoperfusion for the patient. The ratio of CBF values to GM CBF after correction ranged from 1.53 to 1.62 for controls, and 1.38 to 1.61 for patients, with the lowest value observed in the patient occipital region. The mean GM volume was 944 ml for controls, compared to 886 ml for patients. The difference in GM volume between the two groups was significant (p<0.0002, unpaired two-tailed t-test). Lesion volume ranged from 0.9 to 10.2 ml, with mean of 5.9 ml. Although a trend of decreased GM perfusion with increasing lesion burden is observed, no significant correlation was found between lesion volume and GM CBF, likely reflecting the small sample size.DISCUSSION
Widespread hypoperfusion is observed in the MS group, both before and after PV correction. Interestingly, whilst the occipital cortical region exhibited the highest perfusion for both groups prior to PV correction, post-correction this was the lowest perfused region in the patient group only. This is suggestive of a comparative metabolic dysfunction in this region, only observed after removal of the confounding effect of tissue concentration. This potentially reflects neuronal loss and or dysfunction in the optic radiation, a white matter tract which is an integral part of the visual system and also a common location for MS lesions9. All patients presented with lesions in the optic radiation, 6/14 patients had a history and/or clinical evidence of pathology in the anterior visual pathways. The relationship between lesion volume, location and regional GM CBF is the target of further work as more subjects are recruited to the study.
CONCLUSION
ASL is a promising tool to estimate cortical perfusion. Whilst global hypoperfusion is observed in MS patients, larger longitudinal studies of atrophy and cortical perfusion are needed to ascertain if hypoperfusion precedes or follows neurodegeneration.Acknowledgements
No acknowledgement found.References
1. Shiee N et al, PLoS One 2012 Jan;7(5)
2. Jacobsen C et al, JNNP 2014 Oct;85(10)
3. Debernard L et al, JNNP 2013 Sept;85
4. Asllani I et al, MRM 2008
5. www.icometrix.com
6. Oliver RA et al, Proc ISMRM 2016
7. Buxton R et al, MRM 1998(40)
8. www.freesurfer.net
9. Klistorner A et al, Neurology 2014 82(24)
Figures