1884
White matter cerebral blood flow in a large healthy cohort from the CARDIA study1Department of Radiology, University of Pennsylvania, Philadelphia, PA, United States, 2Department of Neurology, University of Pennsylvania, Philadelphia, PA, United States, 3Division of Epidemiology and Community Health, University of Minnesota, Minneapolis, MN, United States
Synopsis
By analyzing cerebral blood flow (CBF) maps generated from arterial spin labeling (ASL) data averaged across 436 cognitively healthy middle-aged subjects from the CARDIA study, we characterized the CBF distribution in white matter. CBF is specifically decreased in periventricular regions in a pattern not reflective of partial volume effects as estimated from the structural MRI segmentation. White matter lesion frequency mapping based on Fluid Attenuated Inversion Recovery (FLAIR) images from the same cohort demonstrates that lesions tend to occur in regions where group averaged CBF is lowest.
Introduction
Periventricular white matter lesions (PVWML) are nearly ubiquitous with aging,1 and have been considered asymptomatic, but may contribute to age-associated cognitive decline. While cerebral blood flow (CBF) has been shown to be reduced within white matter lesions,2 it is less certain whether ischemia is their cause, in part due to the challenges in quantifying white matter CBF accurately using available methods such as arterial spin labeled perfusion MRI.3 By analyzing CBF maps generated from ASL data averaged across 436 cognitively healthy middle-aged subjects from the Coronary Artery Risk Development in Young Adults (CARDIA) study, we characterized the CBF distribution in white matter and related it to white matter hyperintensity lesion frequency estimated from Fluid Attenuated Inversion Recovery (FLAIR) magnetic resonance images.Methods
Multimodal MRI data from 436 subjects (54% female, age: 50.4±3.5 years) from the CARDIA study were analyzed. This included 2D pseudo-continuous ASL (PCASL) data consisting of 40 label and control pairs with voxel dimensions of 3.4x3.4x5 mm3, labeling duration of 1.48s and postlabeling delay of 1.5s.4 Sagittal 3D FLAIR data was acquired with TR/TE/TI=6000/160/2200 ms, resolution: 1 mm isotropic, 160 slices, matrix 256x220, pixel bandwidth 930Hz/px. Sagittal MPRAGE data was acquired with 1mm isotropic resolution, TR/TE/TI=1900/2.9/900ms, matrix=256x256, slices=176, flip angle=90, GRAPPA=2, and bandwidth=170 Hz/pixel. All data were processed using MATLAB and SPM8.5 CBF maps were generated using ASLtbx6 and a structural correlation and Robust Bayesian (SCRUB) based data cleaning approach.7 White matter lesions were segmented using FLAIR images by the lesion prediction algorithm as implemented in the LST toolbox (www.statistical-modelling.de/lst.html). To assess whether the distribution of CBF may be driven primarily by partial volume effects, anatomical T1 weighted images for each subject were segmented into grey matter (GM), white matter (WM) and cerebro-spinal fluid (CSF) tissue probability maps (TPMs), and “structural pseudo-CBF” maps were constructed for each subject by 50GMTPM+20WMTPM assuming the mean CBF in GM and WM to be 50 and 20 ml/100g/min respectively. CBF maps, WM lesion probabilities, and pseudo-CBF maps for each subject were registered to the MNI template using a DARTEL template,8 and averaged across subjects.Results
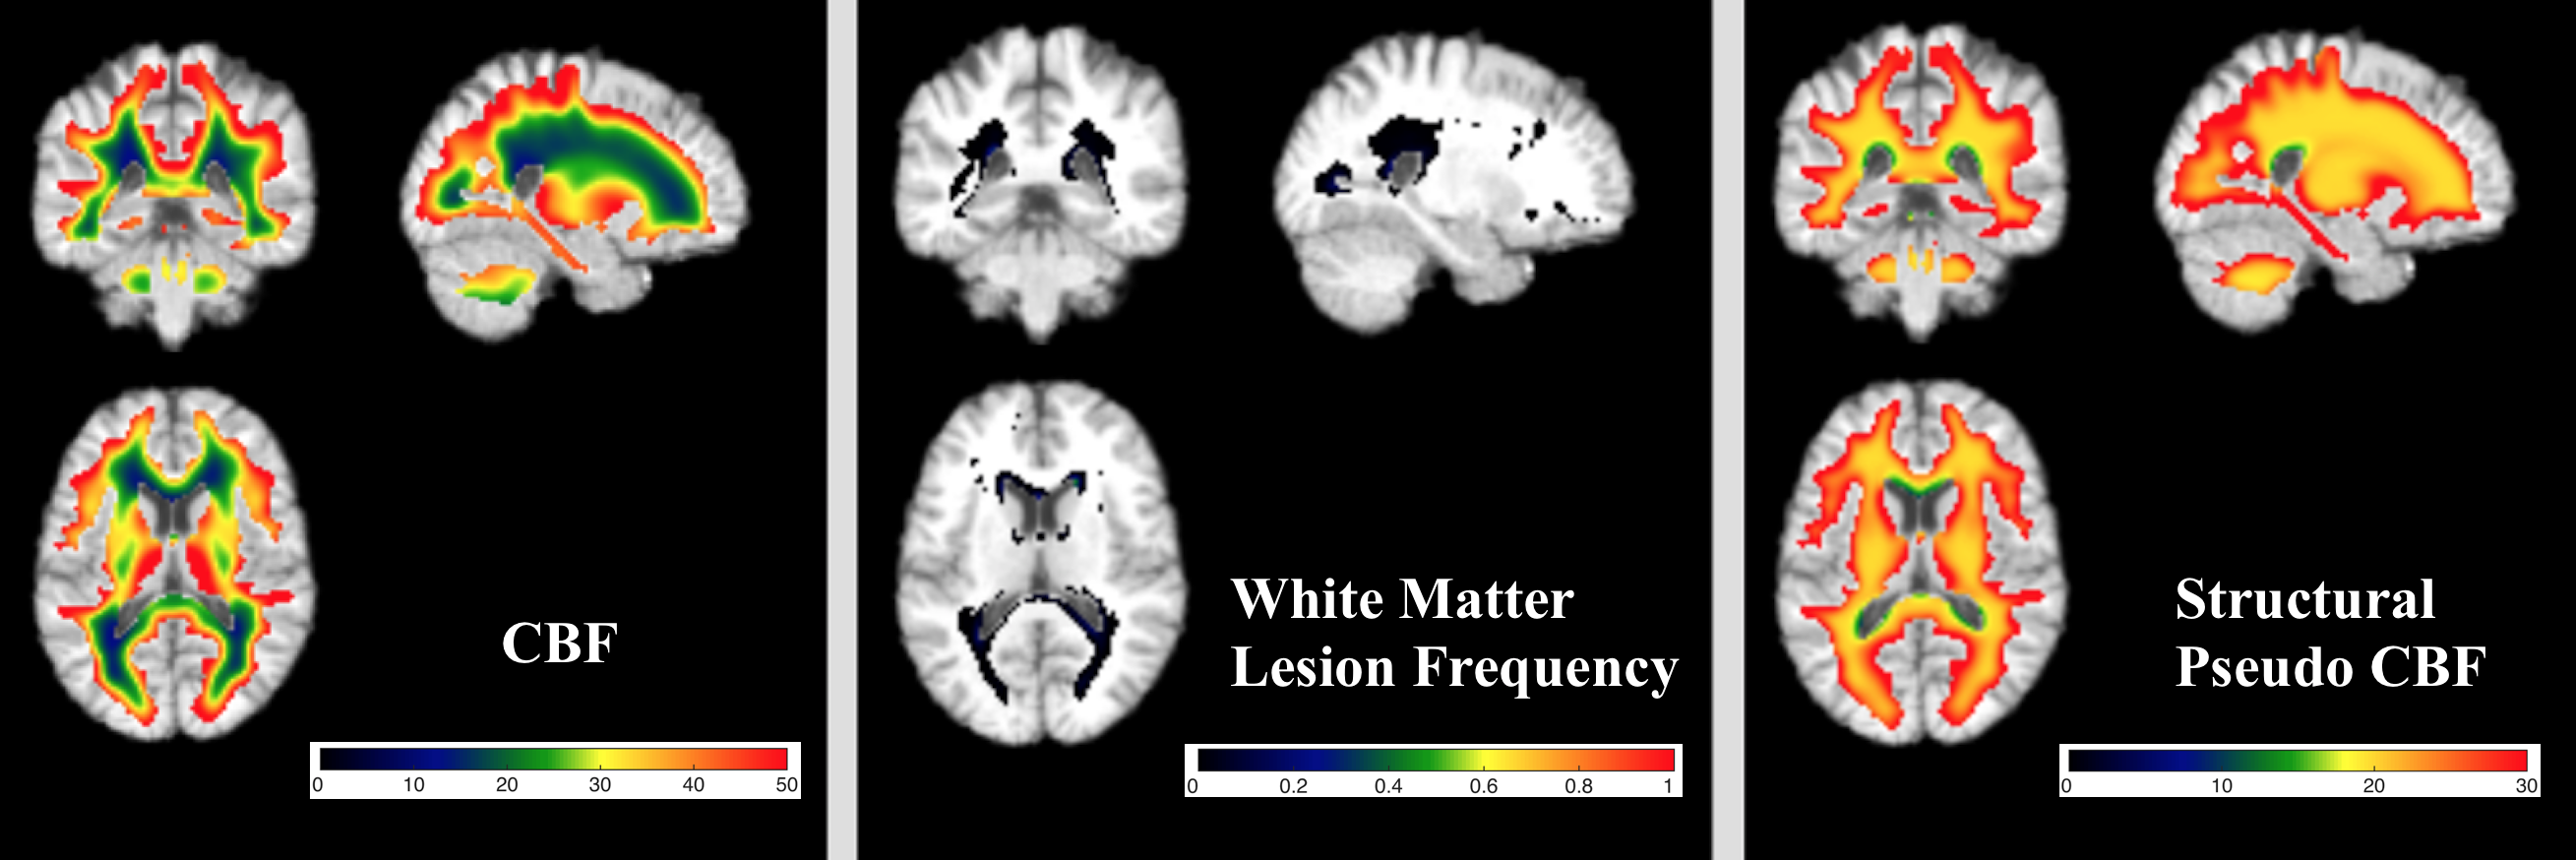
Figure 1 shows the mean maps of CBF, pseudo-CBF, and WM lesion frequency. Both GM and CSF are masked in the figure to show only white matter. WM CBF is specifically decreased in periventricular regions. The lesion frequency map demonstrates that, while lesion frequencies are low, lesions tend to occur in regions where group averaged CBF is lowest. Indeed, 62% of WM lesions occur where CBF is less than 20 ml/100g/min, which is approximately the threshold for ischemic changes in cellular function.9 In addition, the lesion density is 16 times higher in this region of low CBF than region with WM CBF greater than 20.
WM CBF in the pseudo-CBF map is much more homogenously decreased than real CBF suggesting that the observed WM perfusion gradient does not simply reflect partial volume effects. Although the Spearman’s rank correlation between actual and pseudo-CBF is 0.77 (p<<0.001) for the whole white matter showing structural-functional coupling, the correlation is much lower (0.19, p<<0.001) in regions where CBF$$$\leq$$$20 ml/100g/min. This illustrates that the WM perfusion decrease in this region is not driven by the structure. The rank correlation between lesion frequency and actual CBF for this region is -0.45 (p<<0.001) whereas that between lesion frequency and pseudo-CBF is -0.07 (p<<0.001).
Discussion
By averaging ASL CBF data across a large cohort of subjects, the distribution of WM CBF could be defined in excellent detail. The observed WM CBF was found to be highly non-uniform, showing extended regions of reduced perfusion at the “caps” of the lateral ventricles. FLAIR WM lesions were found to coincide with the most poorly perfused regions in the study cohort, and the distribution of the lowest CBF values also matched WM lesion frequency maps derived from other data sets.10 These findings are consistent with the notion that PVWMLs are ischemic in etiology,11 likely reflecting the accumulated effects of chronic subthreshold CBF over many years. While, markedly improved ASL MRI sensitivity will be required to quantify WM CBF in individual subjects, patterns of WM CBF change can already be successfully assessed in cohort studies.Conclusion
CBF in the white matter is lower in the periventricular region and the distribution of the largest CBF reductions is similar to the distribution of white matter hyperintensities. WM CBF is a potential therapeutic target for age-associated cognitive decline.Acknowledgements
NIH grants R01 MH080729 and P41 EB015893 and Coronary Artery Risk Development in Young Adults (CARDIA) study.References
1. Yue NC, Arnold AM, Longstreth WT, Jr., et al. Sulcal, ventricular, and white matter changes at MR imaging in the aging brain: data from the cardiovascular health study. Radiology. 1997;202(1): 33-39.
2. Brickman AM, Zahra A, Muraskin J, et al. Reduction in cerebral blood flow in areas appearing as white matter hyperintensities on magnetic resonance imaging. Psychiatry Research. 2009;172(2):117-120.
3. Detre JA, Leigh JS, Williams DS, Koretsky AP. Perfusion imaging. Magnetic resonance in medicine. 1992;23(1):37-45.
4. Dolui S, Wang Z, Wang DJ, et al. Comparison of non-invasive MRI measurements of cerebral blood flow in a large multisite cohort. Journal of cerebral blood flow and metabolism. 2016; 36(7):1244-56.
5. http://www.fil.ion.ucl.ac.uk/spm/software/spm8/.
6. Wang Z, Aguirre GK, Rao H, et al. Empirical optimization of ASL data analysis using an ASL data processing toolbox: ASLtbx. Magnetic resonance imaging. 2008;26(2):261-269.
7. Dolui S, Wolk DA, Detre JA. SCRUB: A Structural Correlation and Empirical Robust Bayesian Method for ASL Data. Proceedings of the International Society of Magnetic Resonance in Medicine; 2016.
8. Ashburner J. A fast diffeomorphic image registration algorithm. NeuroImage 2007;38(1):95-113.
9. Heiss WD. Ischemic penumbra: evidence from functional imaging in man. Journal of cerebral blood flow and metabolism. 2000;20(9):1276-1293.
10. Habes M, Erus G, Toledo JB, et al. White matter hyperintensities and imaging patterns of brain ageing in the general population. Brain. 2016;139:1164-1179.
11. Fernando MS, Simpson JE, Matthews F, et al. White matter lesions in an unselected cohort of the elderly: molecular pathology suggests origin from chronic hypoperfusion injury. Stroke. 2006;37(6):1391-1398.
Figures