1883
Regional Heterogeneity in Moyamoya Disease: Discovering Local Arterial Transit Time Information from Single-Delay Arterial Spin Labeling1Radiology, Stanford University, Stanford, CA, United States
Synopsis
Arterial transit information provides valuable diagnostic information in steno-occlusive pathologies. We propose deriving transit information from the regional spatial heterogeneity (ReHet) of standard single-delay pseudo-continuous arterial spin labeling difference images. With image processing and machine learning, we demonstrate the potential of this technique in identifying regions with slow arterial flow in pre-operative Moyamoya disease patients. We investigate a selection of 7 different ReHet metrics, and identify trends that will inform better design of ReHet metrics and machine learning models.
Purpose
In steno-occlusive pathologies such as Moyamoya disease, arterial transit time (ATT) supplements cerebral blood flow (CBF) mapping, and assesses the strength of collateral networks 1. Single-delay arterial spin labeling (ASL) is a current standard sequence for assessing CBF. Due to its “snapshot” view, we cannot tell if a “low-CBF” region is really hypoperfused or has long transit delay. Therefore, areas with heterogeneous signal may reflect long arrival times. Here, we expand upon a proof-of-concept study 2 to propose a novel technique that derives local arterial transit information by producing Regional Heterogeneity (ReHet) maps calculated from the single-delay ASL difference images, in conjunction with image processing and machine learning.Methods
28 pre-operative Moyamoya disease patients (ages 40±13y, 23 F) were scanned with informed consent and IRB approval, at 3.0T (MR750W, GE Healthcare). We performed single-delay 3D pseudo-continuous ASL (pcASL: TE/TR 10.5/4844ms, TL/PLD 1500/2000ms, resolution 3×3×4mm3, whole-brain coverage) for ReHet analysis. Gold-standard ATT and transit-adjusted CBF maps were measured using multi-delay pcASL 3 (TR/TE 6518/25.1ms, label time 2000ms, 5 equally spaced PLDs 700-3000ms, resolution 3×3×4mm3, 36 axial slice). Whole-brain T1-weighted 3D IR-FSPGR provided anatomic information.
Non-transit-adjusted CBF maps were automatically generated from single-delay pcASL images. Gold-standard CBF and ATT maps were generated from multi-delay pcASL images 3. Subsequent analyses were performed using Matlab (Mathworks, Natick MA), FSL (FMRIB, Oxford, UK), Stata (StataCorp, College Station TX) and Python. All pcASL images, ATT and CBF maps were first coregistered to T1-weighted anatomical images using FSL FLIRT, and then coregistered to MNI152 space using T1-weighted templates with 2mm isotropic resolution and smoothed by a 8mm FWHM Gaussian filter. Grey matter (GM) and white matter (WM) were segmented from the T1-weighted images using FSL BET and FAST.
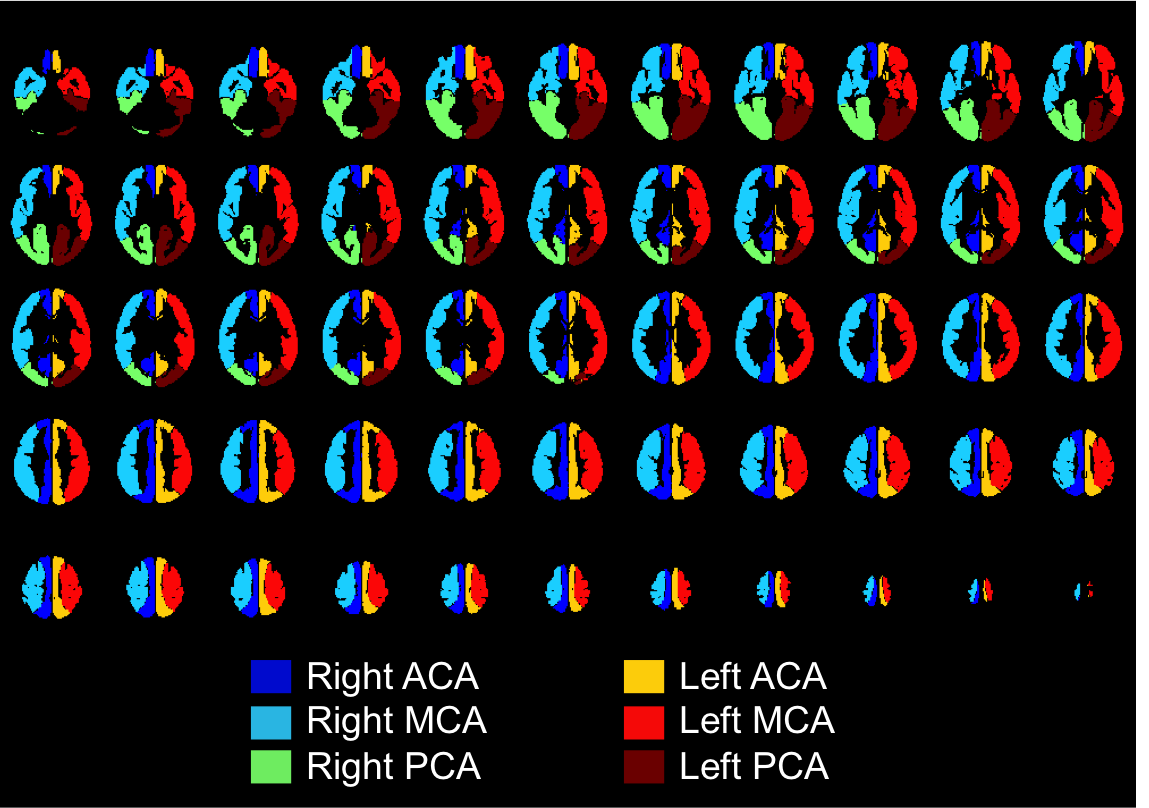
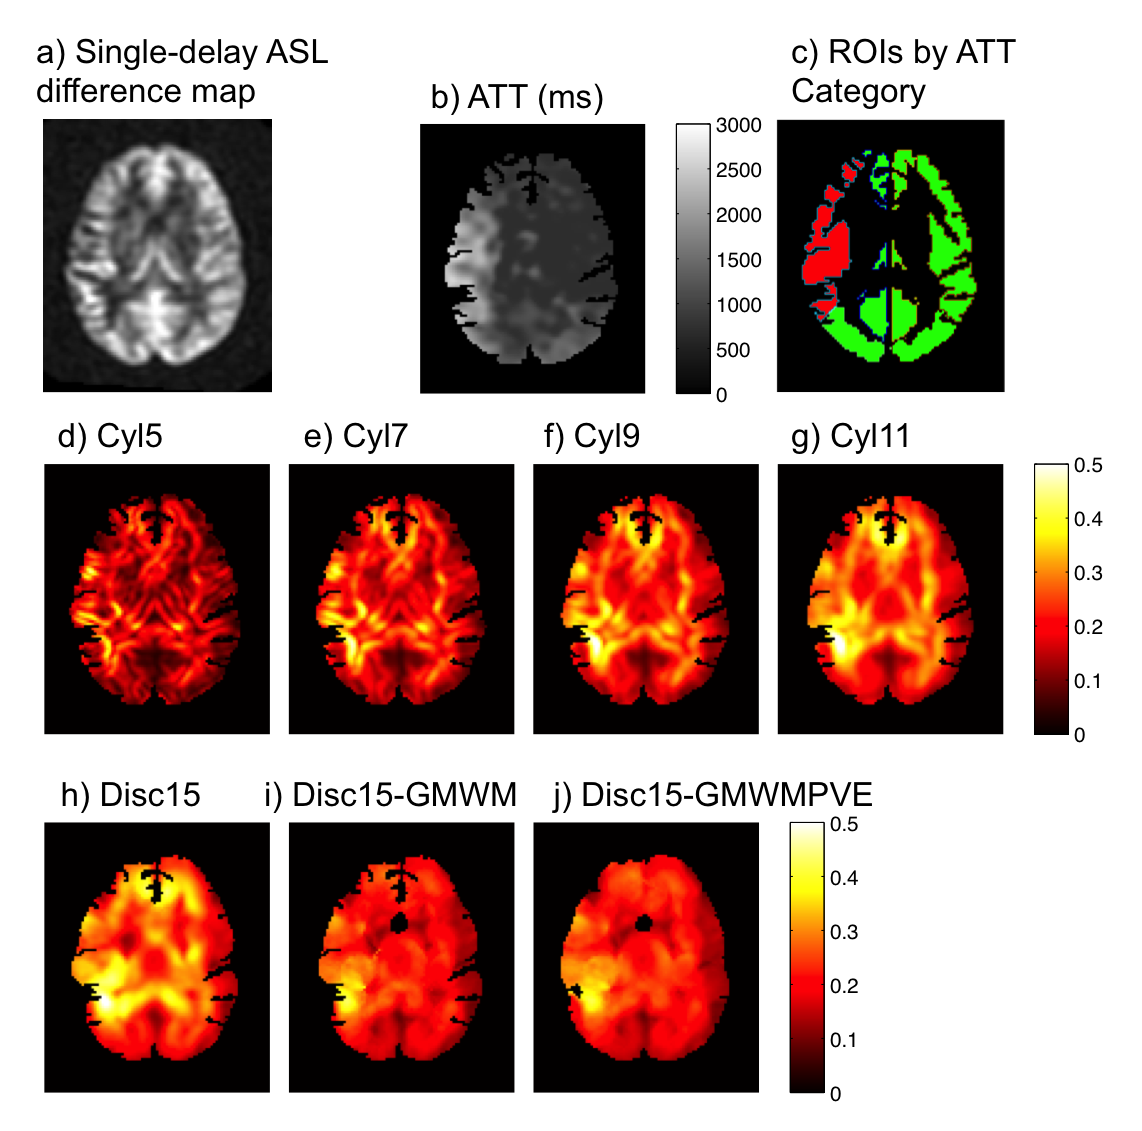
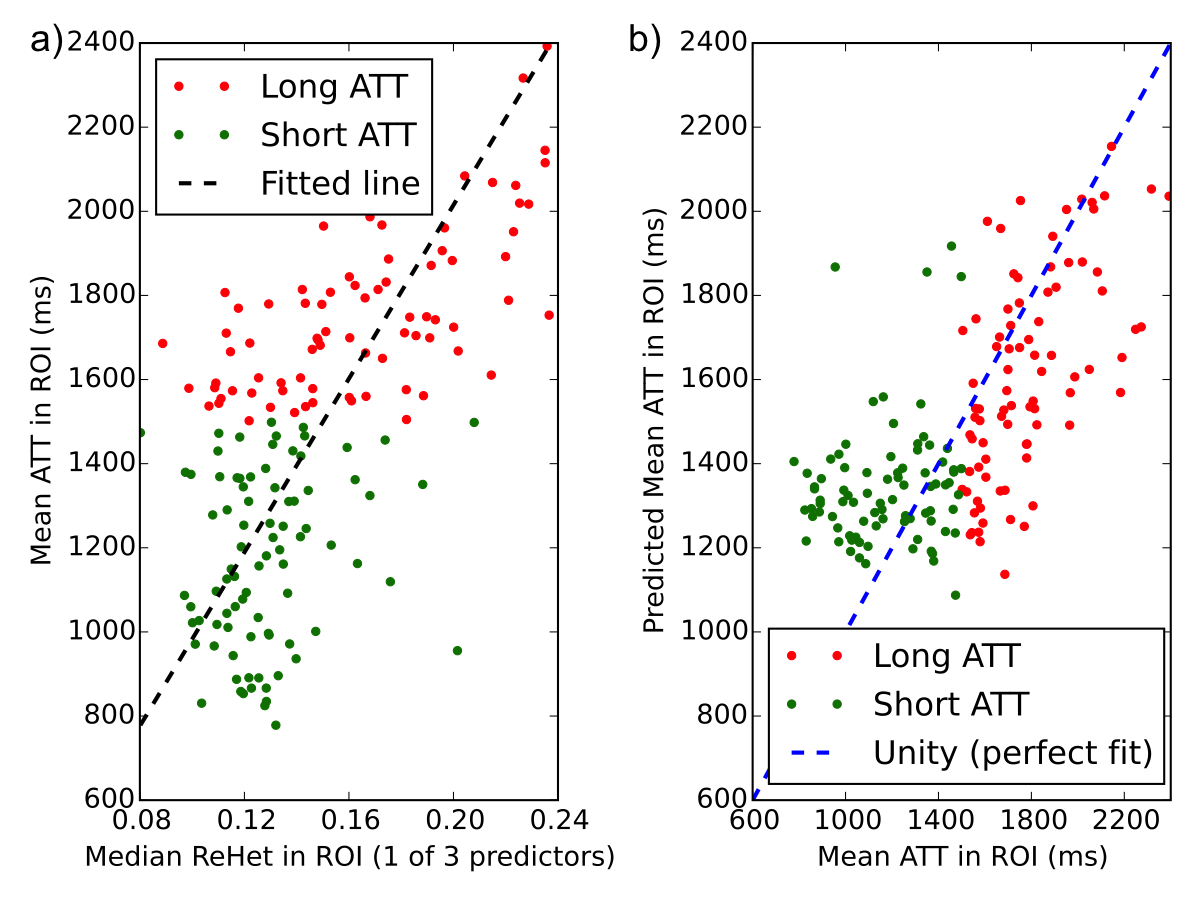
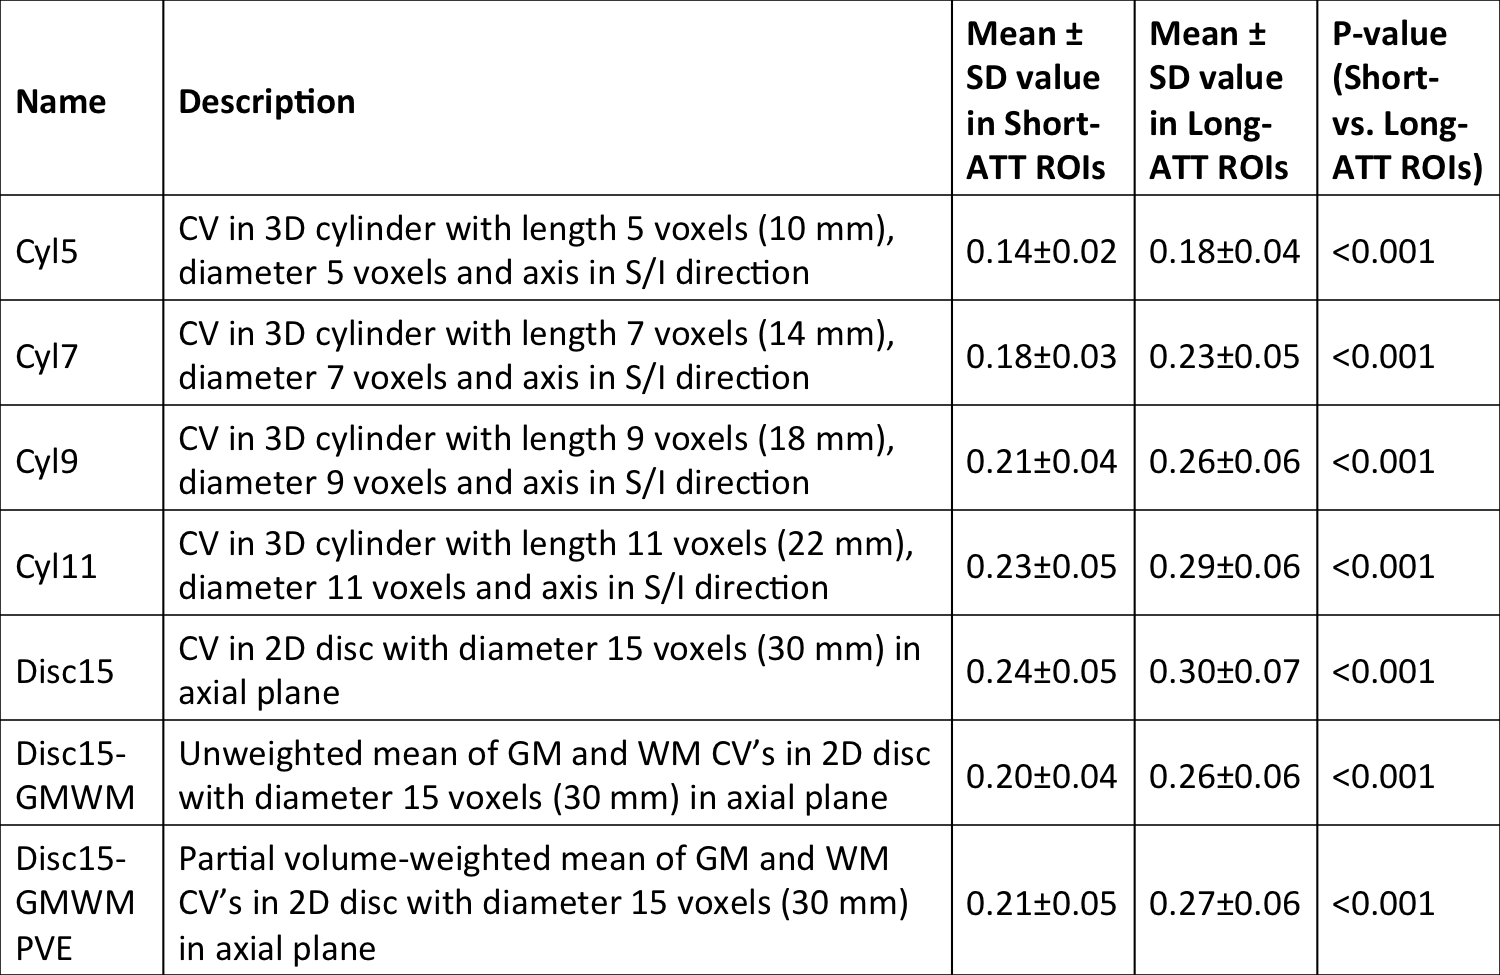
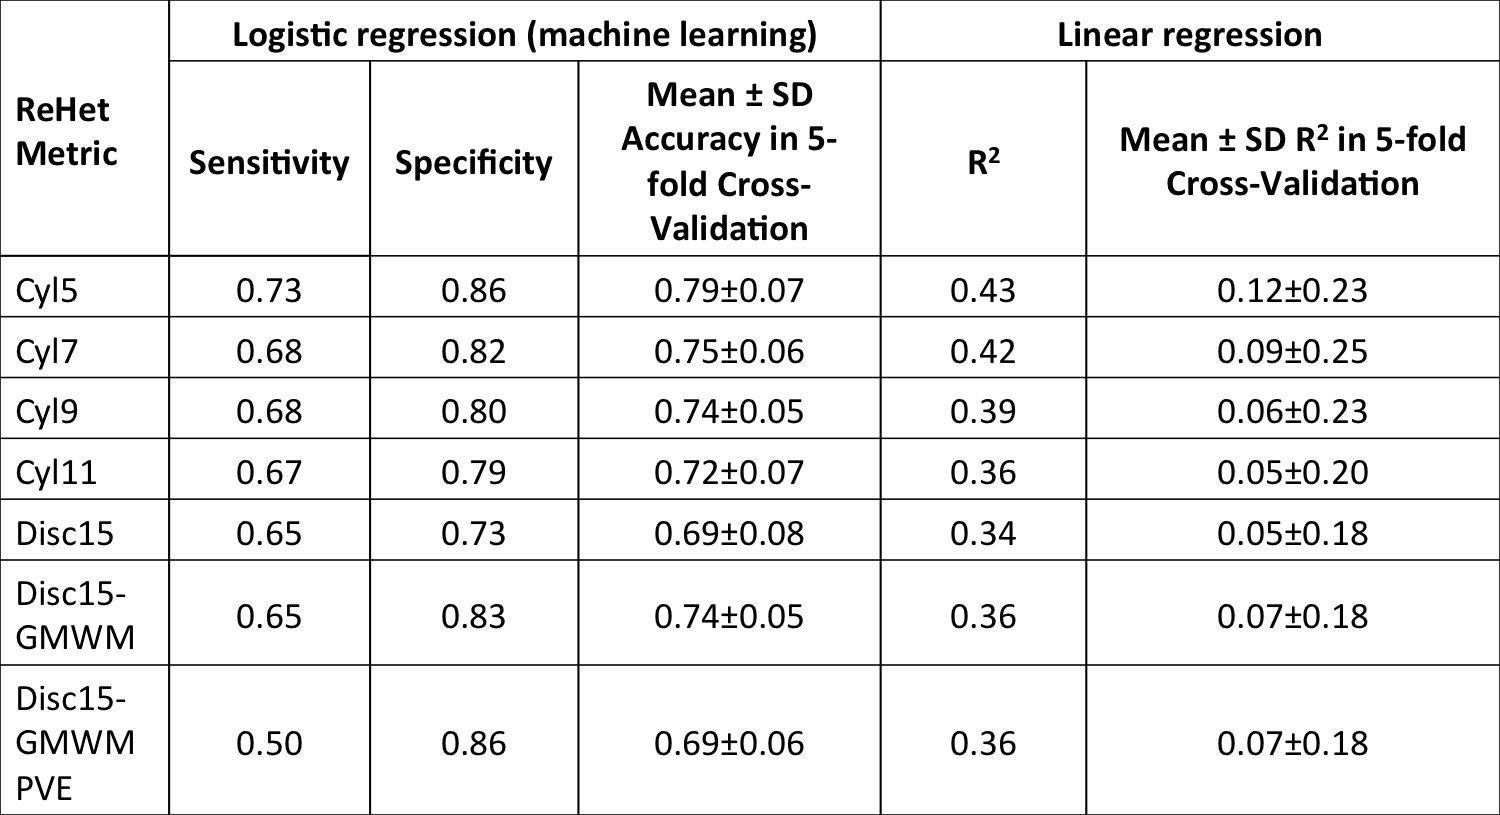
From brain-masked single-delay pcASL difference images, we produced 7 ReHet metric maps by calculating unweighted and weighted spatial coefficient of variation (CV) values over spatial kernels of different sizes and shapes (Table 1). We also downloaded arterial flow territories (Figure 1) in cortical GM produced by Mutsaerts et al. 4, and coregistered them to the same MNI152 templates. We compared mean ReHet metrics between arterial territories with short ATT (≤1500ms) and long ATT (>1500ms) using the Wilcoxon rank sum test with adjustment for subject-wise clustering and stratification by arterial territory. Finally, we fitted mean ATT with a mixed-effect linear regression model and a machine learning logistic regression model, using 3 predictors calculated from ReHet values in each territory: median, IQR, and 25th percentile. Performance of linear regression was assessed with R2, while that of logistic regression with sensitivity and specificity. We used 5-fold cross-validation accuracy to assess the predictive power of both models.
Results
As shown in representative ReHet maps (Figure 2), arterial territories with longer ATT have generally elevated ReHet, though high ReHet also resulted from GM/WM boundaries and susceptibility artifacts (not shown). As the kernel size increases, ReHet maps become more homogeneous with more prominent high-value regions. Adjustment for GM/WM reduces ReHet at tissue boundaries.
ReHet was found to be significantly (p<0.05) higher by 0.04-0.06 in long-ATT ROIs (Table 1). Linear regression models for these ReHet metrics predicted mean ATT with R2 between 0.36 and 0.43 (Figure 3). Logistic regression models identified long-ATT ROIs with sensitivity 50-73%, and specificity 73-86% (Table 2), with significant variation across the 7 ReHet metrics.
Discussion
As expected, long-ATT flow territories have higher ReHet. So far, we observe two trends: 1) larger kernels produce potentially more user-friendly ReHet maps; 2) smaller kernels produce better fit for the linear regression and logistic regression models, though the cross-validation accuracies are not drastically different. Our statistical testing robustly demonstrates that ReHet metrics can discriminate between short- and long-ATT territories.
For ReHet to be clinically useful, we need a predictive model. From our results, we can conclude that linear regression, while demonstrating the correlation between ATT and ReHet, has R2 values too low for application in individual patients. However, the machine learning model of logistic regression can potentially fulfill this role, as testified by its reasonable sensitivity, specificity, and cross-validation accuracy in this dataset.
In future work, we plan to continue developing targeted kernels to eliminate structural and susceptibility-related heterogeneity, and to selectively measure perfusion-related spatial variation. We will explore ReHet kernels to specifically assess collateral networks and arterial transit artifacts, and build more sophisticated machine learning models with higher performance.
Conclusion
We have robustly demonstrated that single-delay ASL-based regional heterogeneity (ReHet) metrics contains arterial transit information in Moyamoya disease patients, and can potentially assess ATT in individuals using only a standard product ASL sequence.Acknowledgements
NIH R01NS066506, R01NS047607, R21NS087491, NCRR 5P41RR09784. GE Healthcare.References
1. MacIntosh et al., Am. J. Neuroradiol. 2010;31:1892–1894.
2. Mutsaerts et al., Proc. ISMRM. 2016;24:420.
3. Wang et al., Eur. Radiol. 2014;24:1135–1144.
4. Mutsaerts et al., PLoS One 2015;10:1–13.
Link to flow territories created by Mutsaerts et al.: https://figshare.com/articles/ATT_based_flow_territories/1488674
Figures