1880
Cerebral Blood Flow and Bolus Arriving Time Changes in Patients with Diabetes Detected by Multi-TI ASL1Shandong Medical Imaging Research Institute, School of Medicine, Shandong University, Jinan, People's Republic of China, 2Laboratory of FMRI Technology (LOFT),Mark & Mary Stevens Neuroimaging and Informatics Institute,Keck School of Medicine,University of Southern California (USC), LA, CA, United States, 3Siemens Healthcare, Erlangen, Germany, 4Siemens Healthcare, MR Collaborations NE Asia, Beijing, People's Republic of China
Synopsis
This study aimed to simultaneously measure cerebral blood flow (CBF) and bolus arriving time (BAT) in a cohort of subjects with type II diabetes, and compared the results with those of matched control subjects using a multi-TI 3D GRASE pulsed-ASL (PASL) sequence. The voxel-based analysis showed that the CBF and BAT values in patients with diabetes presented significant differences compared to healthy subjects, especially in some particular areas of the brain. These differences may be related to functional changes in patients with diabetes, which may have occurred before the onset of the symptoms.
PURPOSE:
Diabetes has been reported to affect the microvasculature, and may lead to cerebral small-vessel disease. In this study, we used a multi-inversion-time (mTI) 3D GRASE pulsed ASL (PASL) sequence to simultaneously measure cerebral blood flow (CBF) and bolus arriving time (BAT) in a cohort of subjects with type II diabetes, and compared the results with those of matched control subjects.METHODS:
Nineteen patients with type II diabetes and 19 gender- and age-matched control subjects participated in this study. All data were collected on a MAGNETOM Skyra 3T MR scanner (Siemens, Erlangen, Germany). The MRI exam consisted of multi-TI ASL and T1 MPRAGE. Multi-TI ASL images were acquired with a prototype background-suppressed 3D GRASE PASL sequence with the following parameters: TR/TE = 4600/22ms, FOV = 220 × 220mm2, slice thickness = 4mm, voxel size = 3.4 x 3.4 × 4.0mm3, 36 slices, bolus length = 700ms, 16 TIs from 480 to 4080ms, and total acquisition time = 5:09 min including an M0 scan. The CBF/BAT/error maps were calculated inline on the scanner. MPRAGE was acquired in a sagittal orientation with 1 mm isotropic resolution (FOV = 230 × 230mm², 192 slices, TR/TE = 1900ms/2.58ms, TI = 900ms, flip angle = 9°) in 4:59 min.
A voxel-based analysis was used to compare CBF and BAT in the diabetes group (19 patients age 43 to 71 years old, 12 male) compared to the control group (19 age and gender matched volunteers). Global effects were computed for white matter and the gray matter of each subjects, while a voxel-wise comparison using a two-sample two-sided t-test provided detailed regional effects. Statistical significance was defined by FDR p<0.05 corrected p<0.01 with a cluster size of at least 70 voxels. The results are displayed by XJVIEW. We extracted the mean CBF and BAT values in each of the three areas with significant differences using Marsbar.
RESULTS:
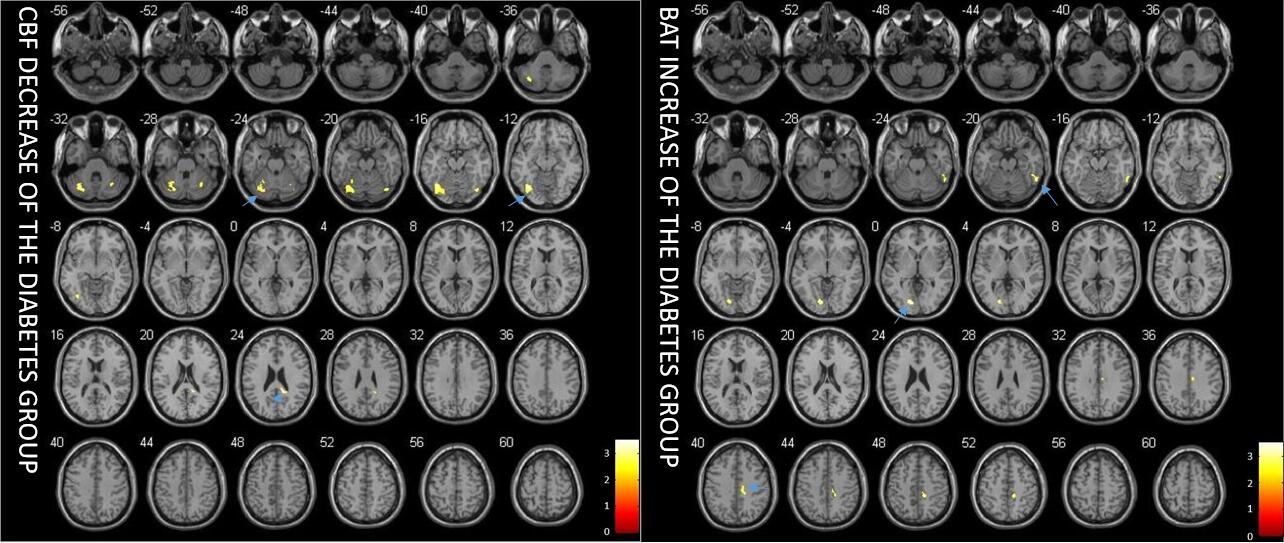
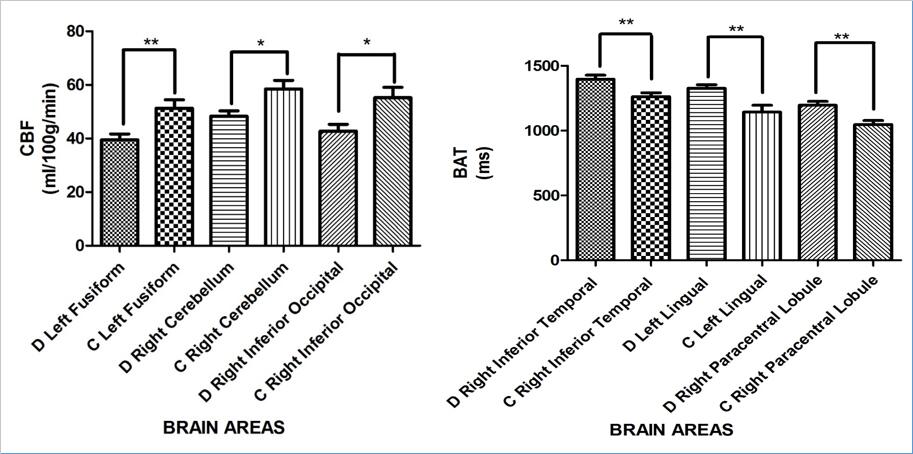
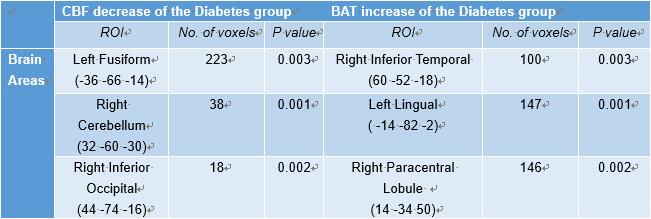
Figure 1 shows the difference of CBF and BAT between patients with diabetes and the control group. The most significant CBF decreases were detected in the areas of left fusiform (p=0.003), right cerebellum (p=0.001), and right inferior occipital lobe (p=0.002). BAT increases were observed in the areas of right inferior temporal lobe (p=0.003), left lingual (p=0.001) and right paracentral lobule (p=0.002) (Figure 2). The mean value of CBF and BAT of the grey matter and white matter did not show significant differences between patient and control groups.DISCUSSION:
The global values of CBF and BAT of the grey matter and white matter show no difference between patient and control groups, similar to the previous study [1,2], which suggests that diabetes may mainly influence particular areas of the brain that might cause a patient’s symptoms. Moreover such changes in regional CBF and BAT may occur before the symptom appear, and could potentially be used as a predictive index for the appearance of complication in type 2 diabetes.
Indeed we found lower CBF in the area of left fusiform [3]. This may be related to impaired vision of patients with diabetes which is one of the main clinical complications. The lower CBF in the area of right inferior occipital [4], right cerebellum [5] and higher BAT in left lingual [6] and right inferior temporal lobe [7] may be related to the recognition and memory loss of the patients with diabetes. Higher BAT in right paracentral lobule [8] may be related to the fatigue feeling and defecation and micturition abnormal of patients with diabetes which is the early symptom.
ASL CBF calculations are sensitive to BAT [9], despite efforts to minimize the sensitivity [10]. Simultaneous estimation of BAT and CBF can provide more accurate CBF estimates without sensitivity to arterial transit delays [11]. In addition, the BAT map may be helpful as a tool for the diagnosis of cerebrovascular abnormality, such as identifying ischemic penumbra and infarction [12]. BAT mapping during functional tasks has also proven to be a useful measure of brain activity [11].
CONCLUSION:
Some particular areas in the brain show significant differences in the mean CBF and BAT values of the white and grey matter when comparing patients with diabetes and normal controls. These differences may be related to cognitive impairments or other complications in patients with type II diabetes.Acknowledgements
No acknowledgement found.References
[1] Tiehuis A M, Vincken K L, Van Den Berg E, et al. Cerebral perfusion in relation to cognitive function and type 2 diabetes[J]. Diabetologia, 2008, 51(7): 1321-1326.
[2] van Laar P J, van der Graaf Y, Mali W P T M, et al. Effect of Cerebrovascular Risk Factors on Regional Cerebral Blood Flow 1[J]. Radiology, 2008, 246(1): 198-204.
[3] McCandliss B D, Cohen L, Dehaene S. The visual word form area: expertise for reading in the fusiform gyrus [J]. Trends in cognitive sciences, 2003, 7(7): 293-299.
[4] Sun L, Patel R, Liu J, et al. Mining brain region connectivity for alzheimer's disease study via sparse inverse covariance estimation[C]//Proceedings of the 15th ACM SIGKDD international conference on Knowledge discovery and data mining. ACM, 2009: 1335-1344.
[5]Sun, Liang, et al. "Mining brain region connectivity for alzheimer's disease study via sparse inverse covariance estimation." Proceedings of the 15th ACM SIGKDD international conference on Knowledge discovery and data mining. ACM, 2009.
[6] Bernstein, Lori J., et al. "The effect of encoding strategy on the neural correlates of memory for faces." Neuropsychologia 40.1 (2002): 86-98.
[7] Hubert, Valérie, et al. "Age-related changes in the cerebral substrates of cognitive procedural learning."Human brain mapping 30.4 (2009): 1374-1386.
[8] Neuroscience in medicine [M]. Springer Science & Business Media, 2008.
[9] Jann K, Hauf M, Kellner-Weldon F, et al. Implication of cerebral circulation time in intracranial stenosis measured by digital subtraction angiography on cerebral blood flow estimation measured by arterial spin labeling[J]. Diagnostic and Interventional Radiology, 2016, 22(5): 481.
[10] Dai W, Robson P M, Shankaranarayanan A, et al. Reduced resolution transit delay prescan for quantitative continuous arterial spin labeling perfusion imaging[J]. Magnetic resonance in medicine, 2012, 67(5): 1252-1265.
[11] Gonzalez-At J B, Alsop D C, Detre J A. Cerebral perfusion and arterial transit time changes during task activation determined with continuous arterial spin labeling [J]. Magnetic resonance in medicine, 2000, 43(5): 739-746.
[12] Wang D J J, Alger J R, Qiao J X, et al. Multi-delay multi-parametric arterial spin-labeled perfusion MRI in acute ischemic stroke—comparison with dynamic susceptibility contrast enhanced perfusion imaging[J]. NeuroImage: Clinical, 2013, 3: 1-7.
Figures