1879
Hadamard-encoded Multi-delay PCASL: Should the Bolus Durations be T1-adjusted?1Radiology, Stanford University, Stanford, CA, United States, 2GE Healthcare, Calgary, Canada
Synopsis
It has been hypothesized that in multi-delay arterial spin labeling (ASL), employing T1-adjusted labeling durations (LDs) should provide a more balanced signal-to-noise (SNR) across ASL signals, therefore improving the accuracy of the transit delay (TD) and perfusion estimation. However, this claim has not been thoroughly tested. In this study, we evaluated the effects on the TD and perfusion estimation using LDs both with and without T1-adjusted weighting, using the Hadamard-encoded multi-delay ASL sequence. Using Monte Carlo simulations and in vivo experiments, T1-adjusted weighting was more prone to noise and was likely to underestimate the TD and perfusion measurements compared to that without.
Introduction
It has been proposed 1 that using T1-adjusted labeling durations (LDs) in multi-delay arterial spin labeling (ASL) measurement should improve the signal-to-noise (SNR) at long post-labeling delays (PLDs), providing more balanced SNR across ASL signals at multiple delays and improving the accuracy of transit delay (TD) and perfusion estimation. However, this has only been explored with limited simulations 2. A more thorough examination is warranted. In this study, we evaluated the effects of using LD and PLD, with and without T1-adjusted weighting, on TD and cerebral blood flow (CBF) estimation through Monte Carlo simulation and in vivo experiments.
Materials and Methods
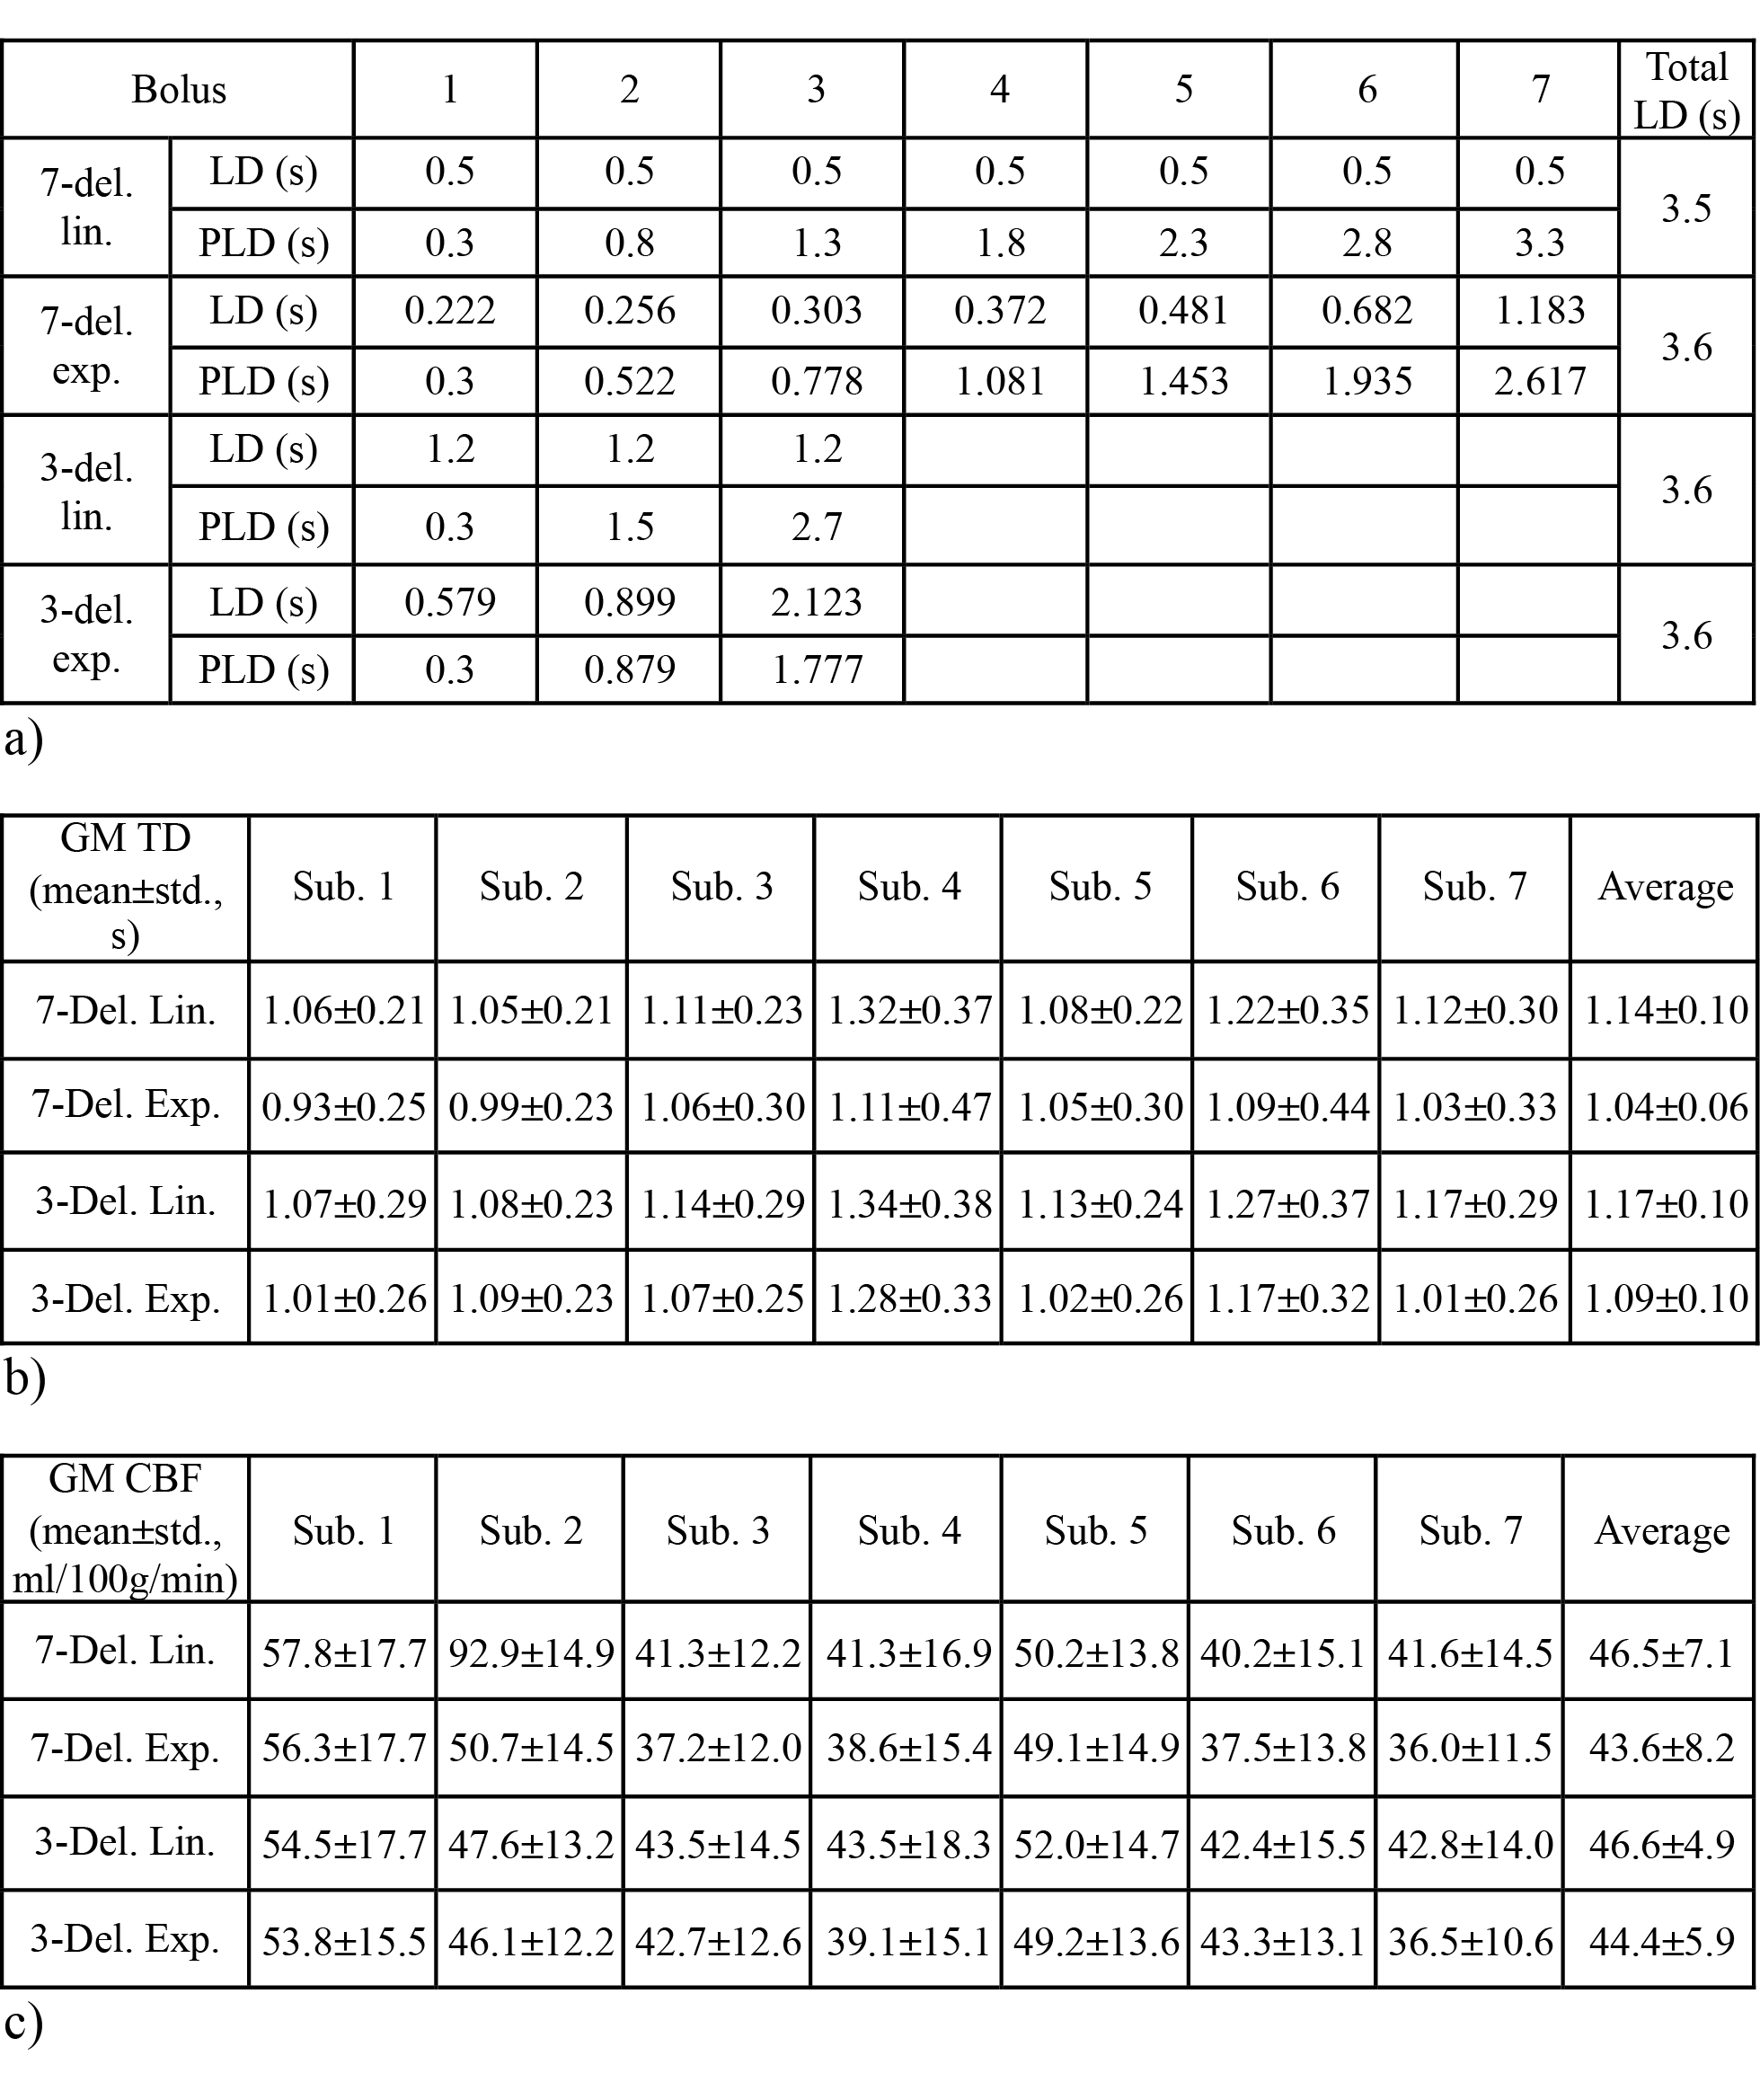
Three hundred pairs of CBF and TD, evenly distributed within [30-90] ml/100g/min and [0.4-3.0] s, respectively, were used as the ground truth. The Hadamard-encoded 3 multi-delay pseudo-continuous ASL (pcASL) 4 signal model was used to synthesize the ASL signal at each encoding step. For simplicity, a T1 of 1.65 s was used for both blood and tissue. Labeling parameters (Table 1 a) using linear and exponential weightings (i.e., without and with T1-adjustment, respectively) were evaluated with two sub-bolus sizes (7-del. and 3-del.) and similar total labeling times.
Zero-mean Gaussian noise was added in each encoding step with 4 noise levels (relative SNR, rSNR = 0.5, 1, 2, 5), with respect to the theoretical ASL signal with LD/PLD/TD = 1/2/2 s. The noisy signals were decoded and TDs were estimated through dictionary matching. Then TD-corrected CBFs were calculated. One thousand repetitions were simulated under each condition and the mean was calculated. The estimation errors were calculated and normalized to the true values.
Seven normal subjects (3 females) were studied at 3.0T under locally approved IRB, using the same labeling parameters as in simulation. The ASL images were acquired with a 4-shot 3D FSE stack of spiral readout, 1024 points per arm, in-plane resolution = 3.33 mm, FOV = 220x220 mm, 28 slices with 5 mm thickness, background suppression using 4 inversion pulses, vascular crushing with Vcut = 2 cm/s, averages = 1. TR/TE and total scan time were 5303/14.2 ms, 3:34 and 5403/14.2 ms, 2:10 for 7-delay and 3-delay, respectively. TD and CBF maps were calculated as in the simulation, except that a tissue T1 of 1.5 s was used. ASL images were used to generate gray matter (GM) regions of interest (ROIs), in which the TDs and CBFs were analyzed.
Results
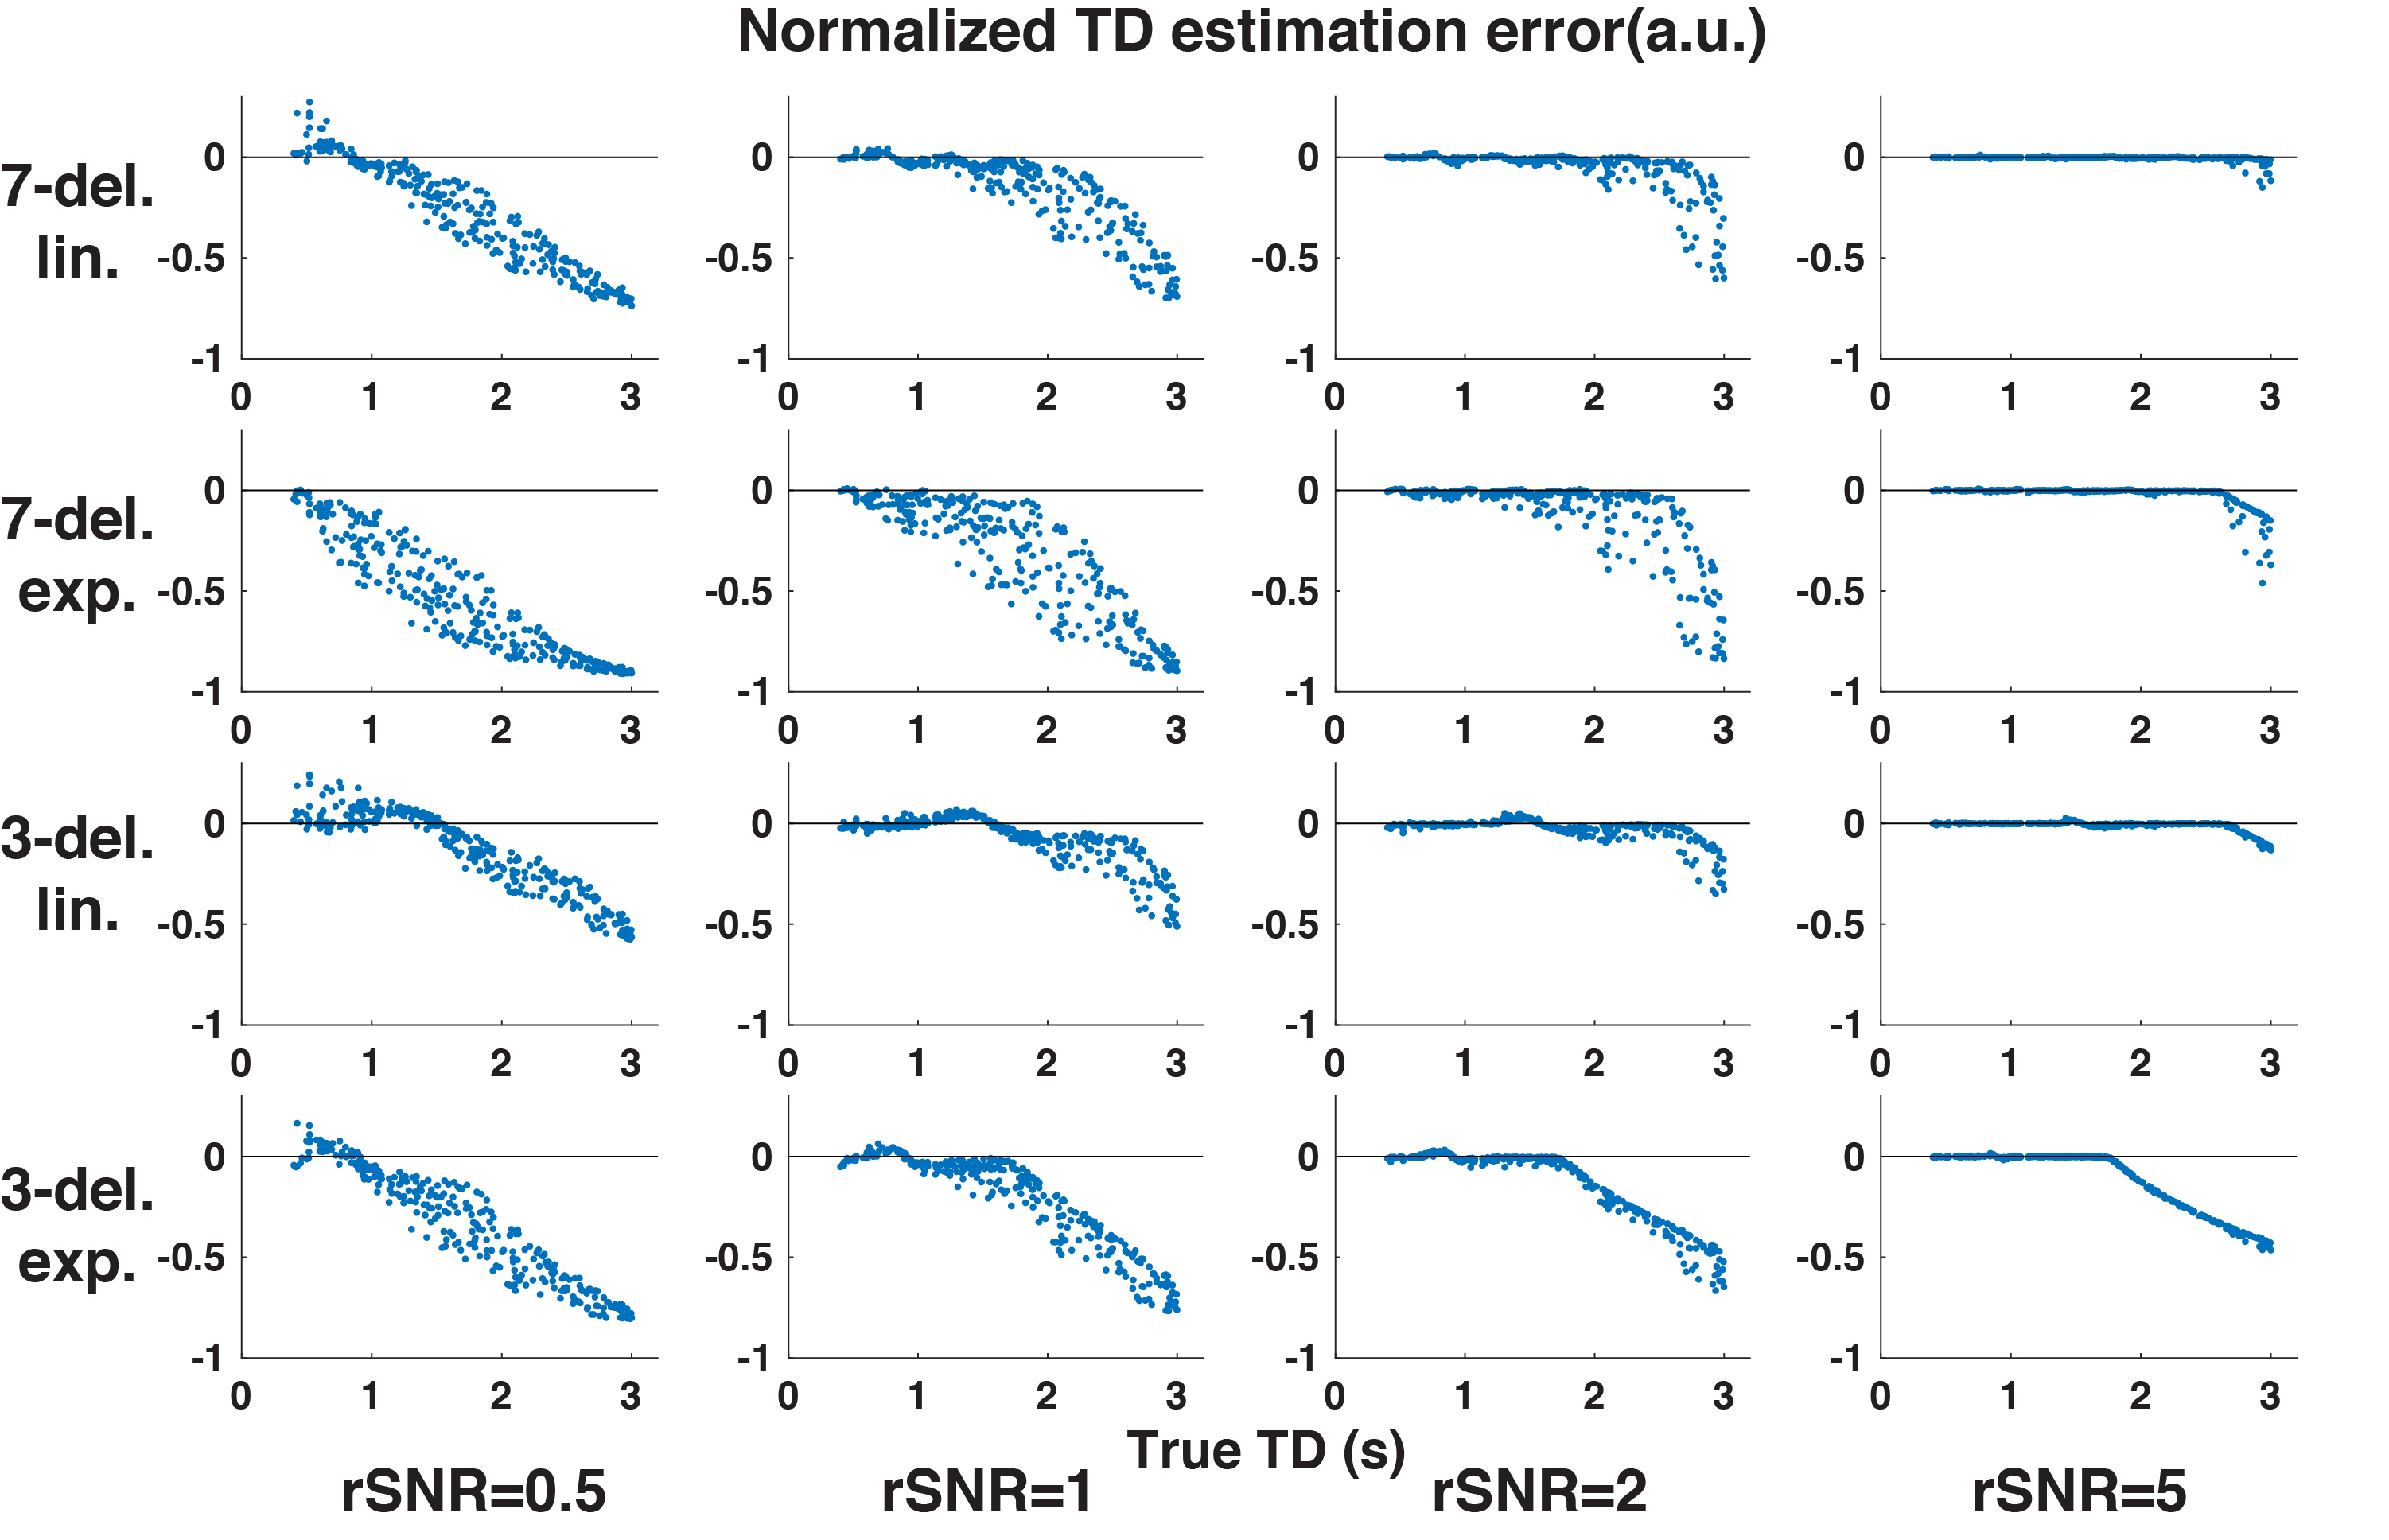
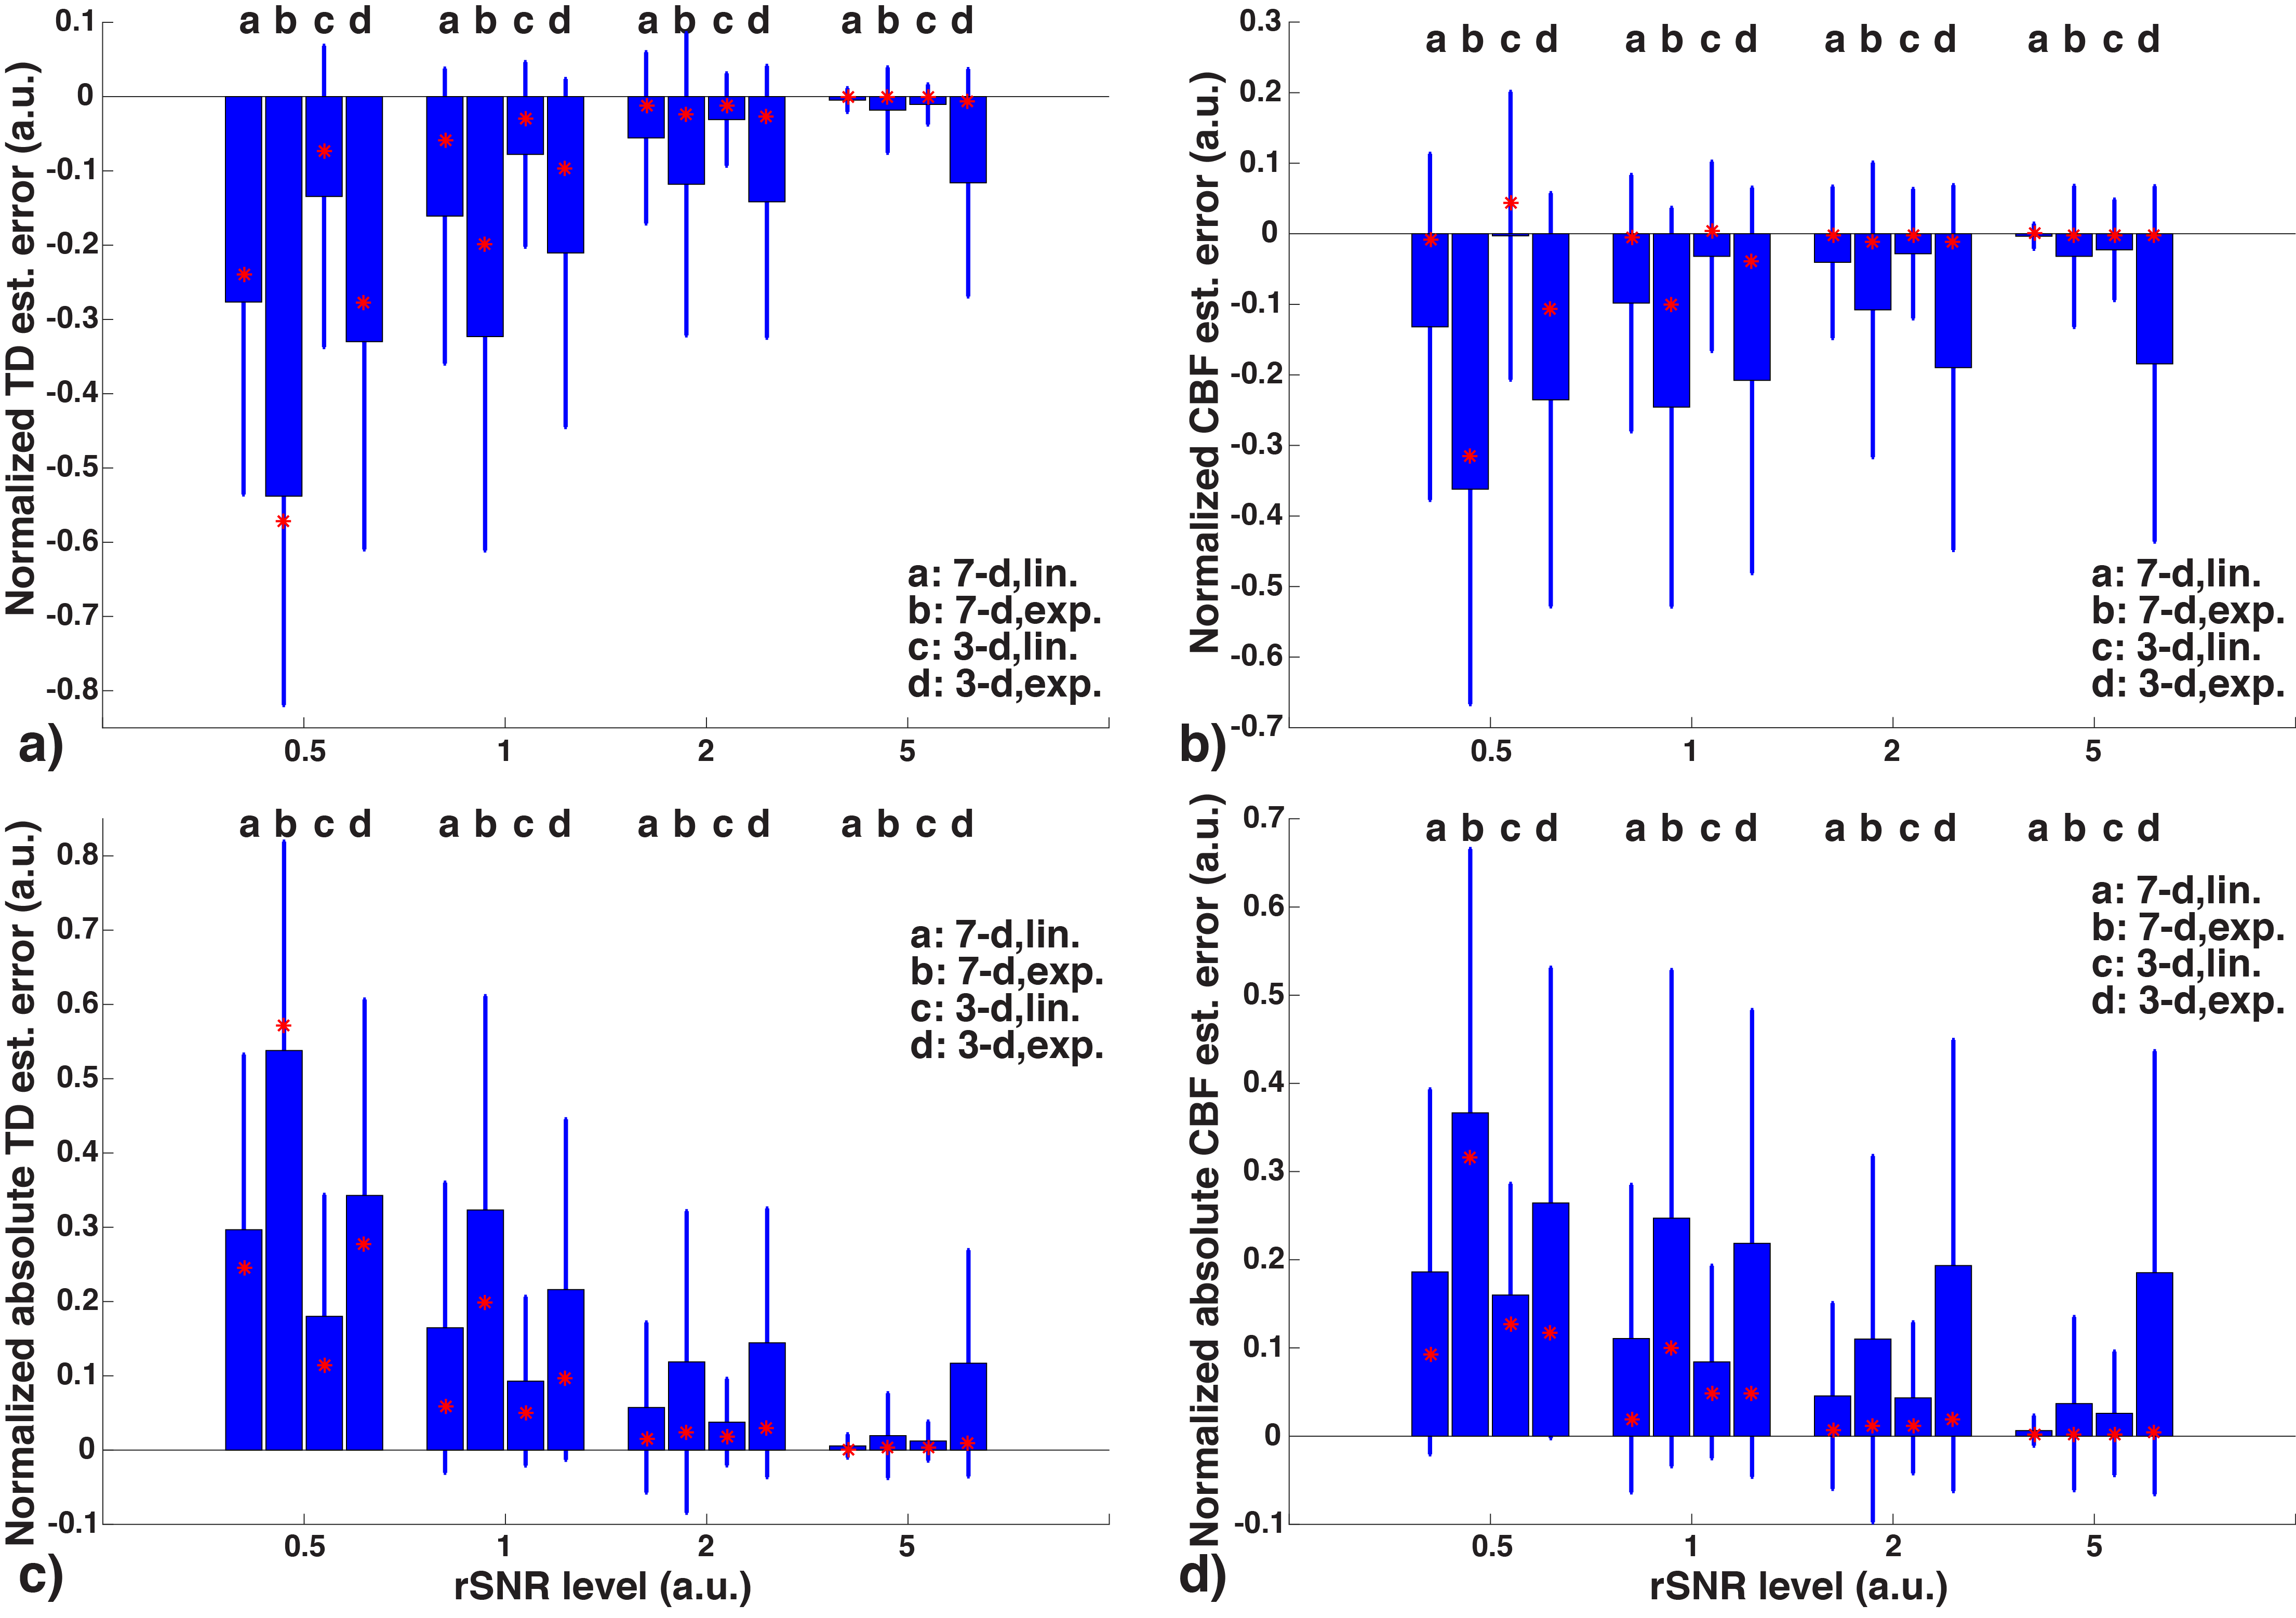
The results regarding TD and CBF estimation are shown in Figures 1 and 2. At all given rSNR levels, exponential weighting showed more sensitivity to noise and was likely to yield larger underestimation of TD compared to linear weighting. Using a smaller number of longer sub-boluses (i.e, the 3-delay approach) produced more accurate results with linear weighting than did the 7-delay approach. The CBF estimation errors showed a similar trend as the TD estimations, with smaller biases.
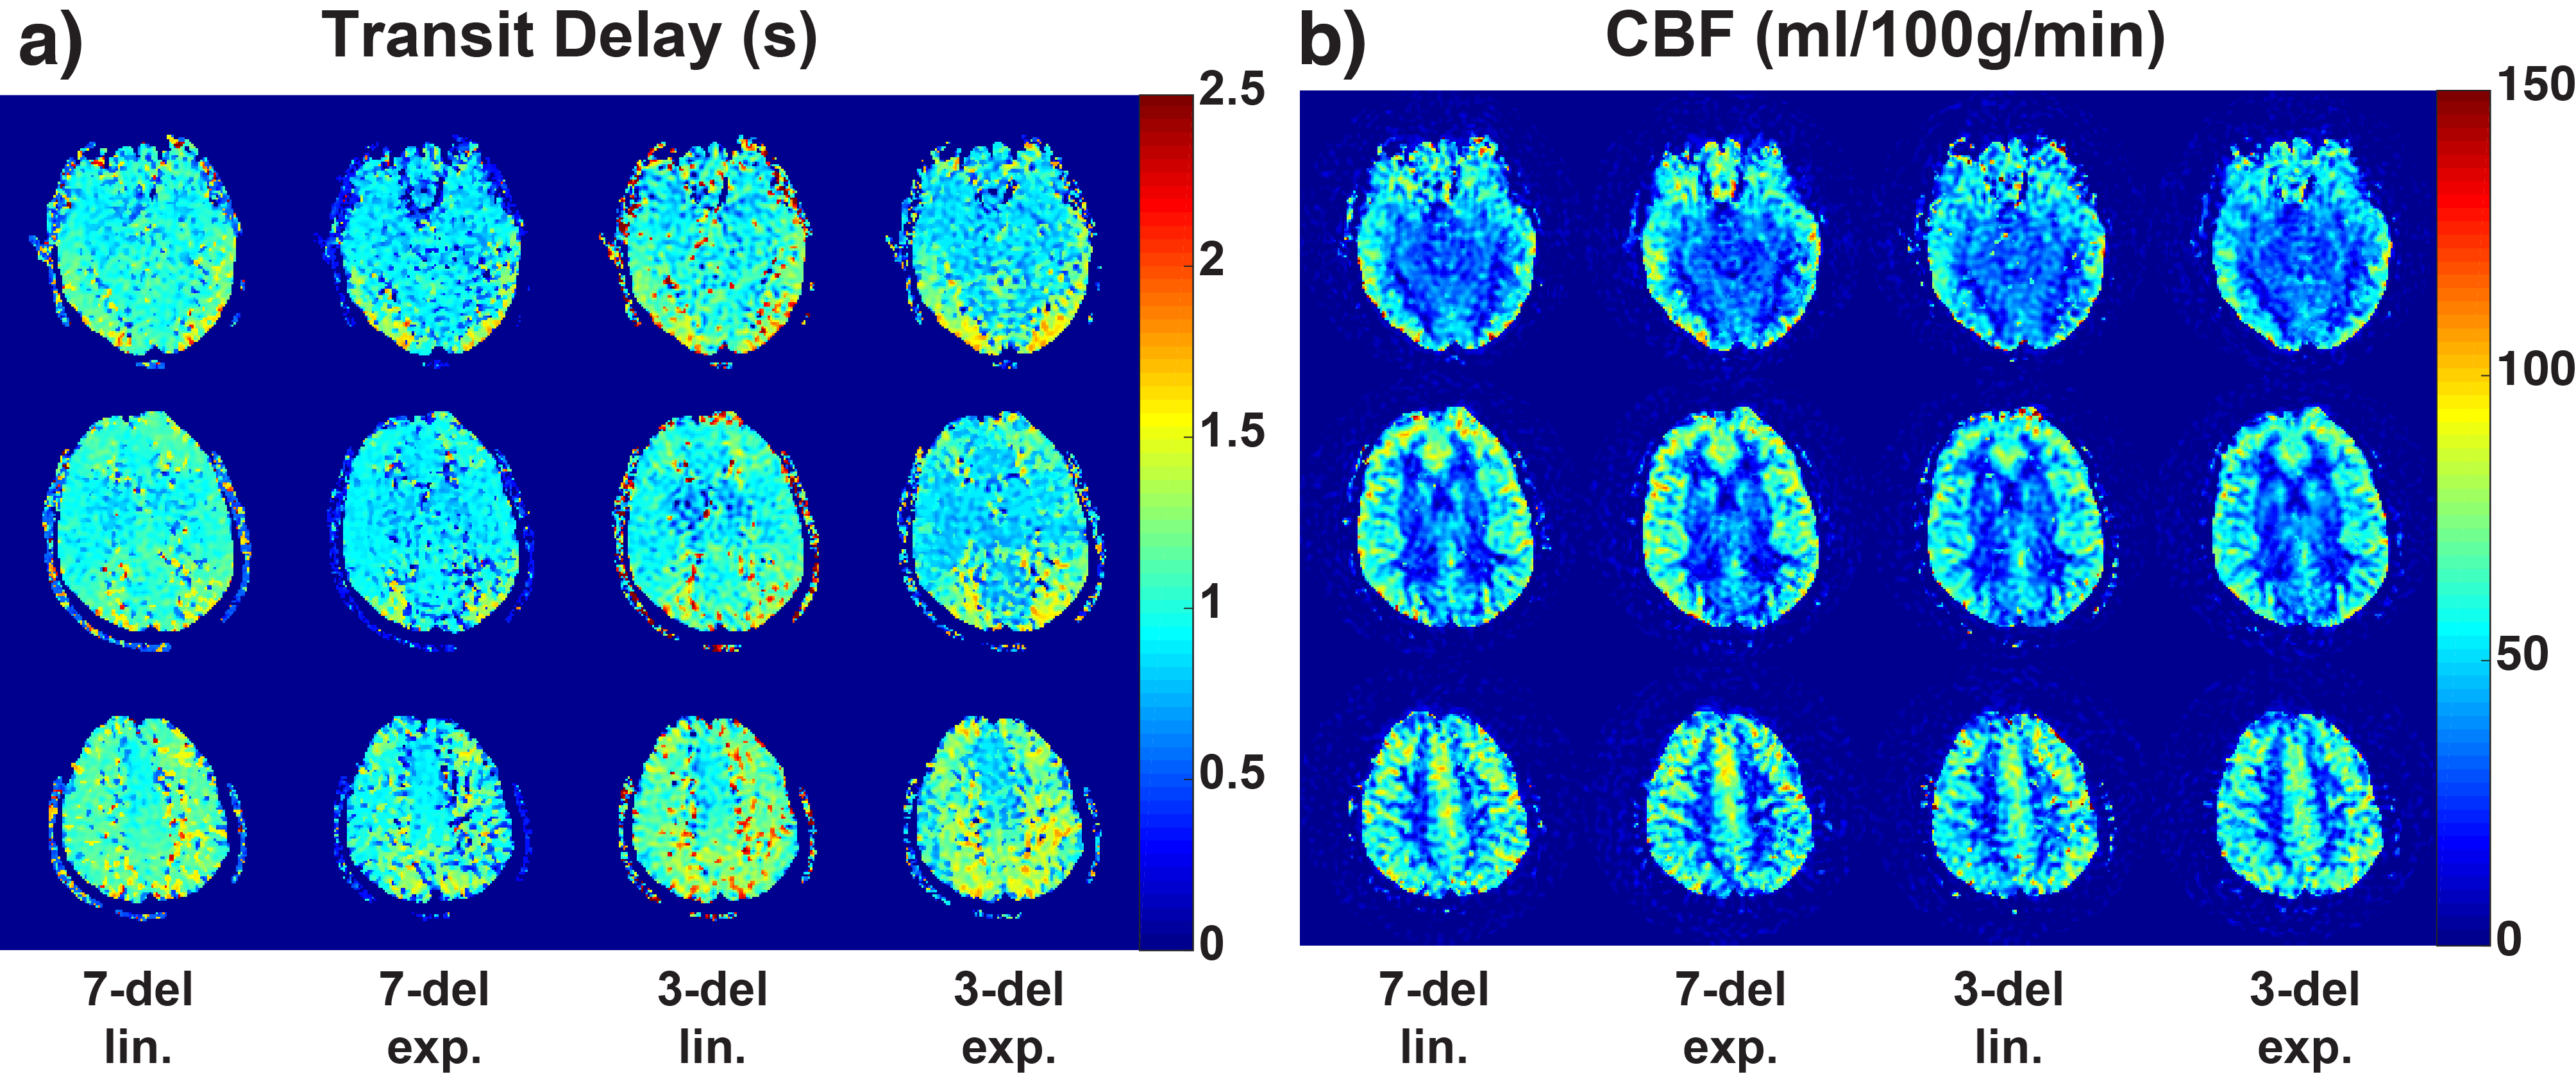
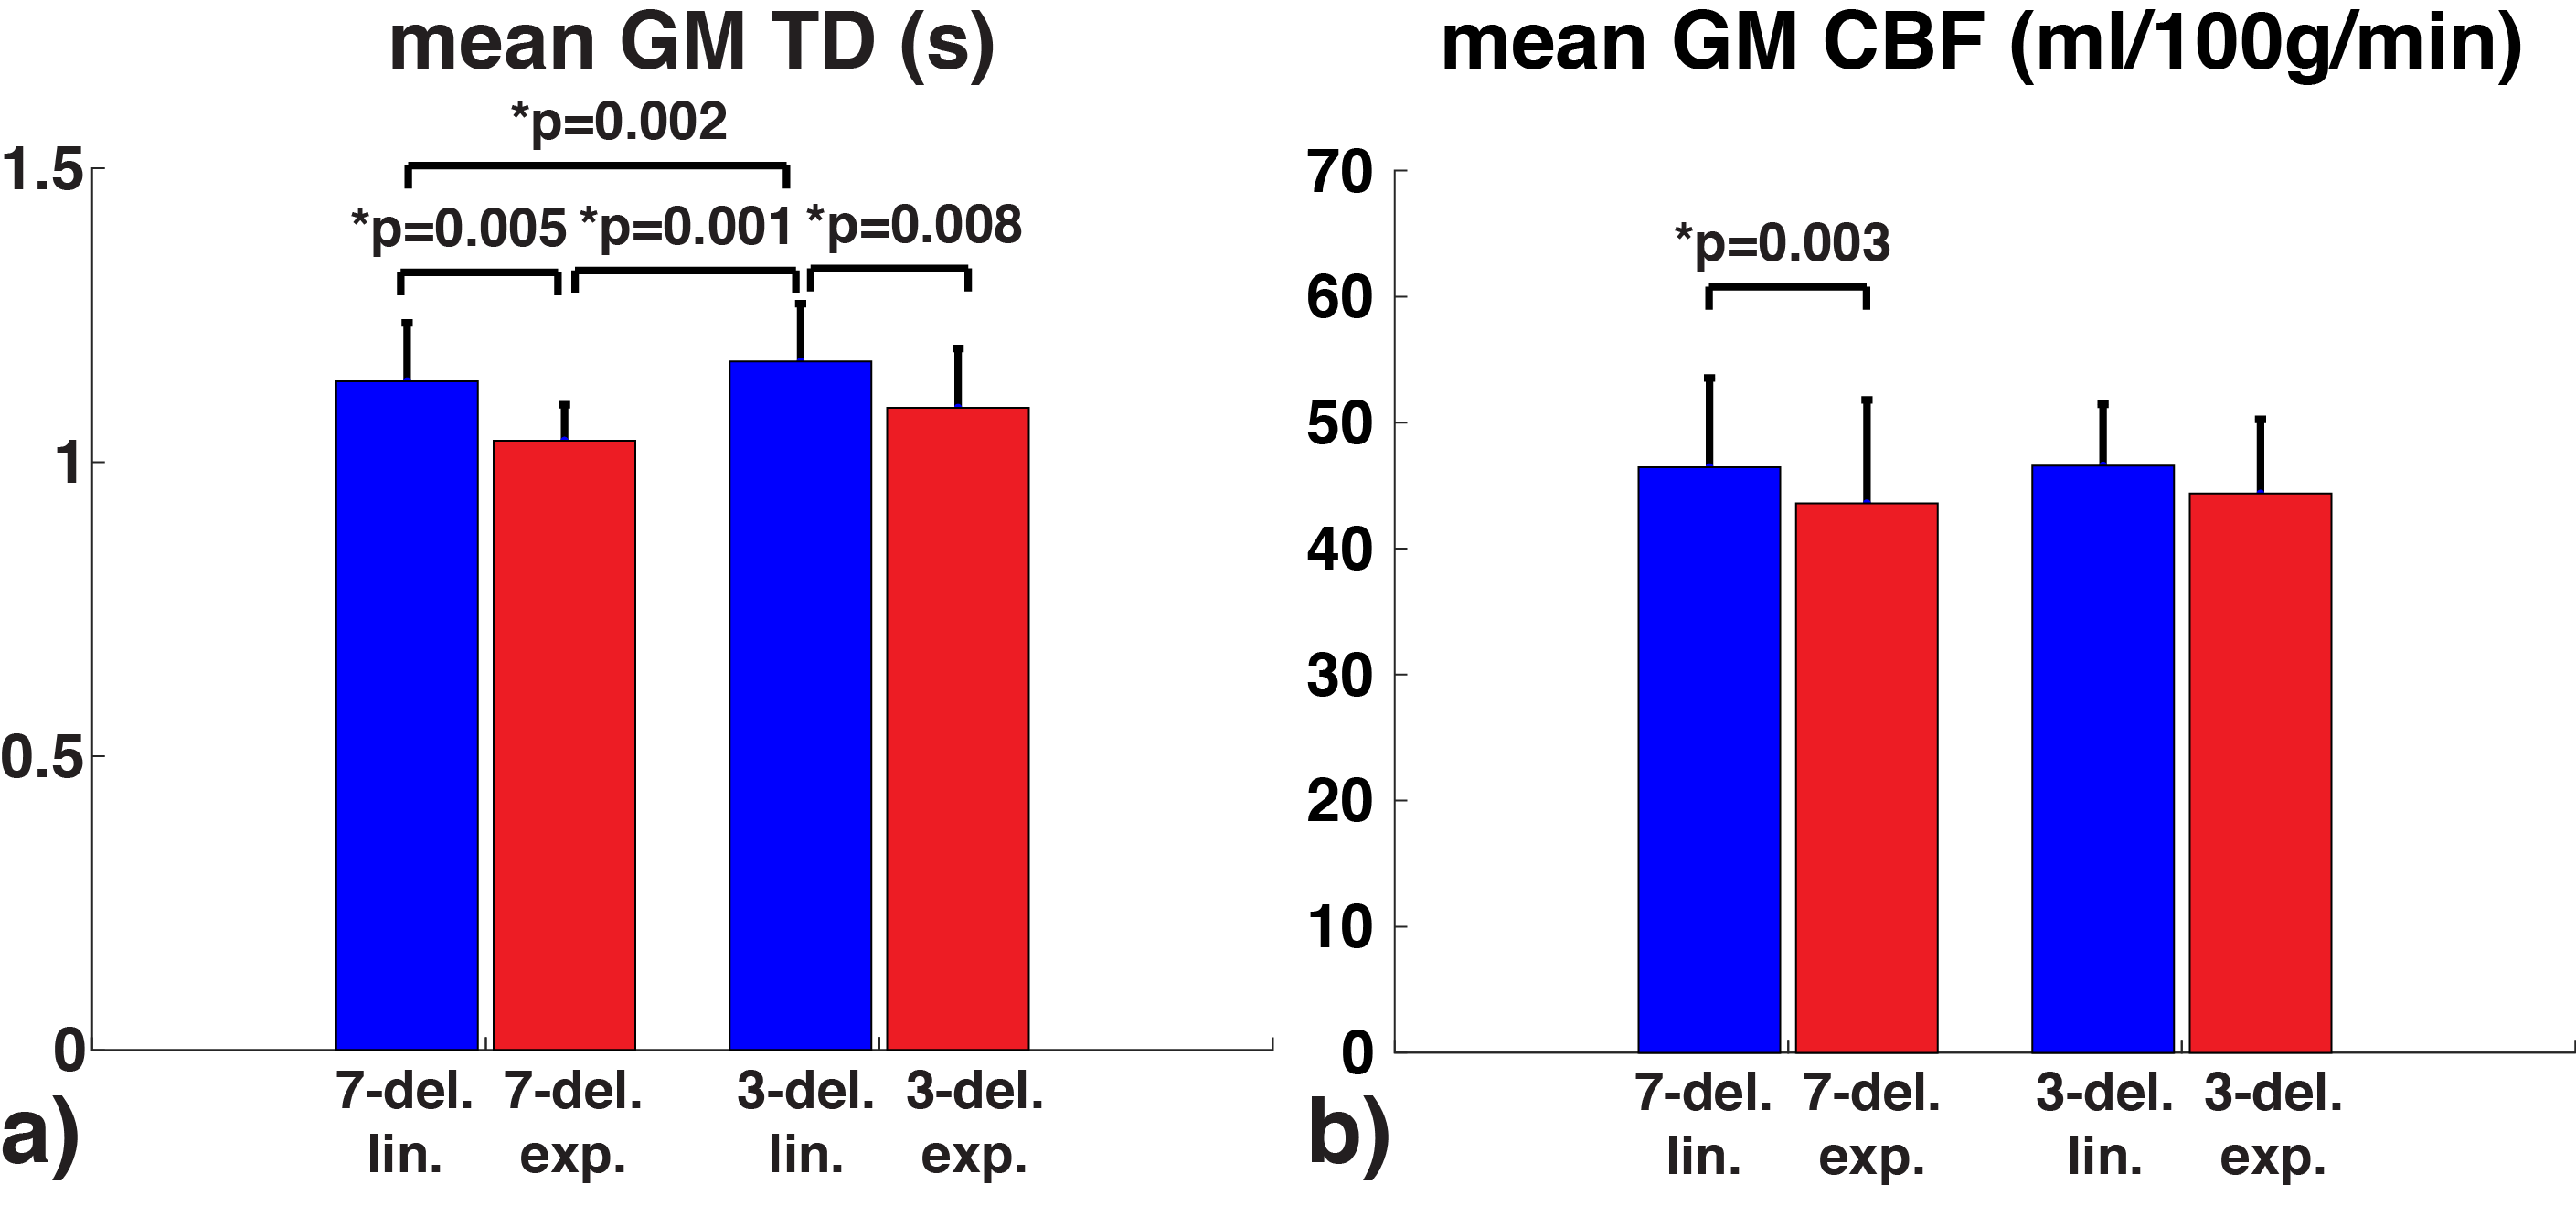
Representative TD and CBF maps in Subject 1 are shown in Figure 3. Underestimation in TDs using exponential weighting compared to linear weighting can be observed. The mean and standard deviation in GM ROI from each subject were reported in Table 1 b) and c). The averaged results are summarized in Figure 4. Exponential weighting yielded lower TDs compared to linear weighting. Using shorter sub-boluses with linear weighting also yielded lower TDs, though the difference is very small. The in vivo results were consistent with the prediction from the simulation.
Discussion and Conclusion
According to the simulation, the lower TDs and CBFs from the in vivo measurements using exponential weighting were likely due to underestimation. The linear weighting likely provides more accurate estimates. Given the same total labeling time, T1-adjusted weighing may be disadvantageous mainly due to: 1) a smaller valid TD detection range, e.g., [0.3-2.617] s vs. [0.3-3.3] s with 7-delay, and [0.3-1.778] s vs. [0.3-2.7] s with 3-delay, ; 2) a reduced SNR at acquisitions with shorter PLDs, resulting in less accurate estimation of shorter TDs. These effects are demonstrated in Figure 1.
Though using 3 long sub-boluses rather than 7 shorter sub-boluses sampled the inflow curve more sparsely, the SNR gain led to improved overall accuracy in the presence of noise, which is often the case in practice. Given an equal amount of imaging time, it is noted that the use of fewer encoding steps with a smaller number of sub-boluses enables more repetitions that can be employed to improve SNR further.
In summary, contrary to previously hypothesized, T1-adjusted weighting in Hadamard-encoding is less robust to noise and more likely to underestimate TD and CBF, compared to linear weighting with the same total labeling time.
Acknowledgements
NIH R01NS066506, R01NS047607, NCRR 5P41RR09784. GE Healthcare.References
1. Teeuwisse, W. M., et al. (2014). "Time-encoded pseudocontinuous arterial spin labeling: basic properties and timing strategies for human applications." Magnetic Resonance in Medicine 72(6): 1712-1722.
2. Woods, J. G., et al. (2016). A Theoretical Comparison of Multi-Delay Arterial Spin Labeling Methods. Proc ISMRM 2016; 2882.
3. Günther, M. (2007). Highly Efficient Accelerated Acquisition of Perfusion Inflow Series by Cycled Arterial Spin Labeling. Proc ISMRM 2007; 380.
4. Dai, W., et al. (2013). "Volumetric measurement of perfusion and arterial transit delay using hadamard encoded continuous arterial spin labeling." Magnetic Resonance in Medicine 69(4): 1014-1022.
Figures