1877
Reliability of Single- and Multi-TI ASL measurements with a clinical product sequence1Institute of Neurology, University College London, London, United Kingdom, 2Department of Medical Physics and Biomedical Engineering, University College London, London, United Kingdom, 3Department of Information Engineering, University of Padova, Padova, Italy, 4Brain MRI 3T Mondino Research Center, C. Mondino National Neurological Institute, Pavia, Italy, 5Neuroradiology Unit, C. Mondino National Neurological Institute, Pavia, Italy, 6Department of Emergency Neurology, C. Mondino National Neurological Institute, Pavia, Italy, 7Brain Connectivity Center, C. Mondino National Neurological Institute, Pavia, Italy, 8Department of Brain and Behavioral Sciences, University of Pavia, Pavia, Italy, 9Department of Physics, University of Pavia, Pavia, Italy, 10Department of Electrical, Computer and Biomedical Engineering, University of Pavia, Pavia, Italy, 11Neuroradiological Academic Unit, Department of Brain Repair and Rehabilitation, Institute of Neurology, University College London, London, United Kingdom, 12Lysholm Department of Neuroradiology, National Hospital for Neurology and Neurosurgery, UCL Hospitals Foundation Trust, University College London, London, United Kingdom
Synopsis
Single-TI Arterial Spin Labeling (ASL) is sensitive to delayed arterial arrival time (AAT) of blood in the tissues. Multi-TI was introduced to overcome this limitation. Moreover, it allows estimating AAT that, therefore, can shed some light in the characterization of the brain haemodynamic processes. In this study, we compare the reliability of the multi-TI approach to the single-TI in a test-retest protocol. The sequence tested was the Siemens product sequence FAIR PASL with 3D-GRASE readout. Results show an overall good level of reliability both in single- and multi-TI, but also a possible sensitivity to the macro-vascular component in multi-TI data.
Purpose
Quantification of CBF from Arterial Spin Labeling (ASL) measurements based on single-TI (inversion time) can be affected by artifacts due to prolonged arterial arrival time (AAT). Multi-TI sequences were proposed to overcome this limitation, allowing AAT estimation1. However, the reproducibility of product Multi-TI sequences and their estimates have not been yet completely investigated2,3. In this study, we test the reproducibility, in healthy subjects, of the Siemens product sequence FAIR PASL employing 3D-GRASE readout. To compare its robustness and limitations, both single-TI and multi-TI schemes were acquired.Methods
Data acquisition: A test-retest protocol was conducted on a 3T Siemens Skyra scanner. Six healthy subjects (age 27-34y) provided informed consent to the study. PASL (FAIR) labeling with a 4-segments 3D-GRASE readout (Single-TI: TI=2020ms, multi-TI: 10 TIs (360-2600ms, 250ms interval)) was used. Readout parameters were: echo train length 12, EPI factor 31, TR=3.5s resolution 3.8x3.8x5.25mm. Acquisition times: multi-TI 9’27” (2 averages) single-TI 3’51” (8 averages). T1-MPRAGE: resolution 1.1x1.1x1.2mm, TR/TE=2300/2.95ms. Saturation Recovery (SR) with same readout of ASL sequences (TI=1,2,4s).
Each ASL acquisition scheme (two acquisitions with a repositioning) was acquired in two consecutive days. Special attention was paid in order to reduce environmental variability and make the scanning sessions as similar as possible (scans at the same time, no coffee during the previous 12 hours, etc.4).
T1-MPRAGE images were parcellated using the Multi Atlas Label Fusion technique5 to define 26 ROIs. Each ROI was then moved to the ASL native space using ANTS6. M0 and T1 maps were calculated from the SR curve.
Single-TI: Absolute CBF [ml/100g/min] maps were obtained using the standard ASL consensus paper formula7. The voxel-wise M0 map obtained with the SR was used as calibration scan. Average CBF and standard deviation were calculated in each ROI.
Multi-TI: Variational Bayesian inference, implemented in Basil (FSL)8 was used to estimate CBF and AAT maps. The model included the macro-vascular component. Average CBF and AAT and standard deviations were calculated in each ROI. Voxels in the peak tag-control subtraction map with intensity higher than the 95th percentile of the total distribution were excluded from the calculations being considered as outliers.
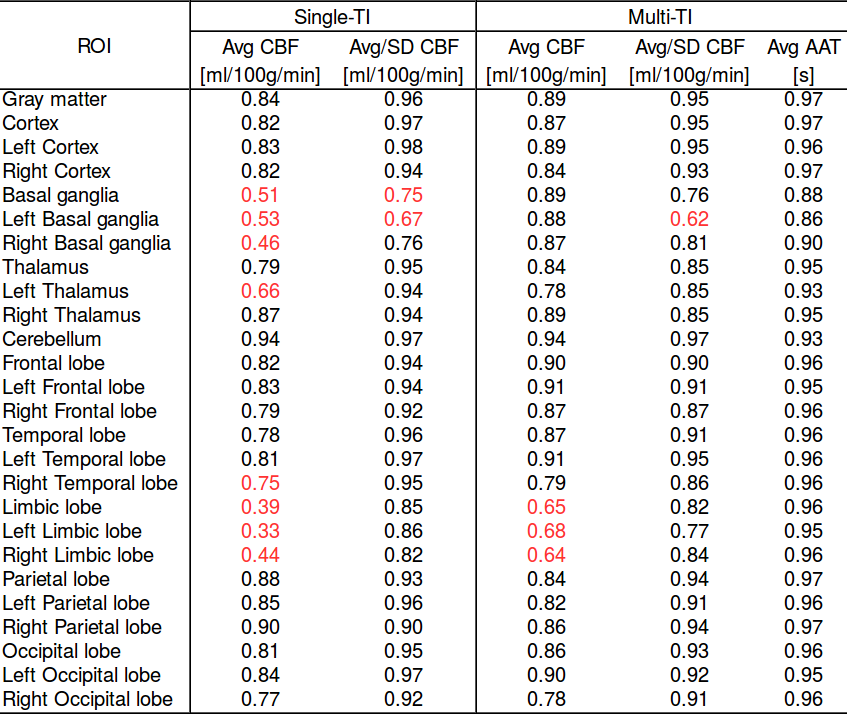
Statistical analysis: The Pearson correlation coefficient was calculated to address the correlation between each scans pair. Intraclass correlation coefficient (ICC) was used to assess the test-retest reliability of the two acquisition schemes in the obtained ROIs. In particular, ICC was obtained from the mean CBF, the mean CBF normalized to the standard deviation in the ROI, and from the mean AAT values.
Results
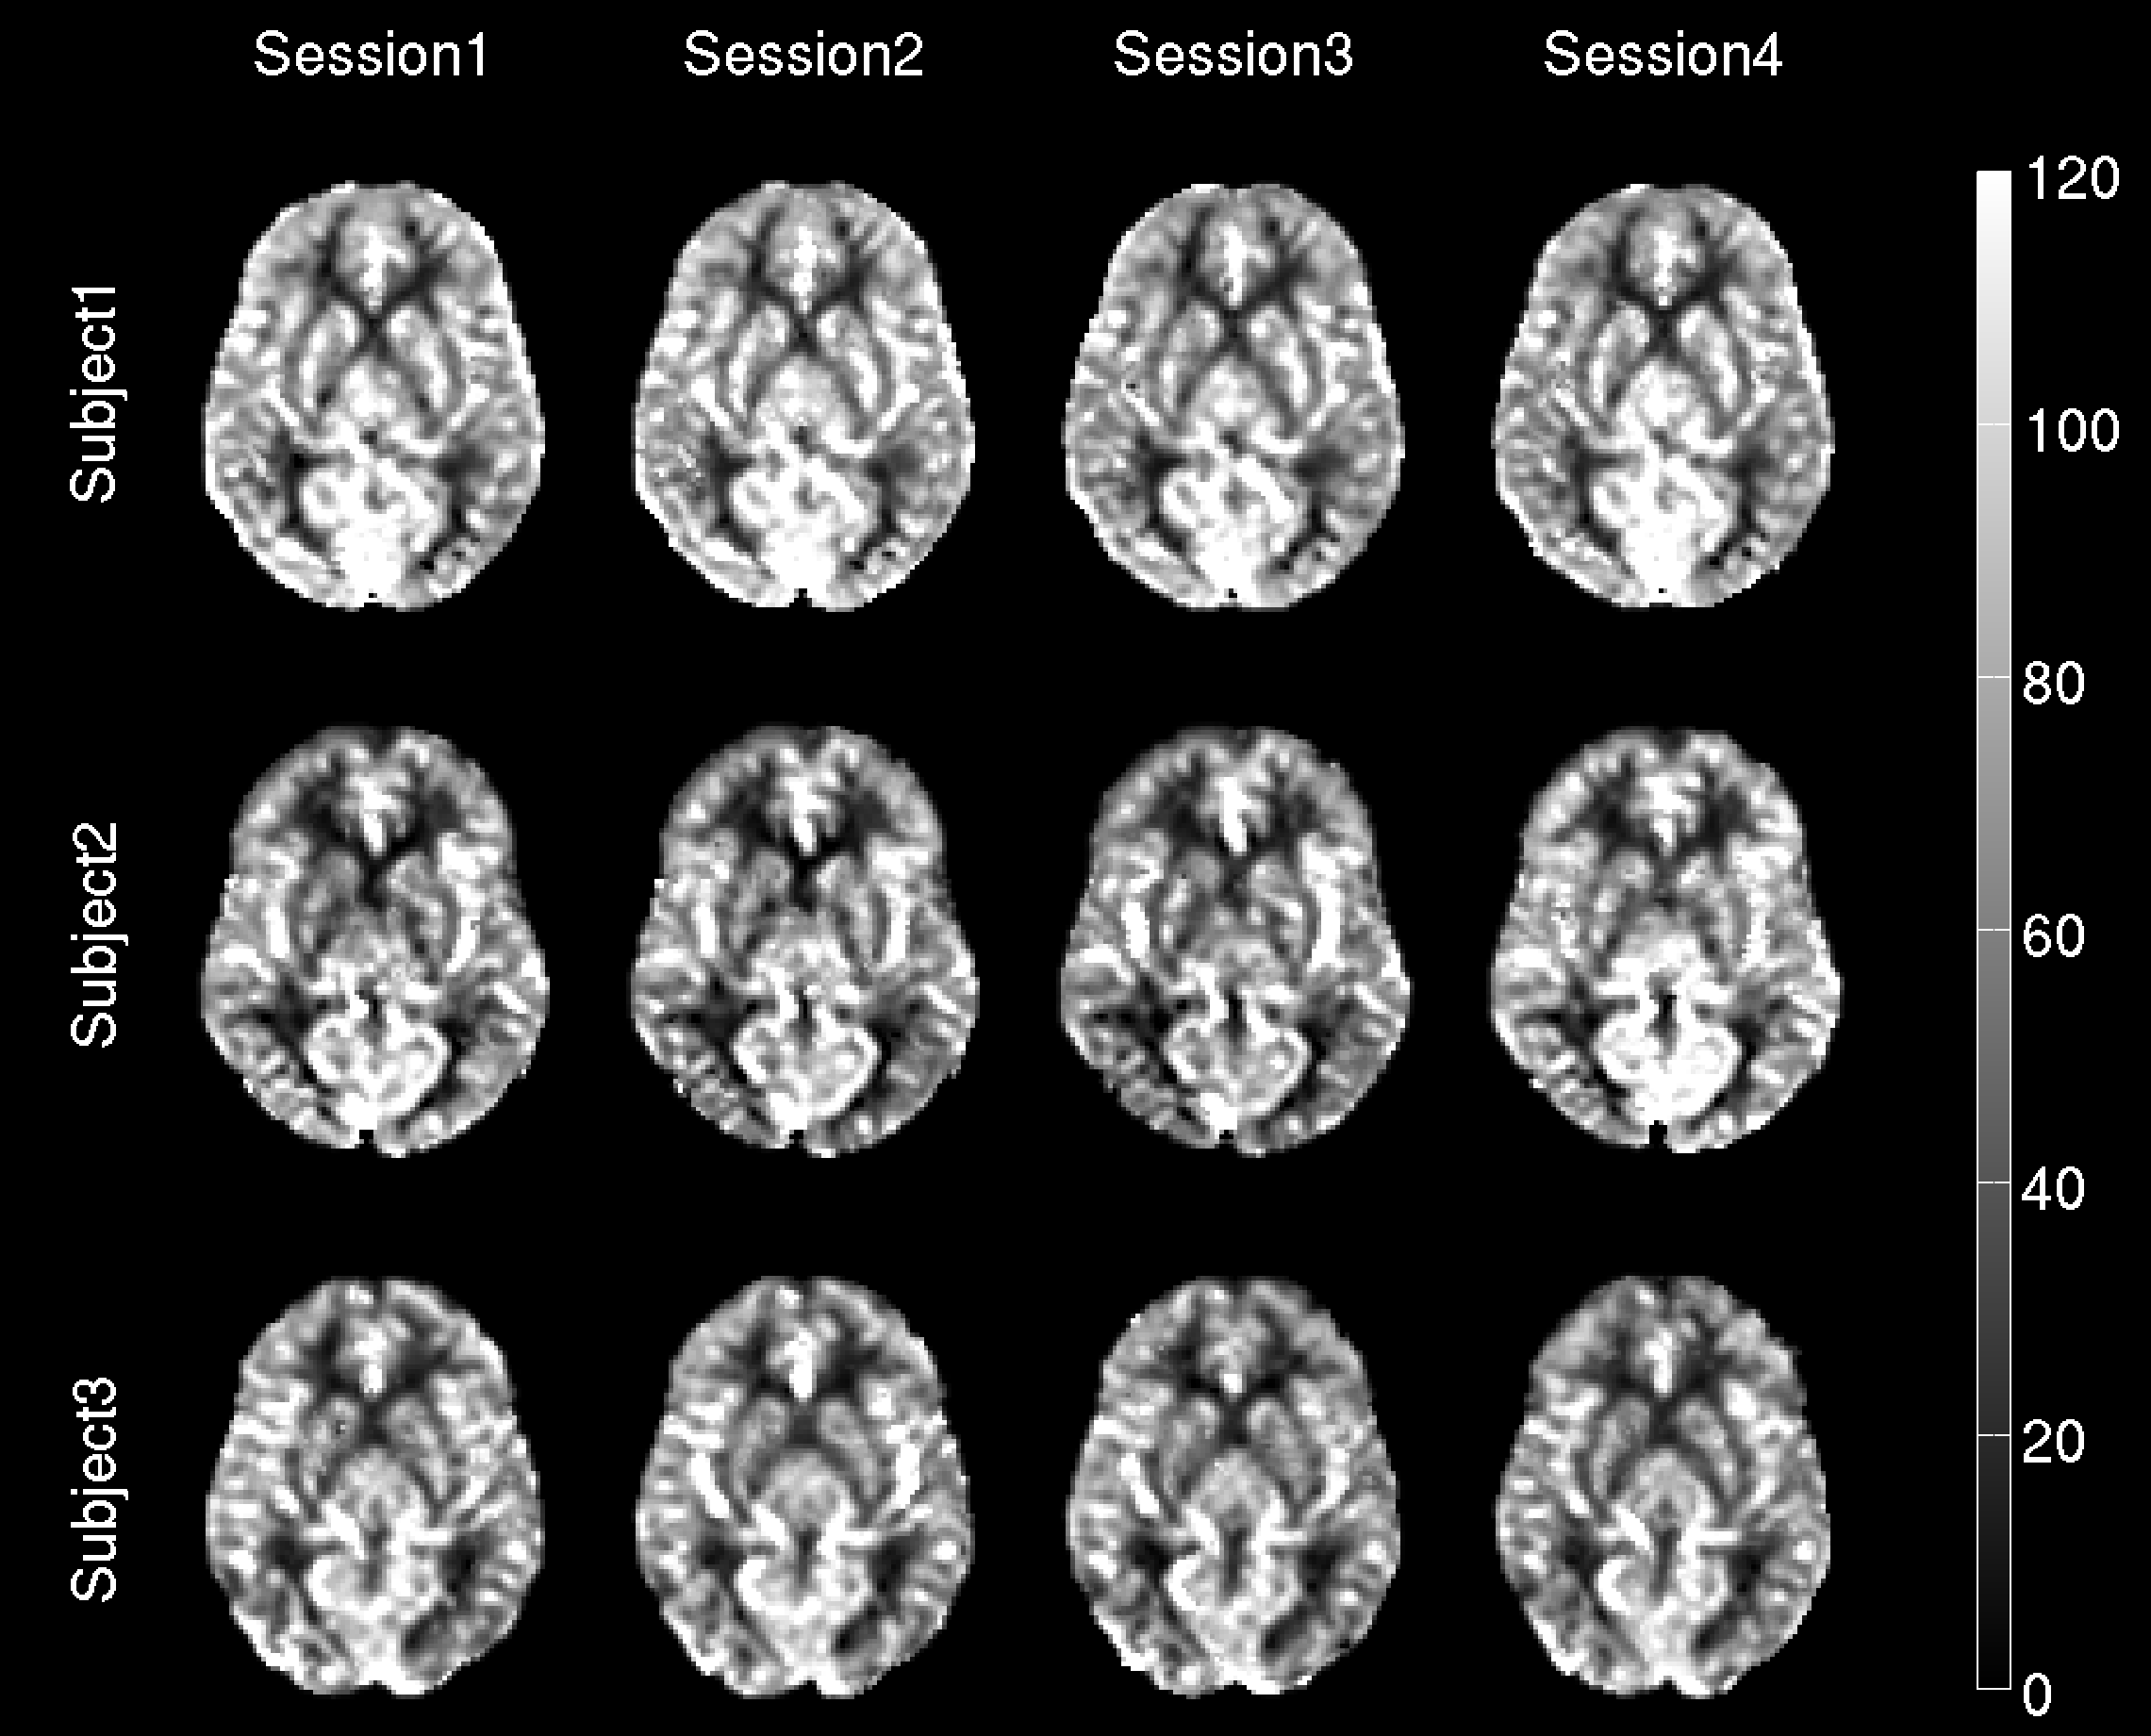
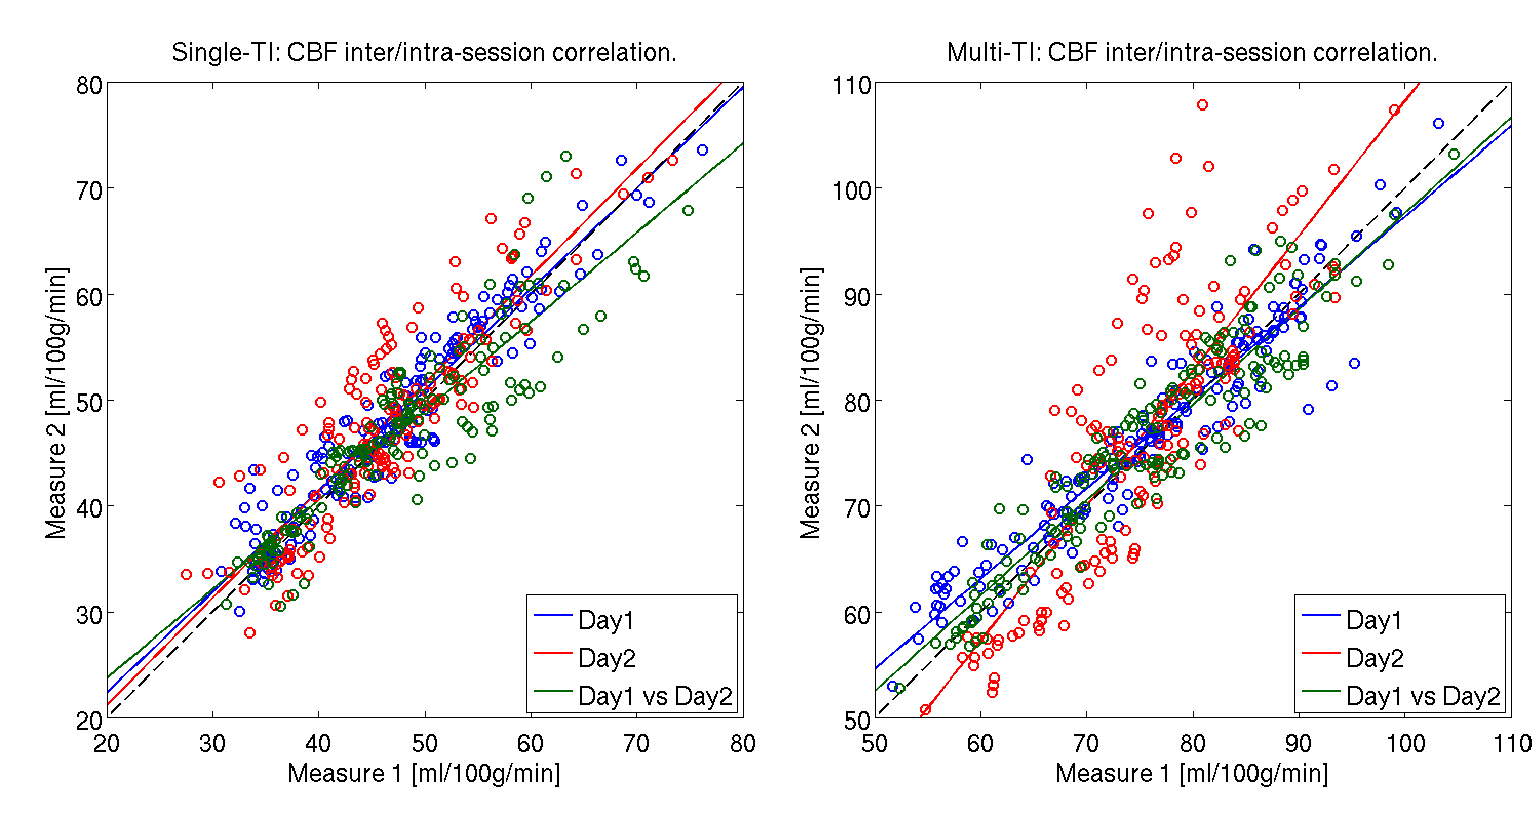
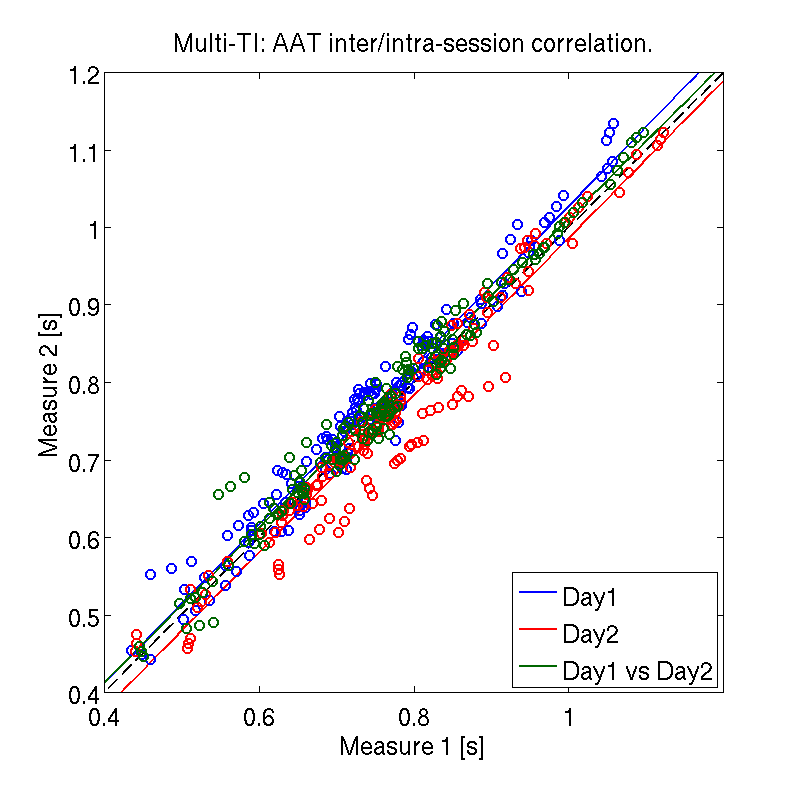
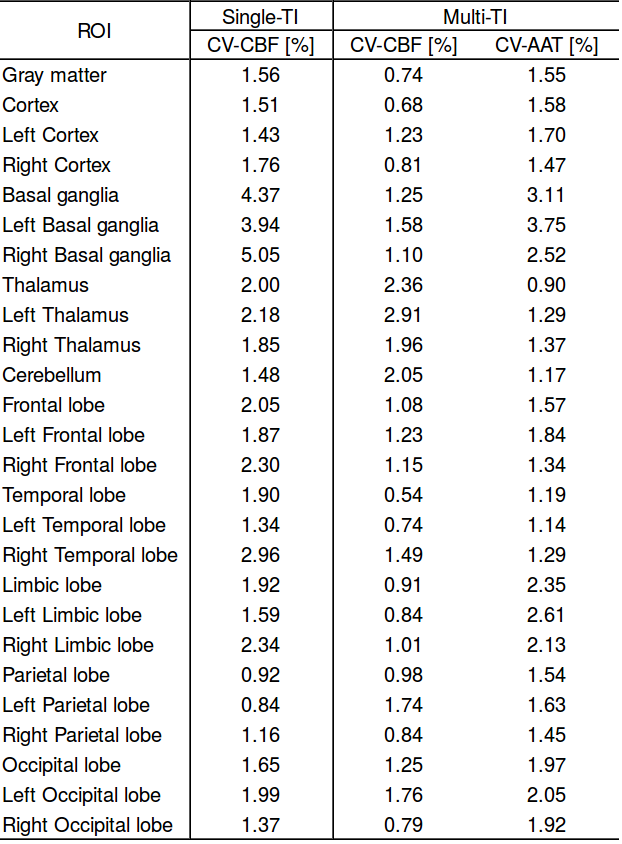
The CBF values of both gray and white matter were comprised in a reasonable physiological range. Representative CBF estimates in the basal ganglia are reported for each acquisition (Fig.1). Scatter plots of intra-session and inter-session mean CBF in multi-TI and single-TI are illustrated in Fig. 2. Scatter plot of AAT for each ROI is shown in Fig. 3. Coefficients of variation (CV) of CBF and AAT are shown in Tab. 1. ICC values calculated on mean CBF and normalized mean CBF for both schemes and mean AAT are summarized in Tab. 2. For CBF the minimum ICC was found for the Limbic Lobe (ICC single/multi-TI 0.39/0.64) and the more reliable structure was the Cerebellum (ICC single/multi-TI 0.94/0.94). AAT ICC was greater than 0.85 for all ROIs.Discussion
The scatter plots of mean CBF values show a slightly higher dispersion in multi-TI compared to single-TI; also, they do not highlight any explicit difference between intra-session and inter-session correlation. Nonetheless, ICC results for the multi-TI method show a slightly higher degree of reproducibility than the single-TI, in all the selected ROIs. The limbic area shows low ICC values with both sequences. ICCs calculated on CBF weighted over the standard deviation are higher compared to the formers, especially in the limbic area. This suggests that the spatial dispersion of CBF values inside the ROIs represents the strongest source of intra-subject variability. Finally, AAT showed a very high degree of reproducibility in the considered ROIs.Conclusion
Multi-TI PASL is a powerful tool that can be used to further characterize the brain haemodynamic processes both for research and clinical purposes. The reproducibility assessed with ICC was considered good (ICC>0.75) in the majority of the brain anatomical regions, with exceptions of the limbic area. The tested protocols appear to be both sufficiently reliable: the choice between multi- and single-TI depends on the available time for the acquisition and whether AAT data are needed. It is essential, however, to assess whether the reproducibility obtained with the specific protocol selected is acceptable for each clinical applications or research study.Acknowledgements
ASL in Dementia COST action; Neurological Institute C. Mondino; Department of Information Engineering, University of Padova; National Institute for Health Research; part of this work was supported by the National Institute for Health Research, University College London Hospitals, Biomedical Research Centre.References
1. MacIntosh BJ, Filippini N, Chappell MA, Woolrich MW, Mackay CE, and Jezzard P, Assessment of arterial arrival times derived from multiple inversion time pulsed arterial spin labeling MRI. Magn Reson Med. 2010; 63(3): 641-7.
2. Krammea J, Gregori J, Diehl V, Madai VI, von Samson-Himmelstjernaa FC, Lentschigd M, Sobeskye J, and Günther M. Improving perfusion quantification in arterial spin labeling for delayed arrival times by using optimized acquisition schemes. Zeitschrift für Medizinische Physik 2015; 25(3): 221–229.
3. Gevers S, van Osch MJ, Bokkers RP, Kies DA, Teeuwisse WM, Majoie CB, Hendrikse J, Nederveen AJ. Intra- and multicenter reproducibility of pulsed, continuous and pseudo-continuous arterial spin labeling methods for measuring cerebral perfusion. J. Cereb. Blood. Flow. Metab., 2011; 31(8): 1706-15.
4. Clement P, Mutsaerts HJ, Ghariq E, Smits M, Acou M, Rostrup E, Pizzini FB, Wiest R, Kononen M, Jovicich J, Vanninen R, Bastos-Leite AJ, Larsson EM, and Achten E. Review of confounding effects on perfusion measurements. Front. Hum. Neurosci., 2014.
5. Wang H, Suh JW, Das SR., Pluta JB, Craige C, and Yushkevich PA. Multi-atlas segmentation with joint label fusion. IEEE Trans. Pattern Anal. Mach. Intell., 2013; 35(3): 611–623.
6. Avants BB, Epstein CL, Grossman M, Gee JC. Symmetric diffeomorphic image registration with cross-correlation: Evaluating automated labeling of elderly and neurodegenerative brain. Med Image Anal. 2008; 12(1): 26-41.
7. Alsop DC, Detre JA, Golay X, Gunther M, Hendrikse J, Hernandez-Garcia L, Lu H, MacIntosh BJ, Parkes LM, Smits M., van Osch MJP, Wang DJJ, Wong EC, and Zaharchuk G, Recommended Implementation of Arterial Spin-Labeled Perfusion MRI for Clinical Applications: A Consensus of the ISMRM Perfusion Study Group and the European Consortium for ASL in Dementia. Magn. Reson. Med. 2014.
8. Chappell MA, Groves AR, Whitcher B, Woolrich MW. Variational Bayesian Inference for a Nonlinear Forward Model. IEEE Trans Signal Process. 2009; 57(1): 223-236.
Figures