1870
Targeted-FOV DWI can better depict the microemboli-induced renal lesions comparing to conventional full-FOV DWI1Academy for Advanced Interdisciplinary Studies, Peking University, Beijing, People's Republic of China, 2Philips Healthcare, Suzhou, People's Republic of China, 3College of Engineering, Peking University, Beijing, People's Republic of China, 4Department of Radiology, Peking University First Hospital, Beijing, People's Republic of China, 5Renal Division, Peking University First Hospital, Beijing, People's Republic of China, 6Institute of Science and Technology for Brain-Inspired Intelligence, Fudan University, Shanghai, People's Republic of China
Synopsis
DWI suffers from problems of severe geometric distortion and artifacts due to the susceptibility gradients and long echo train length (ETL), and the spatial resolution is quite limited due to the single-shot EPI acquisition scheme. This study investigates the utility of a targeted-FOV (TFOV) DWI technique in characterizing acute renal injure caused by microemboli injection in animal models. Compared with full-FOV DWI, the TFOV DW images show apparently higher image quality and better depiction of renal lesions. The advantage of TFOV DWI technique in characterizing microemboli-induced acute renal injure in is quite obvious.
Introduction
Diffusion-weighted imaging (DWI) is sensitive to both cellular edema and atrophy, and seems to be particularly useful for the assessment of renal injure induced by acute or chronic hypoxia1. Nevertheless, DWI suffers from problems of severe geometric distortion and artifacts due to the susceptibility gradients and long echo train length (ETL), and the spatial resolution is quite limited due to the single-shot EPI acquisition scheme. One solution to deal with this problem is to reduce the excitation field of view (FOV) to a targeted kidney with a specially designed 2D-RF pulse2.Purpose
The purpose of this study is to investigate the utility of a targeted-FOV (TFOV) DWI technique in characterizing acute renal injure caused by microemboli injection in animal models.Materials and Methods
In vivo study
All the experiments were performed in accordance with National Institutes of Health approved guidelines of the Animal Care and Use Institutional Committee on 7-8 week old New Zealand White rabbits (n = 18, weight range 2.5-3.5 kg). Under anesthesia with sodium pentobarbital (30 mg/kg body weight), microspheres (acryl beads, 40 to 120 um in diameter) suspended in 2.0 ml of physiological saline were injected slowly into the ostium of the right renal artery through a catheter.
MR imaging
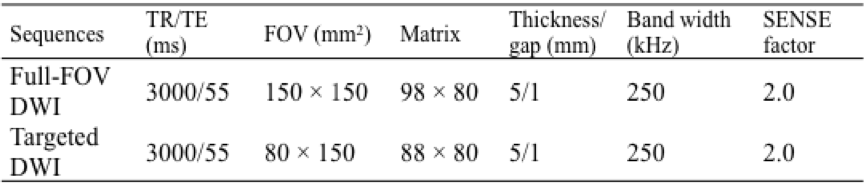
MRI experiments were performed on a 3.0 T whole-body MRI system (Achieva, Philips Medical Systems, Best, The Netherlands), with a maximum gradient strength of 80 mT/m and a slew rate of 200T/m/s. Body coil was used for signal transmission, and an 8-channel knee coil was applied for signal reception.
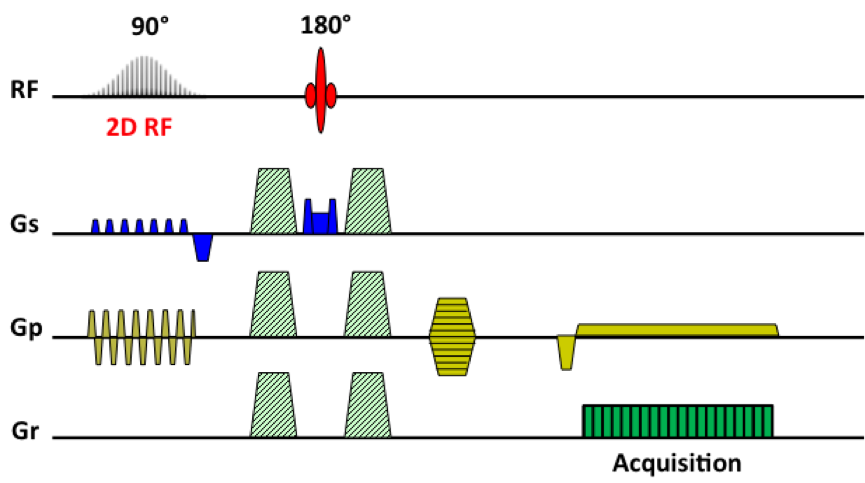
Each rabbit was placed in a supine position and the middle of the kidney was at the isocenter of the magnet. During the MRI experiments, anesthesia was induced with isoflurane (1.0 L/min) delivered by a facemask. The diagram of the TFOV DWI sequence is described in Fig 1. A 2D-RF pulse was introduced in the TFOV DWI sequence to replace the conventional 90° excitation pulse. For comparison, full-FOV DWI images were acquired with identical imaging parameters as TFOV DWI except for different scanning FOV. Imaging parameters for full-FOV DWI and TFOV-DWI sequences are displayed in Table 1. Each scan consisted of 3 diffusion-encoding directions with b = 1000 s/mm2 and a b = 0 s/mm2 image. The phase-encoding (PE) direction was defined to superior-inferior (SI). A nonselective fat saturation pulse was applied to suppress fat signal. All scans were performed during free breathing.
Results
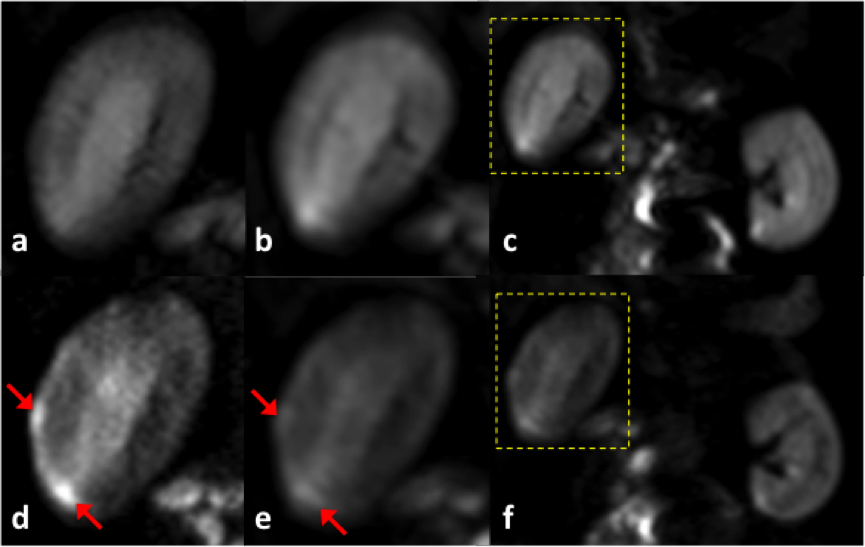
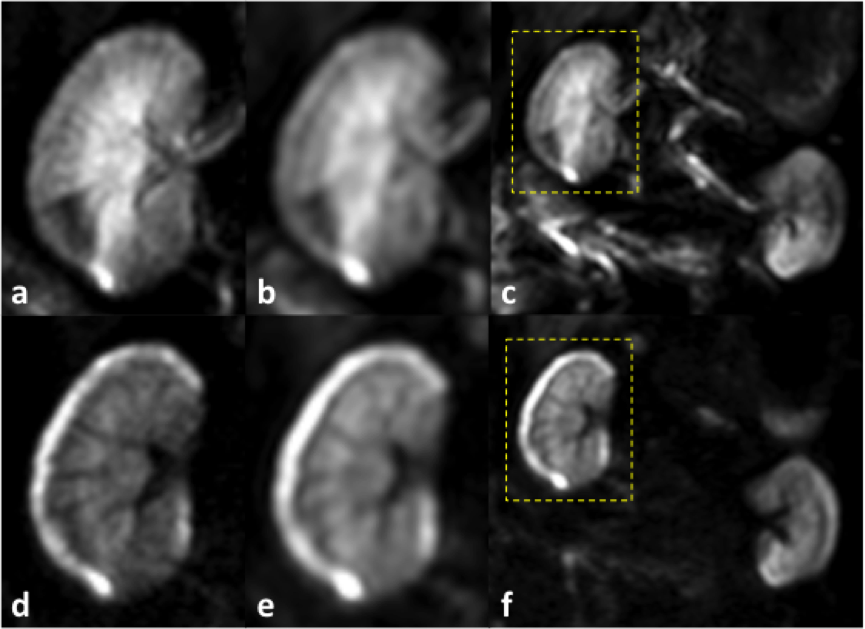
Representative DW images of the coronal kidney acquired using full-FOV DWI and TFOV DWI sequences are shown in Fig.2-4. Compared with full-FOV DWI, the TFOV DW images show apparently better image quality with sufficient depiction of the cortico-medullary structure of the kidneys (Fig.2-4). Fig.2 demonstrates a multi-focal renal damage in DWI (marked with red arrows). The lesions are better depicted in the TFOV DW image (b = 1000 s/mm2) comparing to conventional full-FOV DW image.
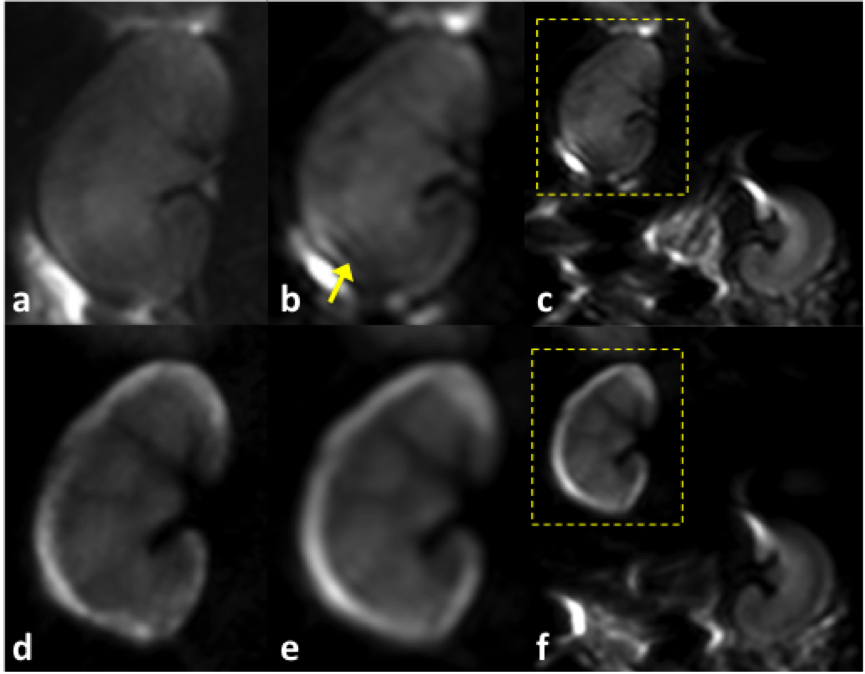
Another case is shown in Fig.3, where the TFOV DWI sequence effectively reduced the artifacts and distortion (marked with yellow arrow). Besides, another example demonstrates that the full-FOV DW images (Fig.4b,e) suffer from strong spatial blurring along the phase-encoding (PE) direction. But the blurring was dramatically reduced in the TFOV DW images (Fig.5a,d) due to higher spatial resolution and shorter ETL.
Discussion & Conclusion
The targeted-FOV DWI approach used in single renal imaging was successful in suppressing signal from outside of the planned FOV. Significantly higher image quality and better depiction of the renal damage caused by microemboli injection were obtained with this TFOV DWI technique. In the animal model, microemboli lodge in small arteries and produce a microcrystalline angiitis, characterised by an endothelial inflammatory reaction developing in a stepwise pattern. Since the DWI technique allows noninvasive evaluation of water transport function of the kidney, it is particularly useful for the detection of microemboli-induced acute kidney injure.Acknowledgements
No acknowledgement found.References
1. Ries M, et al. Journal of Magnetic Resonance Imaging, 2003, 17(1):104–113.
2. Saritas E U, et al. Magnetic resonance in medicine, 2008, 60(2): 468-473.
Figures