1869
The influence of rat strain on multi-parametric white matter metrics – a Tractometry study1CUBRIC, Cardiff University, Cardiff, United Kingdom
Synopsis
White matter macrostructural organization and its microstructural composition are two complementary features that may help understand intact brain development, function and brain impairment. The Tractometry framework, which aims to characterise white matter by multi parametric MR metrics, was applied on 3 rat strains (Wistar, SD and Lewis). In this study we examined the impact of rat strain on microstructural features of white matter in the brain, which is suspected to origin from their genetics background.
Introduction and Aims
White matter macrostructural organization and its microstructural composition are two complementary features that may help understand intact brain development, function and brain impairment. For these purposes, the Tractometry [1] framework was developed to provide higher specificity to microstructural features of fiber pathways in the brain by integrating information from multiple white matter imaging contrasts. Previous studies [1-4] employed tractometry to explore variations of diffusion and relaxometry indices of major fiber pathways in the human and rodent brain. In this study we wish to explore the pathways of three different strains of rats (Wistar, SD and Lewis), aiming to expose the impact of genetic background upon their neuronal connectivity and composition. We have acquired a range of different imaging modalities such as DTI [5], CHARMED [6], qMT [7] and T1-MRI.Methods and Analysis
3 strains of rats (N=13 each strain, 12 week-old male rats) were used in this study: Wistar, Sprague Dawley and Lewis. MRI was performed on a 7T/30 MRI scanner (Bruker, Germany) equipped with a 400 mT/m gradient system, using a cross coils setup of body-coil (outer/inner diameter of 112/72 mm) and a quadrature coil (15 mm diameter) as a receiver. The tractometry battery comprised a series of scanning protocols (DTI, CHARMED, qMT and T1) that were acquired with similar brain coverage, geometrical properties and image resolution of 0.2 x 0.2 x 1 mm3. For qMT, 2 flip angles of 1000o and 2800o with 12 offsets (range 1000 to 30000 Hz) was used. T1 was measures by multi flip angle approach of 6o, 12o, 24o and 48o. CHARMED was acquired with 3 b values of 1000, 2000 and 4000 s/mm2 with 30 noncollinear directions, where the data collected at b =1000 s/mm2 served as the DTI scan. The total time scan time was 1.5 hours. Overall, nine microstructural MRI metrics were measured in this study: T1, qMT and CHARMED analyses were computed using in-house Matlab (Mathworks) scripts to extract the exchange rate (k), the relative concentration of macromolecular protons (F), their T2 (T2b) and axonal density (FR). DTI metrics were computed using ExploreDTI [8] including the fractional anisotropy (FA), mean diffusivity (MD), axial and radial diffusivities (AD and RD respectively). In addition, whole brain tractography analysis was performed in ExploreDTI. The microstructural metrics were projected upon the whole brain tractography map to generate a set of nine structural-based values tractography maps for each rat. For example, each streamline in the brain denotes the value of the MR metric (i.e., Fr/FA/MD and etc), and then a mean value was measured based on the entire brain streamlines. In addition, the tractography map was used for visualization purposes. The MR datasets of each rat underwent motion-correction and coregistration procedures (SPM8, http://www.fil.ion.ucl.ac.uk/spm/) both in the intra-subject and inter-subject levels.Results
For tractometry analysis and demonstration, whole brain tractography was performed to resolve major fiber pathways in the rat brain (see the segmented brain in the inset of the figure). To assess the impact of rat strain on each microstructural metric, two way analysis of variance (ANOVA) analysis was performed where values lower than 0.05 were considered significant. Then the voxels' p-value of each metric were projected on a representative tractography map for visualization (see figure). In most diffusion and relaxometry metrics, the impact of r strain was mainly found at the corpus callosum, cingulum and optic and cortico-spinal tracts. Note that impact of rat strain was more pronounced in Fr than in FA, shows the higher sensitivity of CHARMED to pathway microstructural features than DTI. On the other hand, there was barely any impact of rat strain on qMT based metrics (k and F). Finally, both T1 and T2b relaxometrics were informative and provided complementary information to DTI and CHARMED.Summary
In this study we used the tractometry framework to discover differences in the rat brain fiber-systems derived from genetic background. We characterized the entire brain fiber systems based on their microstructural MR features, and showed the sensitivity of these metrics to reveal differences in the microstructural organization and composition of white matter pathways.Acknowledgements
No acknowledgement found.References
1. Bells et.al ISMRM (2011)
2. De Santis et.al ISMRM (2012)
3. De Santis et.al Neuroimage (2013)
4. Barazany et.al ISMRM (2014)
5. Basser et.al J Magn Reson B (1994)
6. Assaf et.al Neuroimage (2005)
7. Sled and Pike MRM (2001)
8. Leemans et al. ISMRM (2009)
Figures
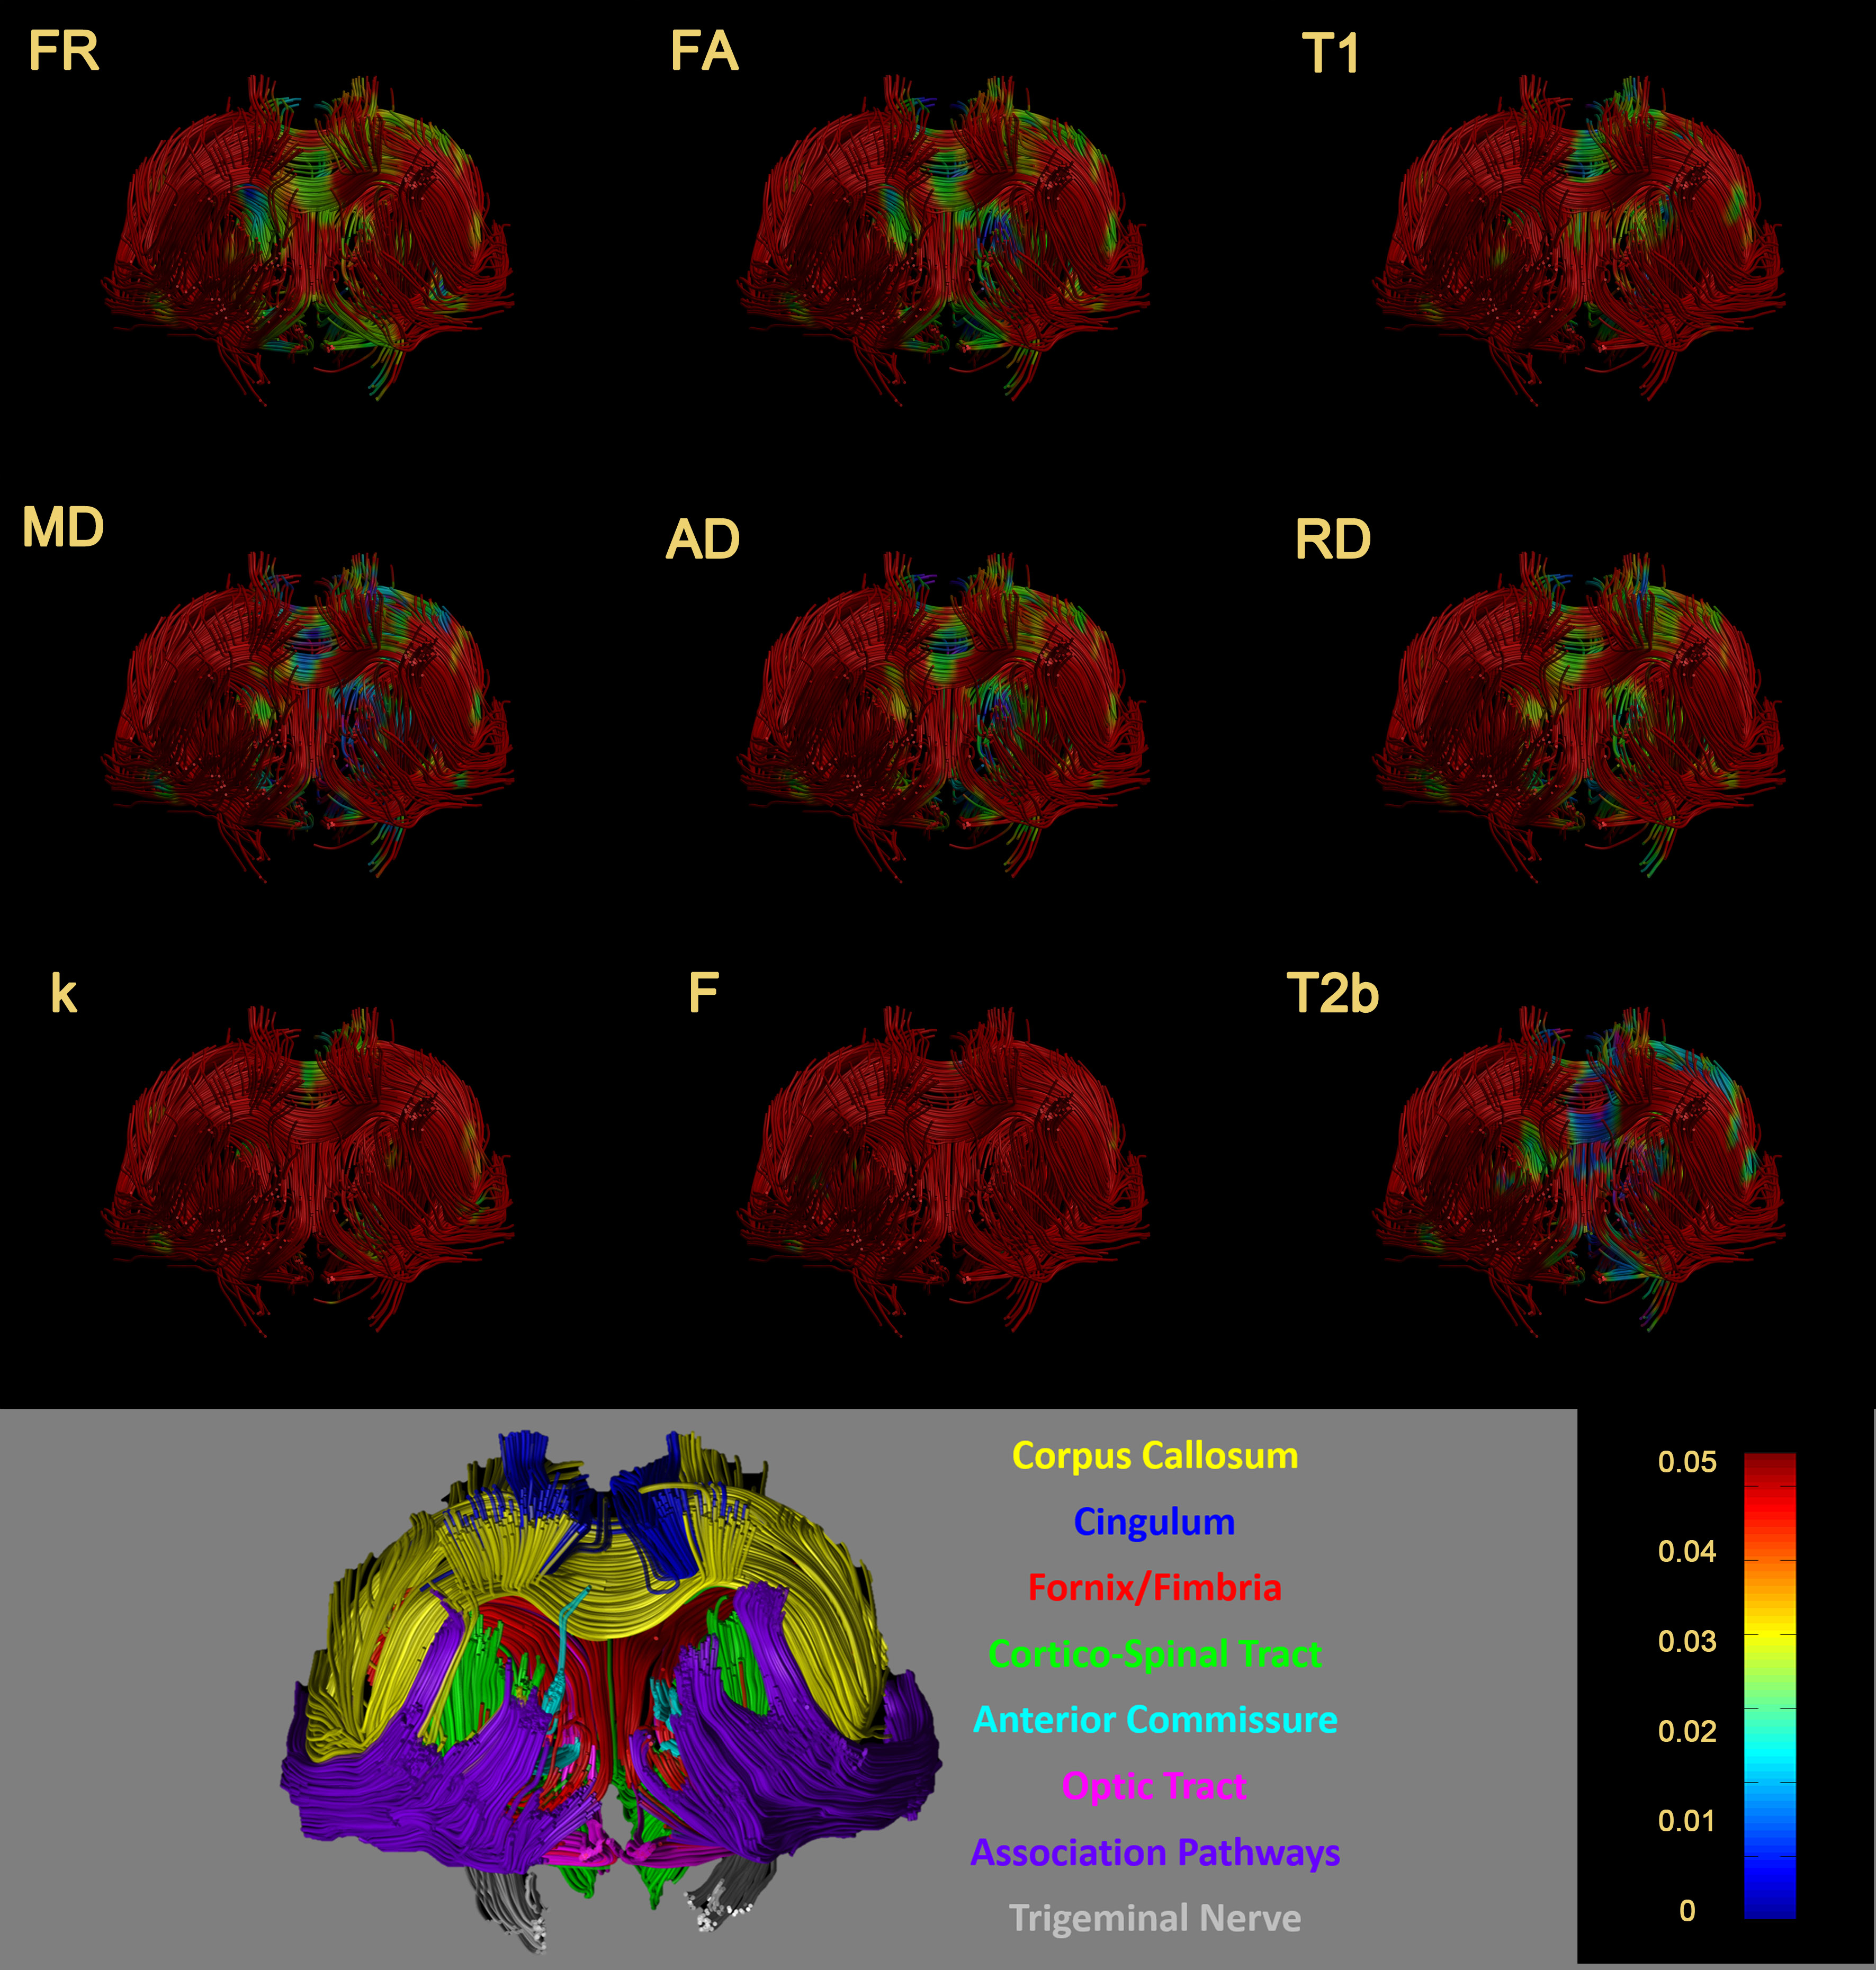
Statistical analysis of multiple tractometrics between rat strains.
A set of nine microstructural-based tractography maps were calculated for each rat. These maps underwent two-way ANOVA to assess differences between rat strains This figure displays the p-values of each metric projected on a template tractography map (pv<0.05 is considered significant).