1853
Applied Research of Diffusion Tensor Imaging in traumatic tibial nerve injuryXiaojuan Wang1,2, Chen Zhao2, Kening Xu1, and Lizhi Xie3
1Radiology Department of the 251 st Hospital of PLA, Zhangjiakou, People's Republic of China, 2HeBei North University, Zhangjiakou, People's Republic of China, 3GE Healthcare, MR Research China, BeiJing, People's Republic of China
Synopsis
DTI plays an important role in detecting nerve injury. It offers a great opportunity for imaging the tibial nerve injury follow trauma.In this work, we demonstrated DTI combined with DTT can clearly review the morphological transformation of Nerve fiber after tibial nerve injured; quantitatively analyze the damage degree,which can provide detailed information for clinical treatment.
Purpose
The purpose of this study is to investigate the value of diffusion tensor imaging (DTI)in traumatic tibial nerve injury using 3.0T MR technology.Introduction
Knee joint injuries are common and often accompanied by tibial nerve damage. Tibial nerve injury is susceptible to misdiagnosis in clinic due to the lack of effective diagnostic method. The regular electrophysiological examination fails to show its diagnostic value on patients with inobvious symptoms and signs. On the other hand, the traditional imaging examination can barely estimate the degree of injuries. The recently developed DTI is a functional magnetic resonance imaging tool, which can non-invasively and quantitatively estimate the degree of nerve damage by using the fractional anisotropy (FA) and average apparent diffusion coefficient (ADC) as indicators. Diffusion tensor tractography (DTT) can explicitly track the fiber arrangements and visually demonstrated the nuronal lesions such as modifications in demyelination levels. Therefore, DTI was introduced in the current study to evaluate its application on traumatic tibial nerve injury.Materials and Method
The study included a retrospective review for 15 cases of patients diagnosed with tibial nerve injury and another 15 cases of healthy controls, which were divided into injured and control group. All the subjects underwent examinations using a 3.0T MR scanner (GE Signa HDXT) with routine scanning sequence and additional DTI sequence. The applied imaging parameters are as follows: FSE T2WI:TR = 4940 ms, TE = 86.1 ms, FOV = 18 x 18cm, NEX =2, slice-thickness = 3.0 mm, slice-gap = 0 mm;T1WI :TR = 780ms, TE = 12.5ms, FOV = 18 x 18cm, NEX =2, slice-thickness = 4.0 mm, slice-gap = 0.4 mm; DTI:TR = 9750ms, TE = 82.7ms, ETL15,b value=1000,FOV = 22 x 22cm, NEX =2, slice-thickness = 5.0 mm, slice-gap = 0mm,acquisition-matrix = 130 x 128. The MR images were blindly reviewed and analyzed by two independent observers who have 4 and 9 years’ experience of MR diagnosis, respectively. FA and ADC values were derived using the FuncTool on GE AW4.6 workstation. The SPSS17.0 statistical software was used for the data analyses, where P value less than 0.5 was considered as statistically significant. Inter-group difference was investigated for FA value, ADC value and the receiver operating characteristic(ROC)curve between FA and ADC values using t-test. Finally, DTT was applied to track tibial nerve fibers and to assess the trend and morphology of the nerve fibers.Results
There was a significant difference in FA value between the injured (0.51±0.05)and control (0.58±0.05) groups ( t=-4.509, P<0.05, Table1). Moreover, a significant difference was observed in ADC value between the injured (1.43±0.07x10⁻³mm2/s )group and control (1.35±0.10x10⁻³mm2/s ) group (t=2.725, P<0.05, Table 2). The area under ROC curve of FA and ADC were 0.884 and 0.724, respectively. FA has a sensitivity of 0.733 and a specificity 0.934, while ADC has a sensitivity of 0.867 and a specificity 0.600 of ADC (Figure 1). DTI combined DTT can clearly demonstrate the normal or injured tibial nerve fibers (Figure 2,3).Conclusion
DTI combined DTT is an effective method for the evaluation of the tibial nerve injury in traumatic patients.Acknowledgements
No acknowledgement found.References
[1]Chhabra A, Zhao L, Carrino J A, et al. MR Neurography: Advances.[J]. Radiology Research & Practice, 2013, 2013(7):809568-809568.Figures
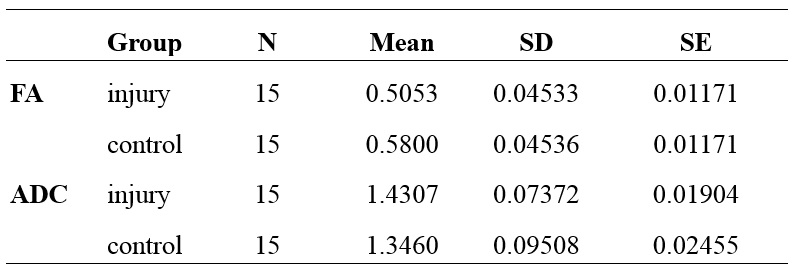
Table.1 The mean of FA and ADC values.
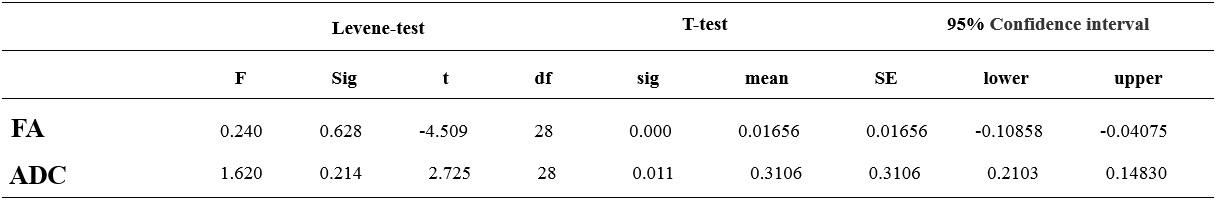
Table.2
T-test of the FA and ADC in control and injury
groups.
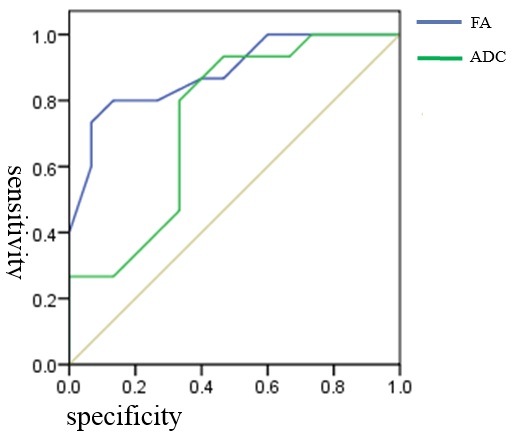
Figure.1 The ROC curves of FA and ADC in the patient group.
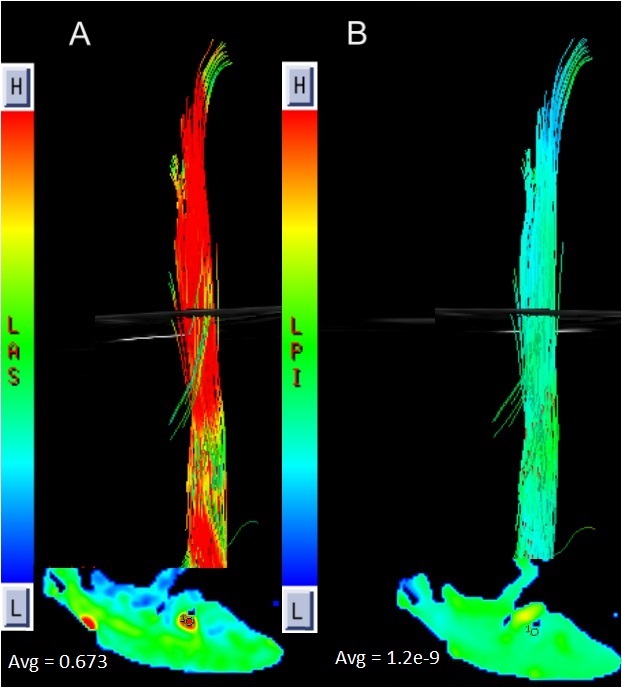
Figure.2 Images of a normal patient with the respective FA
and ADC values (DTT).
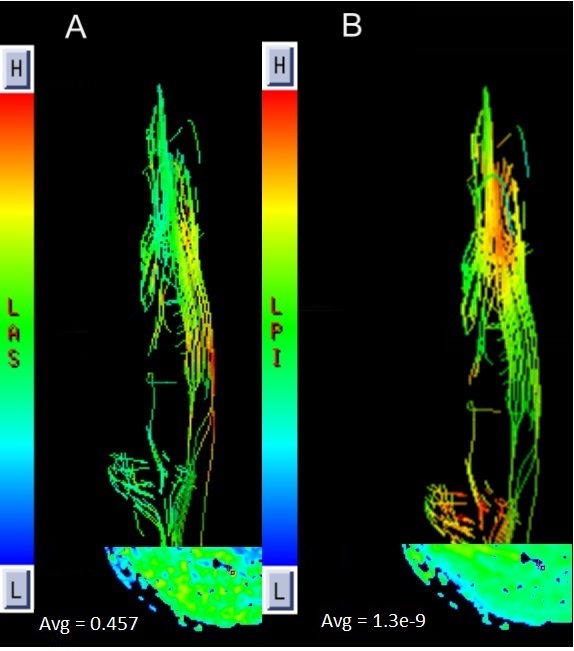
Figure.3 Images of an injury patient with the
respective FA and ADC value (DTT).