1852
Shortening acquisition time and increasing resolution to (1 mm)³ isotropic in 7T diffusion MRI (dMRI) still allows resolving fiber orientations and fiber crossings: a step towards clinical applications?1Biometry and Medical Informatics, University of Magdeburg, Magdeburg, Germany, 2Siemens Healthcare GmbH, Erlangen, Germany, 3Neurosurgery, University of Magdeburg, Magdeburg, Germany, 4Leibniz Institute for Neurobiology, Magdeburg, Germany, 5Neurology, University of Magdeburg, Magdeburg, Germany
Synopsis
Prior results in single-shot diffusion weighted EPI indicated that voxel sizes below (1.4mm)3 prohibit reliable resolution of fiber orientations and fiber crossings. Here we compare zoomed single-shot EPI with (1mm)³ isotropic resolution with readout-segmented EPI with (1.4mm)³ and (1.0mm)³ isotropic at ultra-high field strength of 7 Tesla. In all cases, fiber density orientation maps could be determined reliably thus enabling a resolution of main fiber directions and crossings even at (1mm)³ resolution.
Purpose
Currently, diffusion MRI with single-shot EPI at 1.5T and 3T is used with 2-3mm isotropic spatial resolution or highly anisotropic voxel size (high in-plane resolution with very thick slices). High resolution dMRI in general suffers from low SNR prohibiting reliable resolution of fiber orientations and fiber crossings[1]. In this study, we want to test and compare the two MR schemes zoomed partially parallel acquisition (ZOOPPA)[2] and readout-segmented EPI(rs-EPI)[3] at 7T for in-vivo high-resolution mapping of diffusion characteristics of human brain white as well as gray matter using fiber orientation density mapping. For clinical use the duration of the examination should be as short as possible. Thus single acquisition schemes are preferable. However, this requires a compromise between scanning a large volume-of-interest and acquiring the data with the highest possible resolution. Additionally, calculating reliable fiber orientation density maps requires at least about 60 gradient directions.Methods
Data were measured on a research 7Tesla whole-body MR scanner (Siemens Healthcare, Germany), equipped with a 70mT/m gradient coil(slew rate=200T/m/s).A 32-channel phased-array-head-coil(Nova Medical, USA) was used for head imaging. The protocol consisted of a high-resolution whole-head anatomic scan(MPRAGE, (1.0mm)³ isotropic resolution, two different Spin-Echo EPI diffusion-weighted MRI sequences, Stesjkal-Tanner[4,5] using the ZOOPPA[2] technique and readout-segmented EPI[3](rs-EPI) technique. ZOOPPA parameters:(1.0mm)³ iso voxel-size, 2 averages, TE=55.2ms, TR=9100ms, resolution=110x110, FoV=110mm; 64 slices, EchoSpacing=1ms, Bandwidth=1466Hz/Pixel, PartialFourier=6/8, 128 diffusion weighted(B=1000s/mm²) directions, 9 unweighted(B=0), GrappaFactor=3, 36 reference lines. The parameters lead to a scan time for one average of 22 minutes. Rs-EPI(readout-segmented EPI) parameters:(1.0mm)³, no average, TE1=59ms, TE2=93ms, TR=2900ms, resolution=194x194, FoV=194mm, 23 slices, EchoSpacing=0.4ms, Bandwidth=805Hz/pixel, GrappaFactor=3, Reference lines=39. We acquired 64 gradient directions,diffusion weighting of B=1000s/mm². Which led to a scan time of 19 minutes. Rs-EPI(readout-segmented EPI) parameters: (1.4mm)³, difference to (1.0mm)³ is FoV=195, resolution=140x140, TR=400ms, TE1=54ms, TE2=81ms, Bandwidth=1063Hz/pixel, Echo spacing=0.34ms. The 35 slices led us to a scan time of 26 minutes. Preprocessing was done using FSL for eddy current and motion correction. MRTrix 3.0 was used to calculate the FOD-maps[6] and the Track-density(TD) images(www.mrtrix.org). The TD-image was calculated from 50 million tracts whole brain fibertracking and 0.15mm resolution.Results and discussion
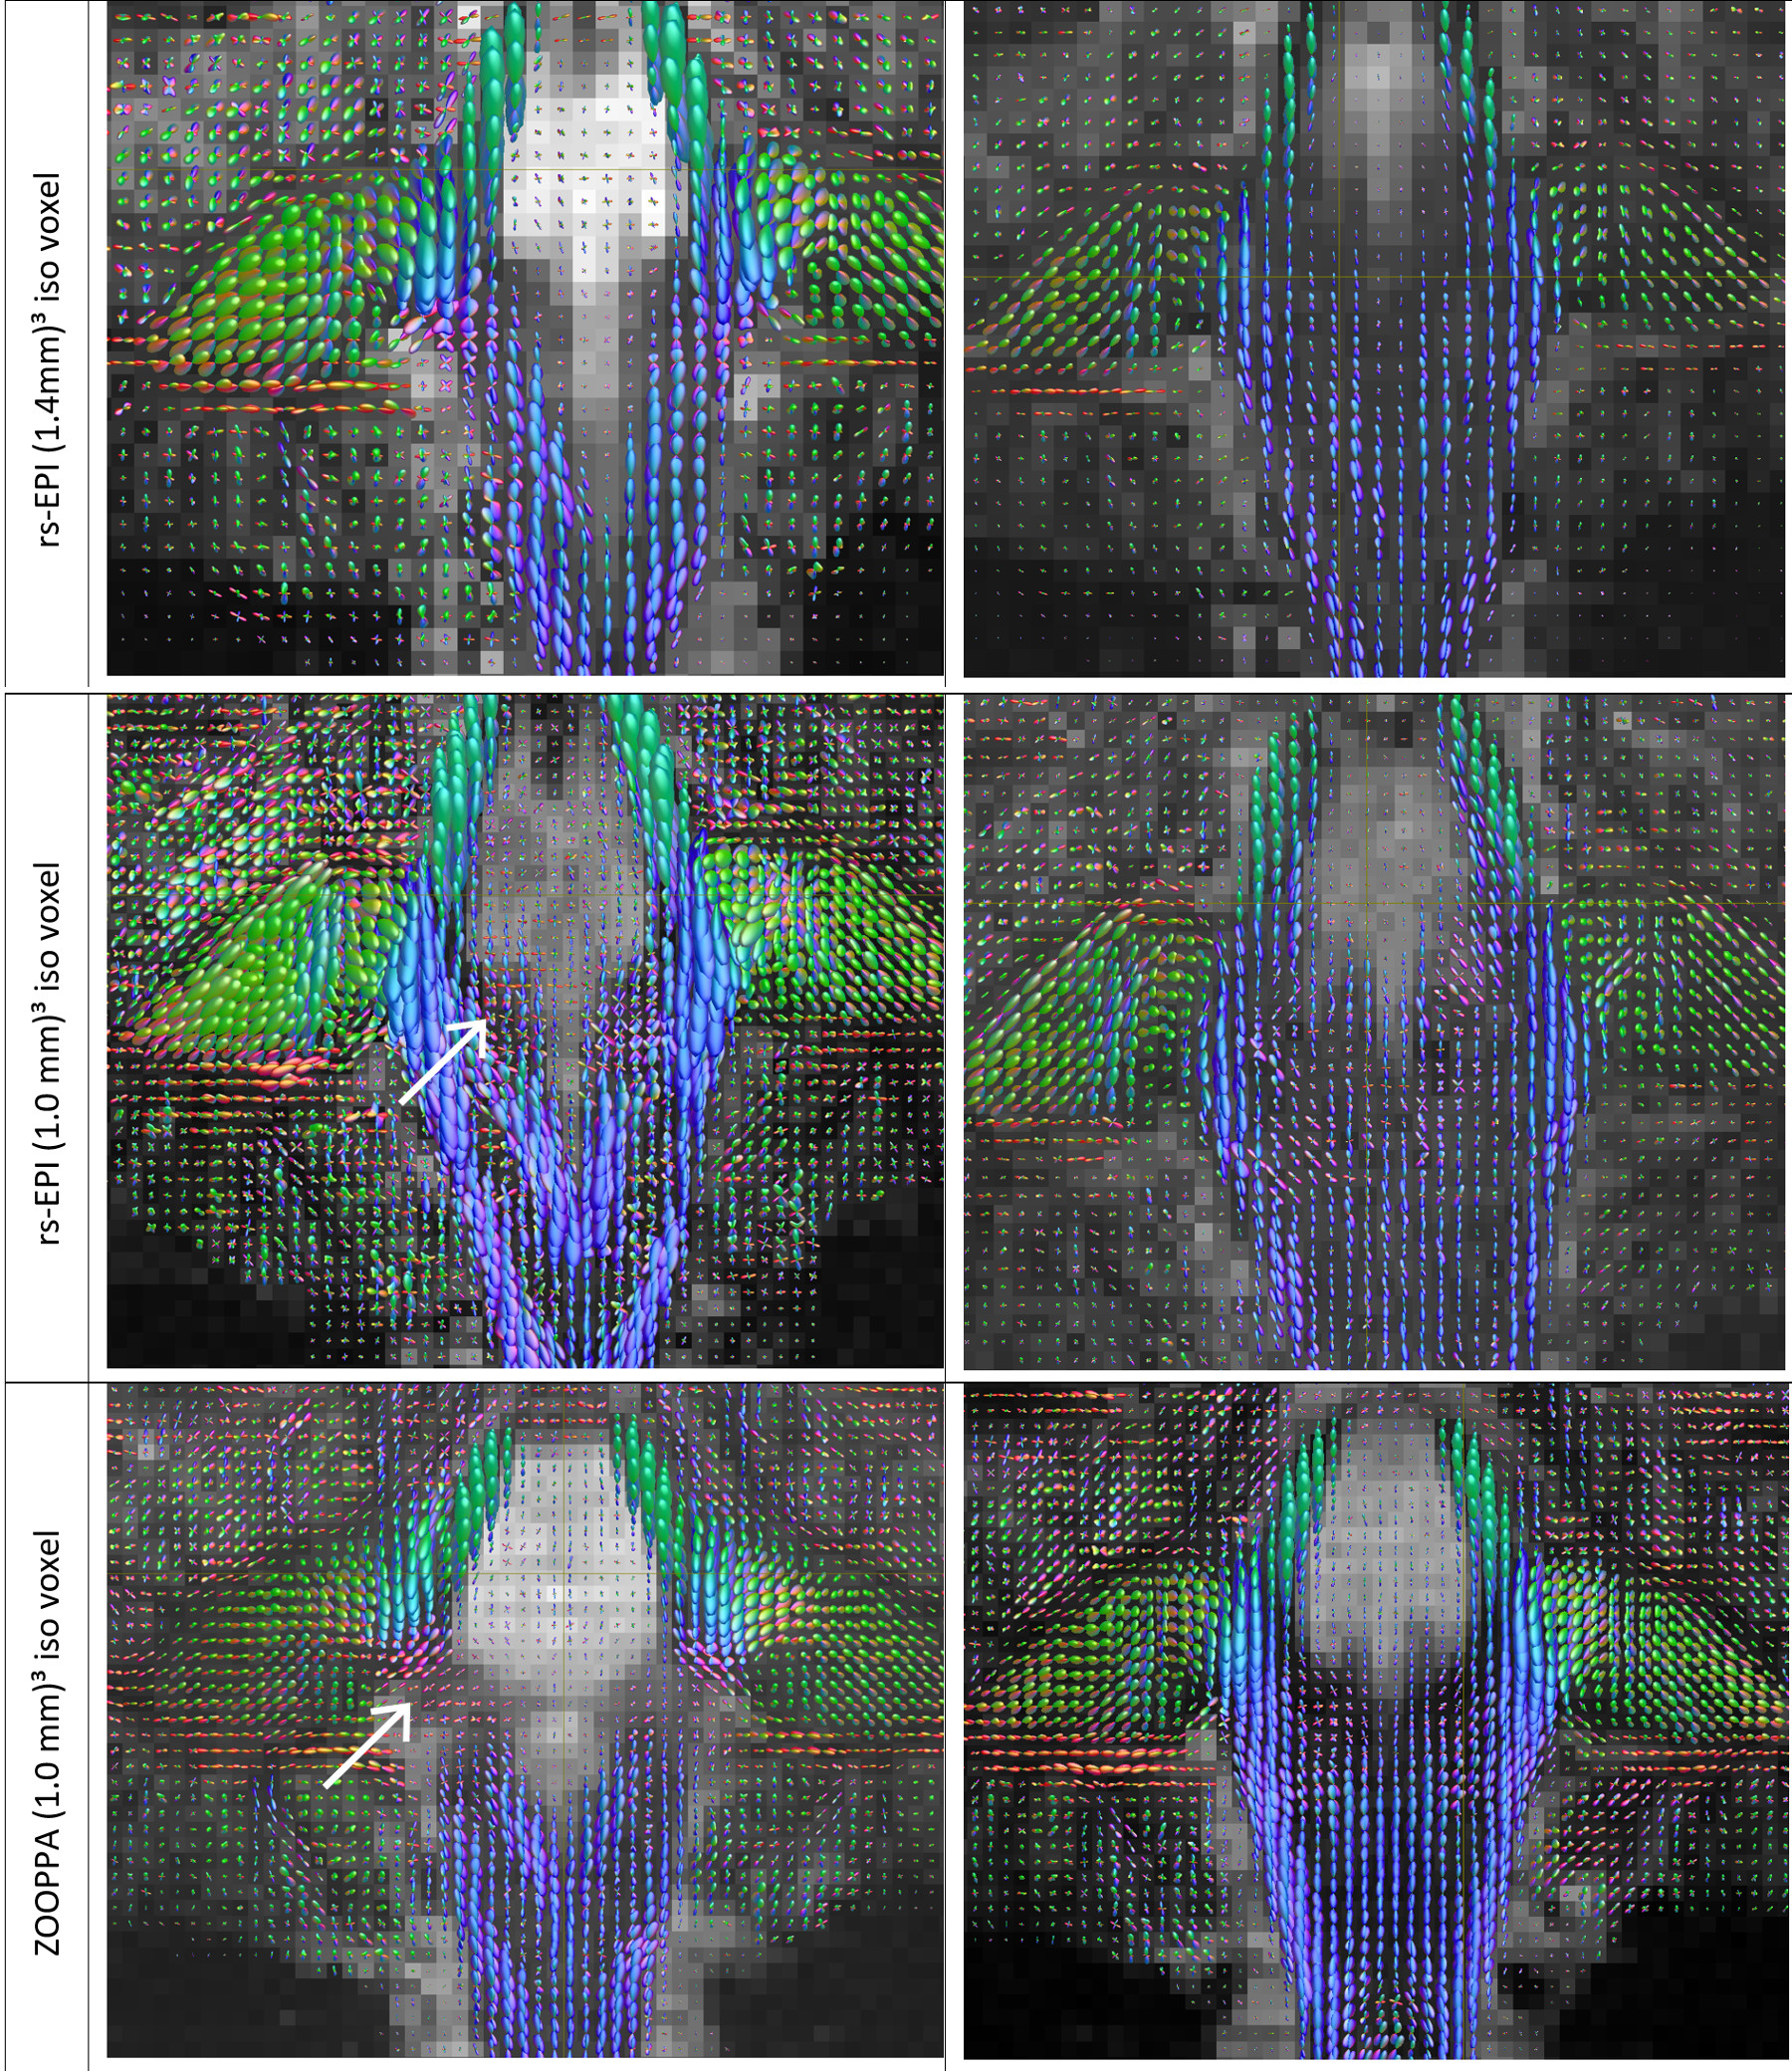
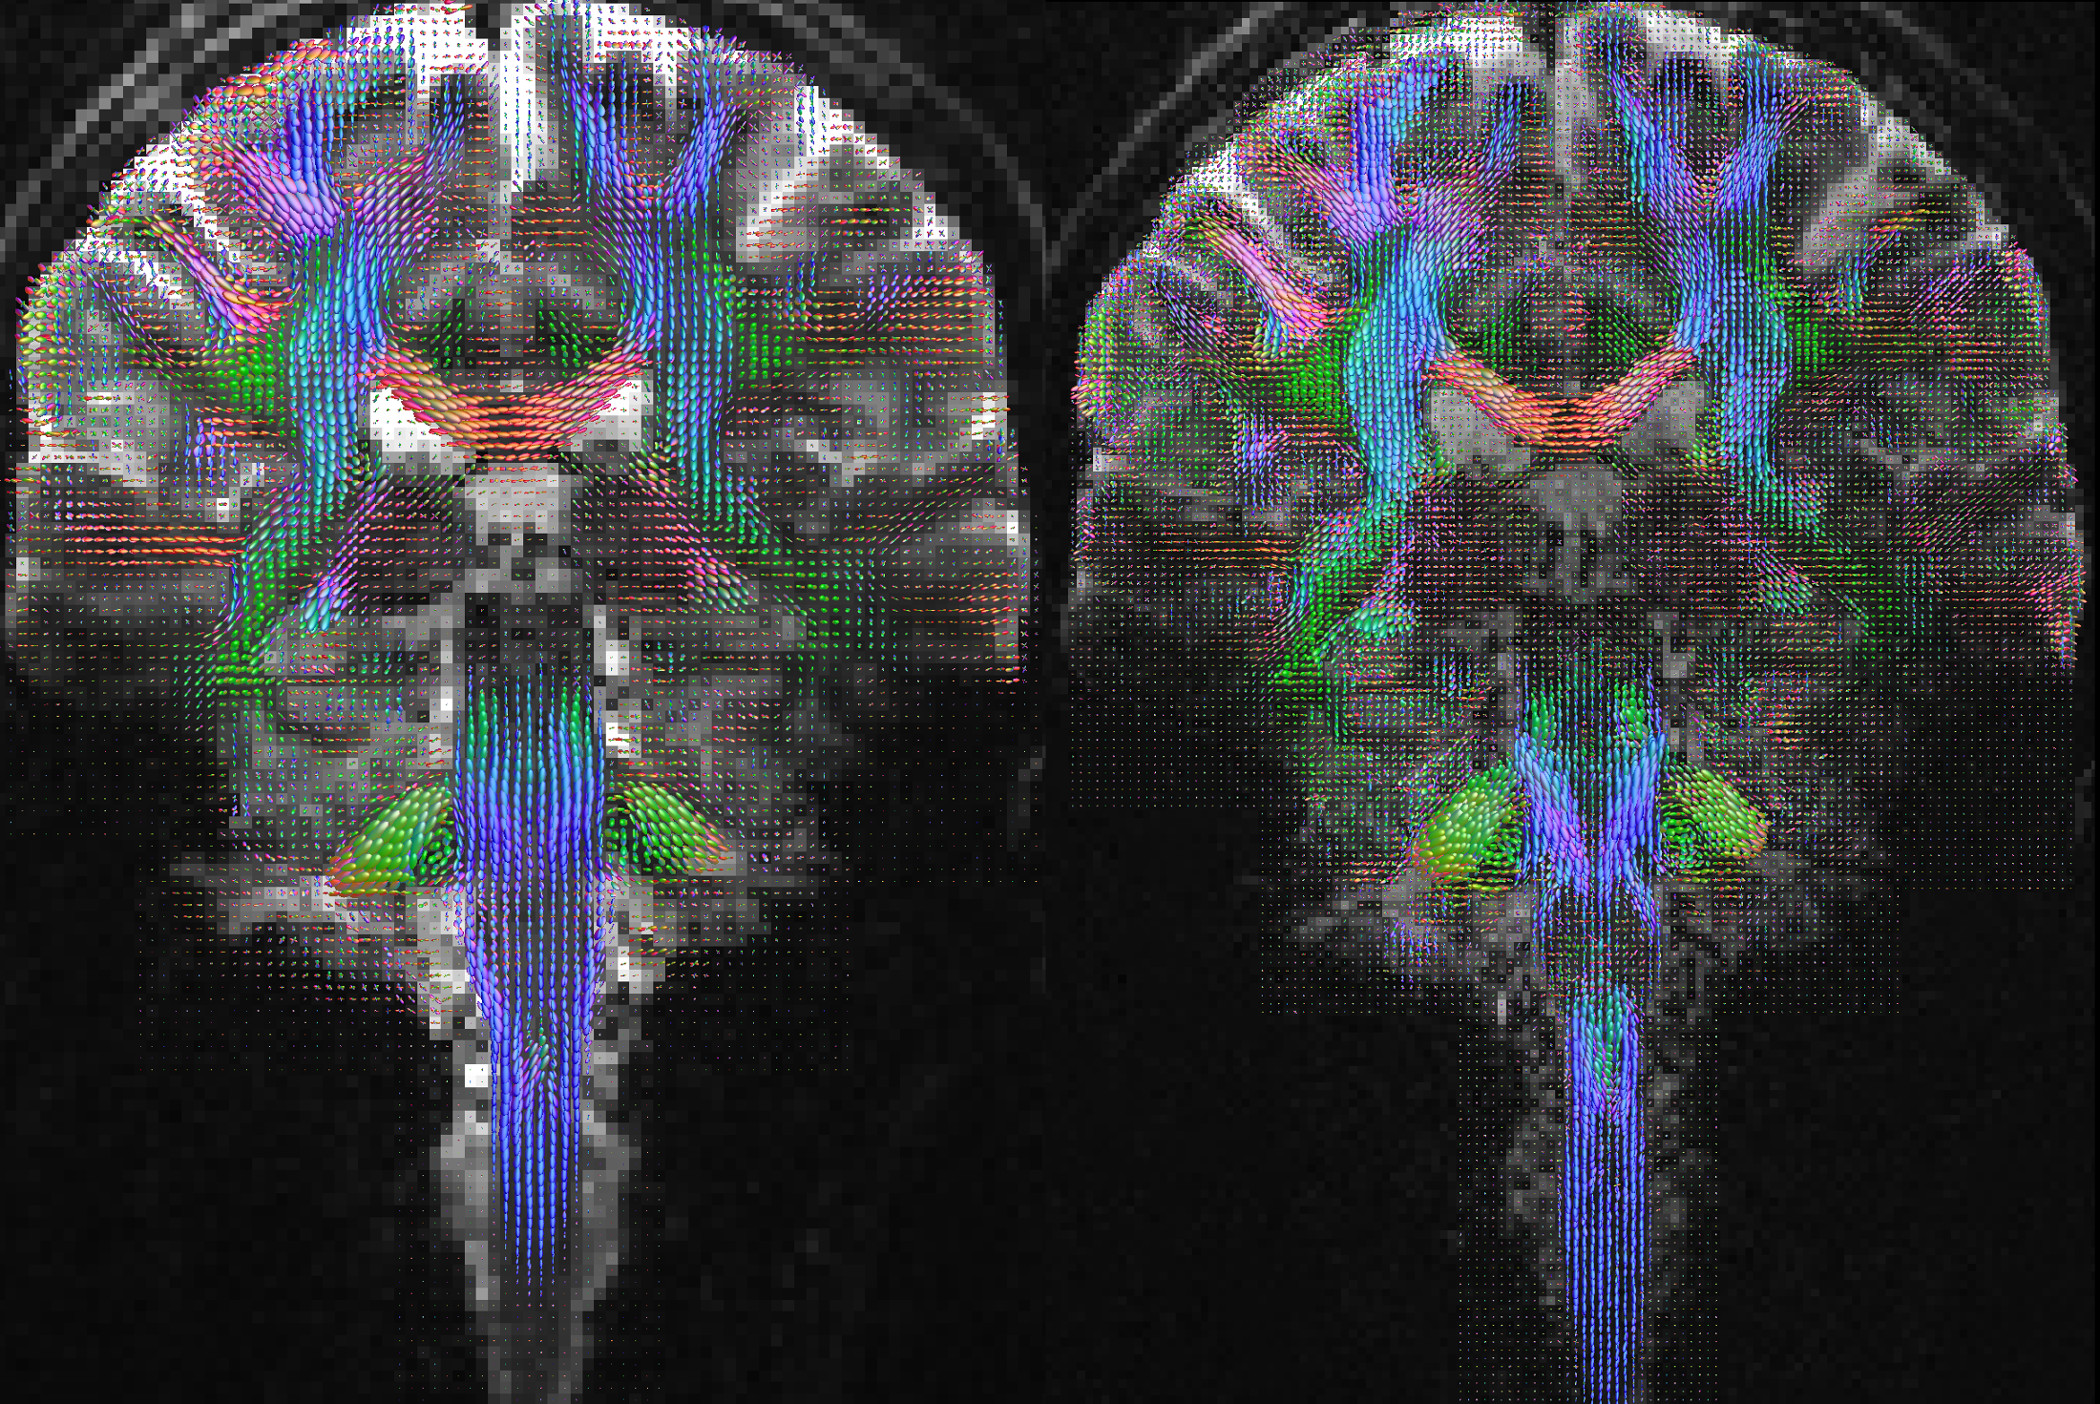
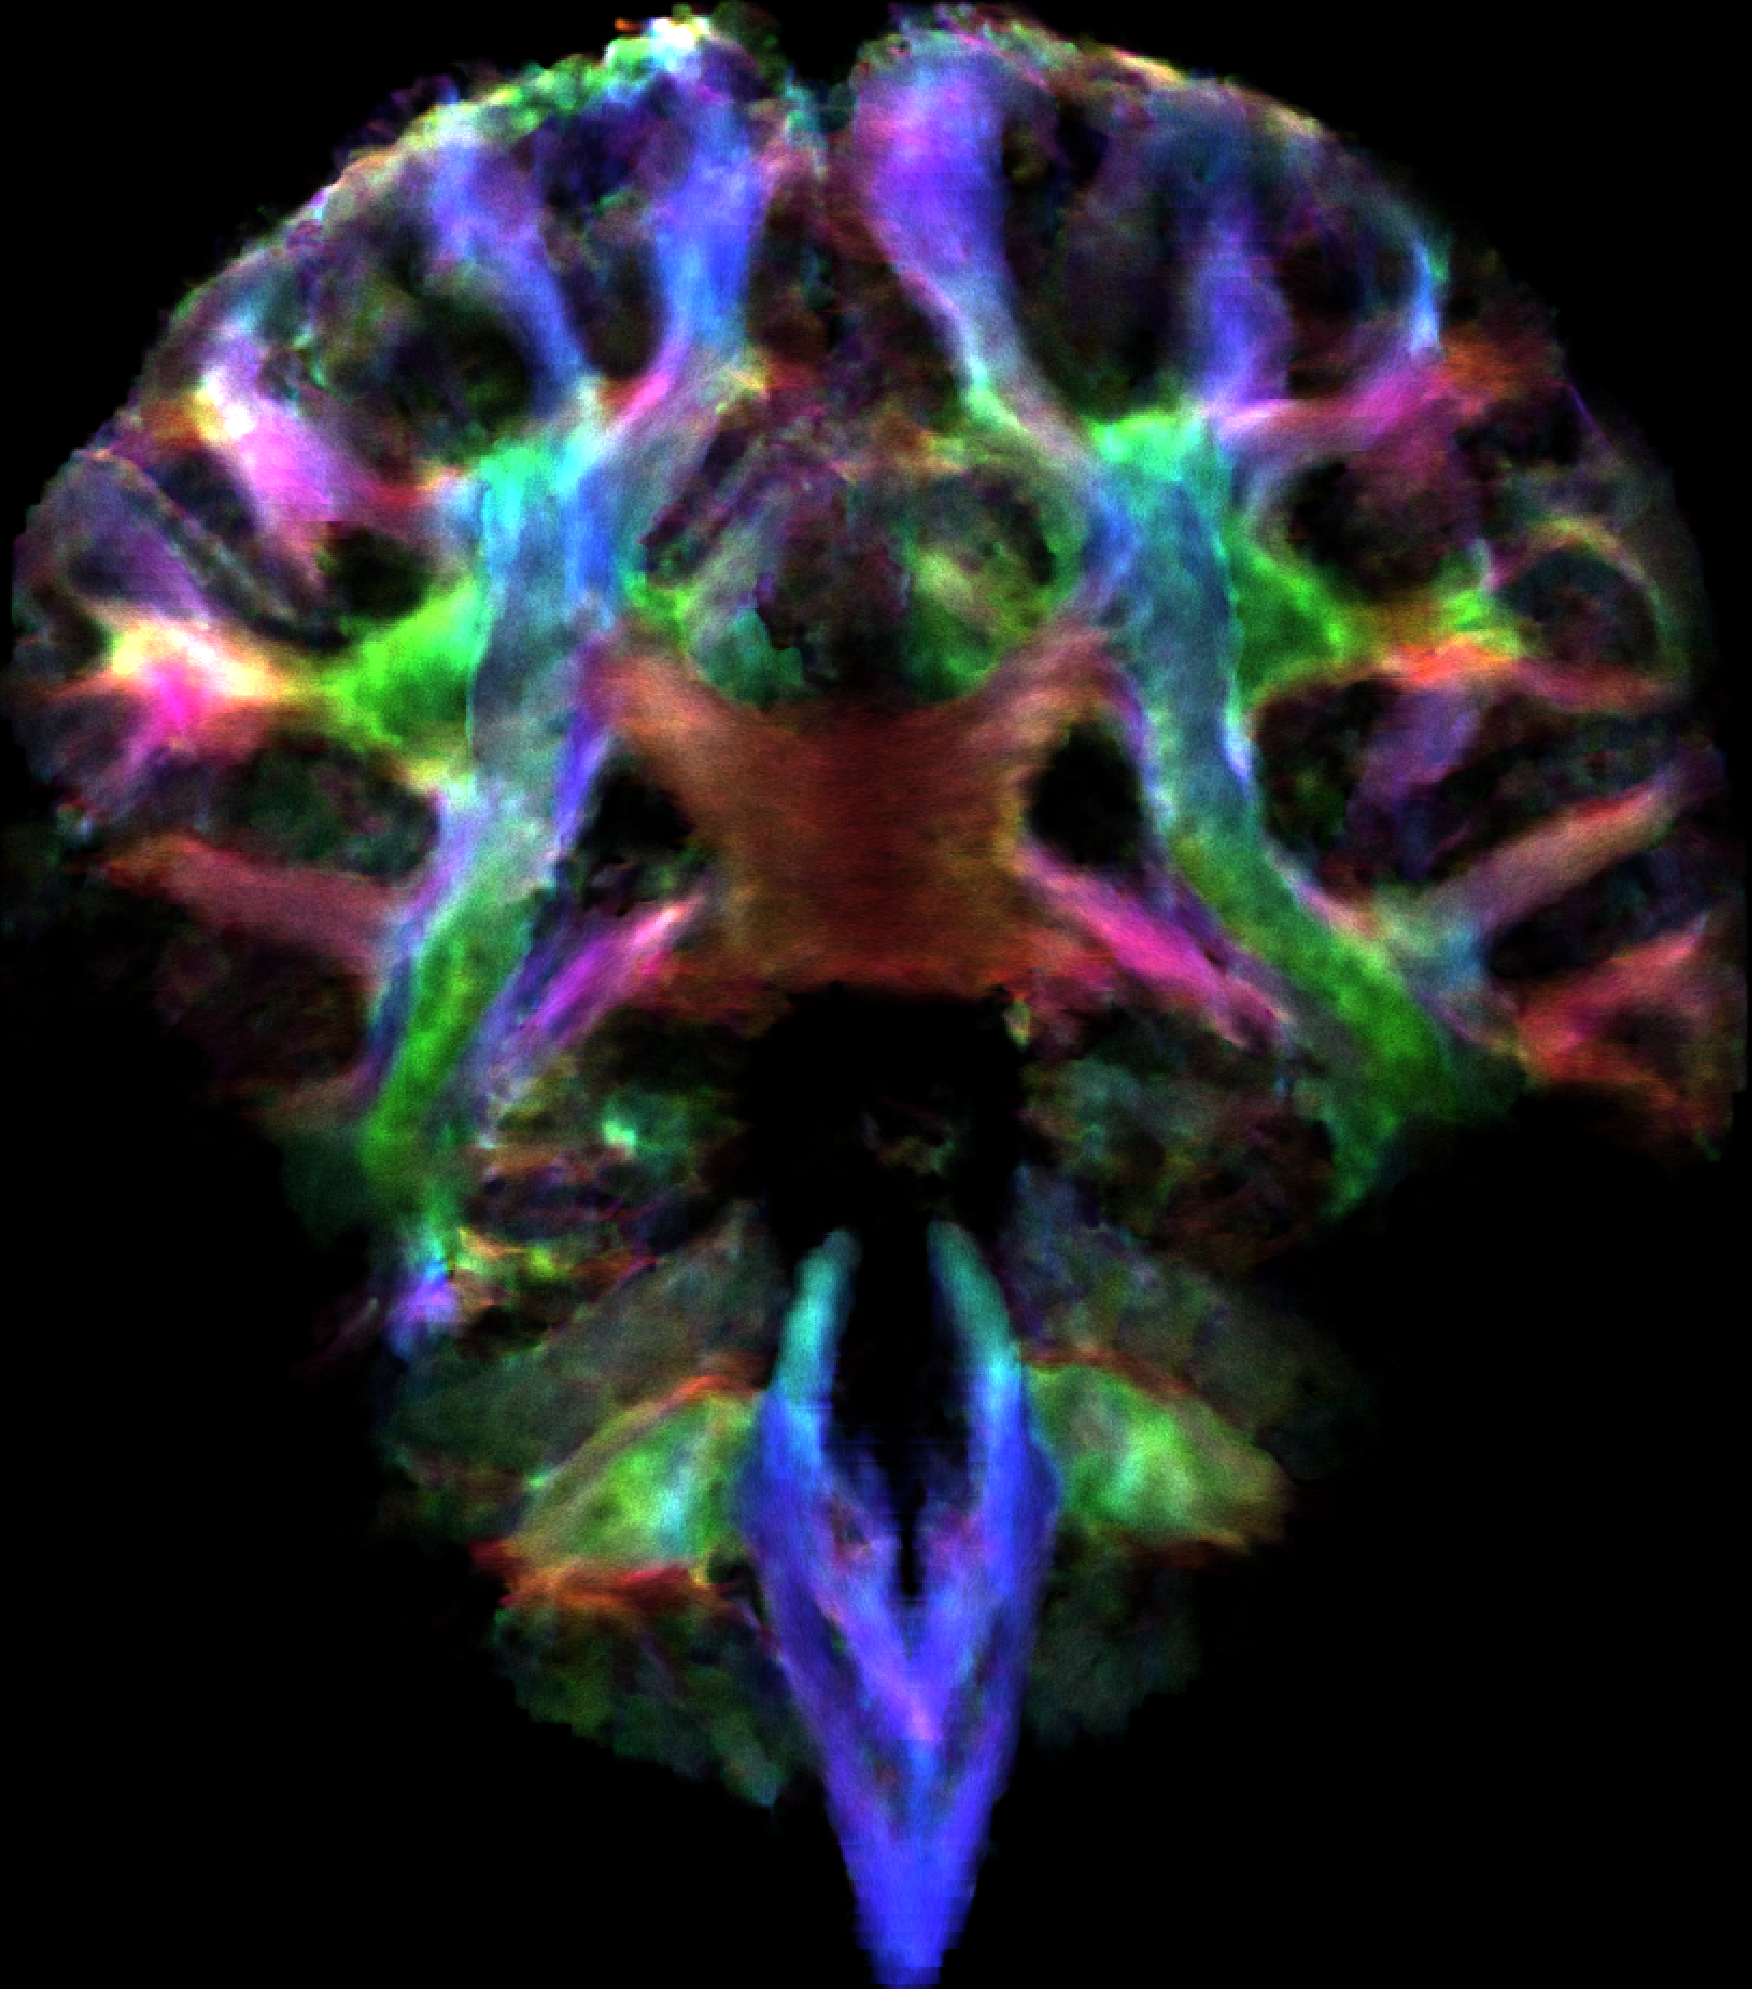
All three sequences allowed a reliable determination of the fiber orientation density(FOD) maps(fig.1). This is demonstrated on exemplary coronal slices along the pontine region where structures are complex and three-dimensionally interwoven. Each image exhibits fine details of the local fiber orientation density including crossing fibers in the medial part of the ponto-cerebellar transition zone. Little surprisingly, the ZOOPPA sequence seems to exhibit the most reliable FOD maps at 1mm isotropic resolution but at the price of the longest measurement time and a smaller VOI. The rs-EPI at (1.4mm)³ voxel-resolution allows also a good delineation of fiber orientations but compared to the 1mm isotropic resolution (rs-EPI and ZOOPPA) some details are missing, e.g. in the medial part of the ponto-cerebellar transition zone. The intermediate measurement time is due to the enlarged VOI (about double of that of the rs-EPI with 1mm isotropic resolution). However, the resolution still enables the determination of FODs not only in white matter but also in gray matter as seen in the large FOV coronal slices(fig.3). Even for a single-acquisition 1mm isotropic resolution the SNR was high enough to allow for super-resolved TD-images(fig.4).Conclusion
Currently, 7T MR scanners are planned to be used in clinical routine. This requires scan protocols being adapted for clinical needs, especially with regards of acquisition time. On the other hand, 7T can path the way for more sophisticated methods in diffusion MRI than a simple tensor approach for clinical use. Our results show that very high isotropic spatial resolution as well as a high angular resolution can be achieved within about 20min. This time can be reduced by a factor of 2-3 by employing simultaneous multi-slice imaging methods. The data quality allows resolving local fiber orientations and diffusion characteristics even in gray matter, which is of interest for early diagnosis of dementia. Furthermore, in multiple sclerosis, especially when localized in the spinal cord, changes in diffusion anisotropy in the so-called normal appearing white matter maybe diagnosed at an earlier time due to the increased resolution at 7T, allowing an earlier therapeutic intervention.Acknowledgements
No acknowledgement found.References
[1] R. Luetzkendorf, R. M. Heidemann, A. Anwander, J. Stadler, T. Feiweier and J. Bernarding; DWI at 7T with a High Performance Gradient System and a 32 Channel Head Coil: Resolution vs Time; OHBM 2012
[2]Heidemann RM, Anwander A, Feiweier T, Knösche TR, Turner R. “k-space and q-space: Combining ultra-high spatial and angular resolution in diffusion imaging using ZOOPPA at 7T”, NeuroImage, 60,967–978 (2012).
[3]Heidemann RM, Porter DA, Anwander A, Feiweier T, Heberlein K, Knösche TR, Turner R. Diffusion imaging in humans at 7T using readout-segmented EPI and GRAPPA. Magn Reson Med. 2010 Jul;64(1):9-14
[4]Stejskal, E. O. & Tanner, J. E., Spin Diffusion Measurements: Spin Echoes in the Presence of a Time Dependent Field Gradient. J. Chem. Phys. 42, 288 (1965)
[5]Morelli JN et al.(2010), Evaluation of a modified Stejskal-Tanner diffusion encoding scheme, permitting a marked reduction in TE, in diffusion-weighted imaging of stroke patients at 3 T. Invest Rad, 45, 29-35,
[6]Tournier et al., Robust determination of the fibre orientation distribution in diffusion MRI: non-negativity constrained super-resolved spherical deconvolution.NeuroImage 35, 2007, 1459-72
Figures