1847
Investigation of Diffusion Tensor Indices by ROI analysis and TBSS of Patients with Depressive Symptoms in the Elderly with Dementia1Department of Radiology, Taichung Veterans General Hospital, Taichung, Taiwan, Taichung, Taiwan, 2Department of Medical Imaging and Radiological Sciences, Chung Shan Medical University, Taichung, Taiwan, Taichung, Taiwan, 3Department of Biomedical Engineering, HungKuang University, Taichung, Taiwan, Taichung, Taiwan, 4College of Medicine, China Medical University, Taichung, Taiwan, Taichung, Taiwan
Synopsis
The differences of indices in diffusion tensor images (DTI) of patients with dementia are well-discussed in recent years. However, the comorbidity of dementia and depression was observed. In this study, we focused on the white matter changes associated with depressive symptoms in dementia and the relationship between DTI indices and cognitive functions in depressed and non-depressed patients. By an ROI-based analysis of the indices and TBSS analysis in DTI, we investigated the differences between patients of dementia with depression and without depression. Furthermore, we correlate the differences with the score of some clinical cognitive test to figure out the subtle differences.
Introduction
Recent studies suggested that the change of indices in diffusion tensor images (DTI) is common in Alzheimer’s disease (AD) (1, 2). Recently, a high prevalence of the comorbidity of dementia and depression was reported in the literatures. However, little is known about how these two different types of disease interfere with each other. This study aims to investigate white matter changes in patient of Alzheimer's disease without depressive symptoms (AD, Control) and those with depression (DAD, Case) using diffusion tensor imaging (DTI), as well as analyzed the clinical cognitive tests.Methods
This study included 26 patients with depression under Alzheimer’s disease and 20 sex and age-matched subjects with Alzheimer’s disease only. All participants completed the neuropsychological tests: Montreal Cognitive Assessment ( MoCA ) and Commission on Dietetic Registration ( CDR ). DTI data were acquired on a 1.5T Siemens MR system with following parameters: TR/TE=10000/107ms, b-value=1000 s/mm2, 30 directions, NEX=3 and voxel size=2*2*2mm3. Whole brain tracts of the FA and MD were carried out using FMRIB Software Library v5.0 (FSL) (4), Statistical Parametric Mapping (SPM) (5)and Tract-Based Spatial Statistics (TBSS)(6). White matter ROIs were created from Susumu Mori (7). The statistical analysis of the DTI indices of 68 ROIs were performed using a parametric permutation test and P<0.05 for significance. Subsequently, partial Pearson correlation analyses were performed to correlate the clinical evaluations with the regional DTI values within patient groups. TBSS pipeline was followed to show whole brain tract differences of both FA and MD in these two groups and P<0.05 for significance.Results
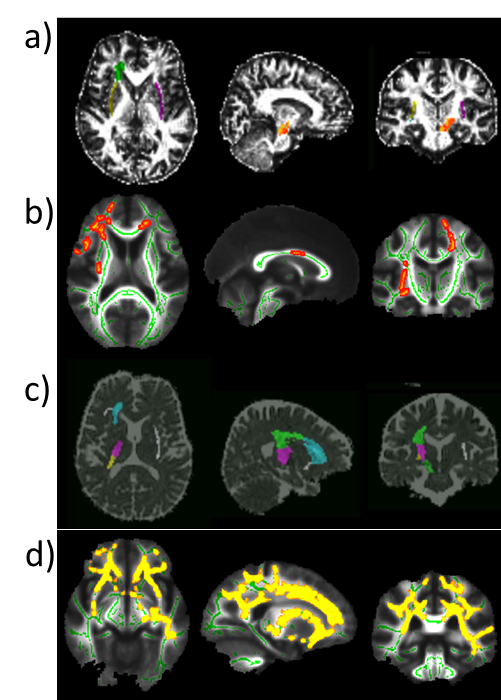
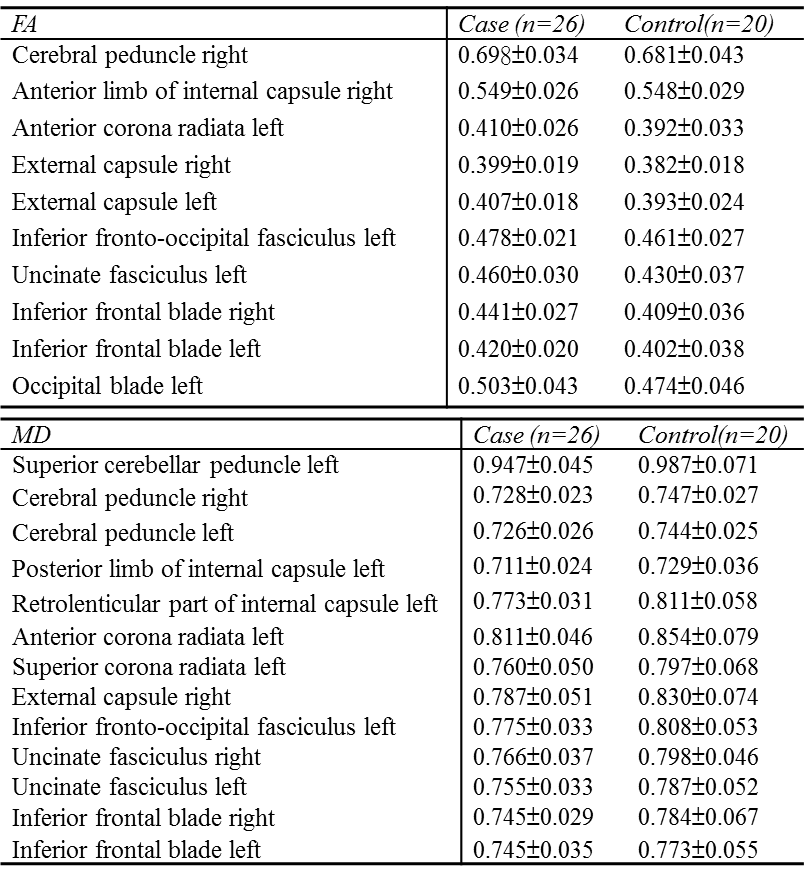
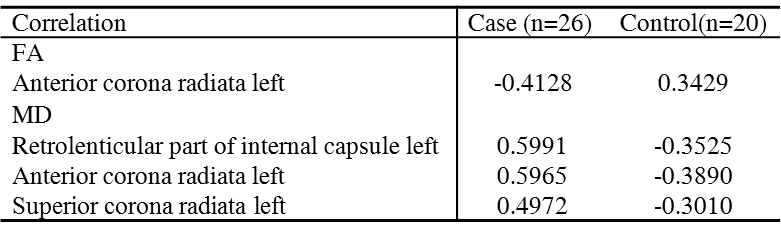
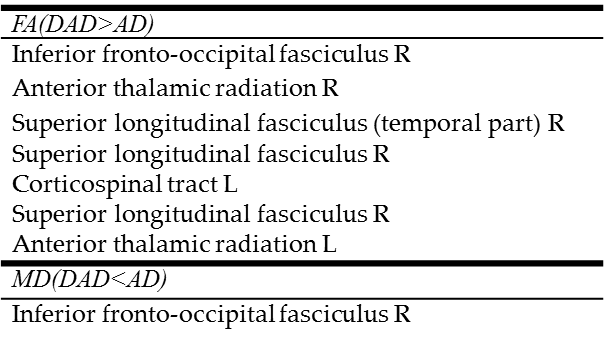
Demographic of case and control groups was showed in Table 1. In this study, the results showed that the FA of control group in some specified regions of interest (ROI) in white matter areas was significantly lower than case group. The values of MD showed higher in the control group than the case group (independent t- test, P<0.05). Table 2 and Table 3 showed the detail ROI areas with significantly different DTI indexes in two study groups. Figure 1 showed the areas with significantly different in FA and MD. The negative correlation showed between FA in left anterior corona radiata and the naming test in MoCA. The positive correlation observed between the naming test in MoCA and MD in left retrolenticular part of internal capsule, left anterior corona radiate and left superior corona radiate. (Table 4) Table 5 showed the tracts differences in these two groups.Conclusions
There were significant differences of white matter DTI indexes between both groups. The results are matched both in the ROI- based analysis and TBSS. Correlations between those white matter abnormalities and MoCA (Montreal Cognitive Assessment) and CDR (Commission on Dietetic Registration) supports white matter alteration may be involved in the psychopathology and pathophysiology of these two major co-morbidities in Alzheimer’s disease. Both FA and MD showed the differences in right cerebral peduncle, left Anterior corona radiate, right external capsule, left inferior fronto-occipital fasciculus, left uncinated fasciculus, right and left inferior frontal blade. The different lateralization existed in our results. It may relate to the handedness. In the correlation between FA values, MD values and the naming test in MoCA suggests that WM deficits in these regions may be a specific biomarker.Acknowledgements
No acknowledgement found.References
1. Zhang B et al. The role of diffusion tensor imaging in detecting microstructural changes in prodromal Alzheimer's disease. CNS Neurosci Ther. 2014 Jan;20(1):3-9
2. Oishi K et al. DTI analyses and clinical applications in Alzheimer's disease. J Alzheimers Dis. 2011;26(Suppl 3):287-96
3. Basser et al. MR diffusion tensor spectroscopy and imaging. Biophys. J.1994a;66:259–267.
4. Auning E et al. Neurobiological correlates of depressive symptoms in people with subjective and mild cognitive impairment. Acta Psychiatr Scand. 2015 Feb;131(2):139-47.
5. FMRI of the Brain Analysis Group, Oxford University, UK, 2000
6. S.M. Smith, et al. Tract-based spatial statistics: Voxelwise analysis of multi-subject diffusion data. NeuroImage, 2006;31:1487-1505
7. Susumu Mori et al. Stereotaxic white matter atlas based on diffusion tensor imaging in an ICBM template. Neuroimage. Apr 1, 2008; 40(2): 570–582
Figures