1841
High Resolution Cardiac DTI - Fiber Tractography Statistics of the ex Vivo pig Heart1Comprehensive Heart Failure Center, University Hospital Wuerzburg, Wuerzburg, Germany, 2Department of Diagnostic and Interventional Radiology, University Hospital of Wuerzburg, Wuerzburg, Germany, 3Department Tissue Engineering and Regenerative Medicine, University Hospital Wuerzburg, Wuerzburg, Germany, 4Translational Center Wuerzburg 'Regenerative therapies', Wuerzburg branch of the Fraunhofer IGB, Wuerzburg, Germany
Synopsis
A whole heart, high resolution diffusion tensor data set with 1.3 mm isotropic voxels was acquired in 15 ex vivo pig hearts using a Stejskal-Tanner sequence at 3T. ADC, FA and HA values were calculated and analyzed for the whole heart. Purpose was to create a reliable statistical reference of diffusion parameters. Sharp modes for median and interquartile range of the ADC and median and mean values of the helix angle indicate similar distributions of those values for the individual hearts. This provides a statistically compelling reference for future cardiac DTI pig studies in vivo and at higher field strengths.
Introduction
Diffusion MRI provides information on the structural and functional integrity of tissue. Measuring directional parameters and fiber tracking requires both high spatial resolution and SNR, which is difficult to provide simultaneously at 1.5T and even 3T. Going to higher field strengths has shown to provide improved diffusion imaging quality in neurological DTI. However higher field strengths also lead to increased B0 inhomogeneity and therefore signal loss, distortions in the EPI readout, and reduced available diffusion encoding time. We have recently shown that B0 inhomogeneity leads to essential bias in diffusion parameters measured with a stimulated echo sequence. Purpose of this study was to create a reliable statistical reference of diffusion parameters of the ex vivo pig heart based on diffusion images with high 3D spatial resolution and isotropic voxels for validation of future measurements in vivo and at ultra high field strengths.Methods
All measurements were performed on a 3T whole-body scanner (Siemens MAGNETOM Prisma, Erlangen, Germany) with a four channel head coil. Fifteen ex vivo pig hearts were placed in a 0.9% sodium chloride solution and imaged within 10 hours after excision. A Stejskal-Tanner preparation was used to cover the whole organ with an isotropic resolution of 1.3x1.3x1.3mm3. Further measurement parameters were TE: 55ms, TR: 15000ms (65 slices without gaps), matrix size: 84x128, FOV: 170mm2 and 5/8 partial-Fourier acceleration. A set of 30 diffusion directions after Skare1 and 5 b0 images were acquired in a total scan time of 9:00 minutes. All post processing was done using DSI studio2 and MATLAB (MathWorks, Natick, USA). All hearts were segmented according to the American Heart Association (AHA) model3 defining the apical cap by papillary muscle rather than left ventricular lumen. Manual segmentation of the myocardium was done using directional information of the main eigenvector of diffusion (e1). ADC, FA and helix angle4 (HA) values were analyzed for all slices and the 17 segments of all hearts.Results
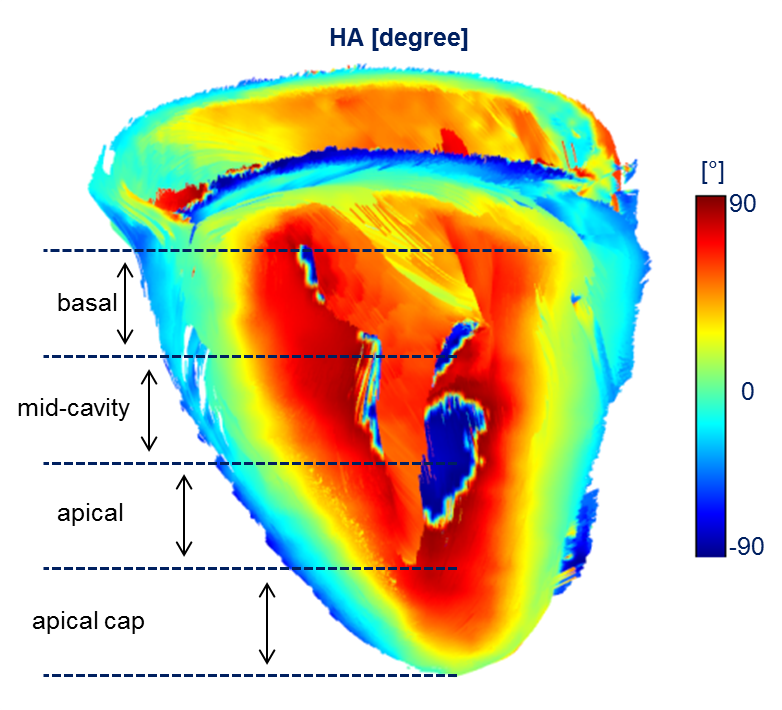
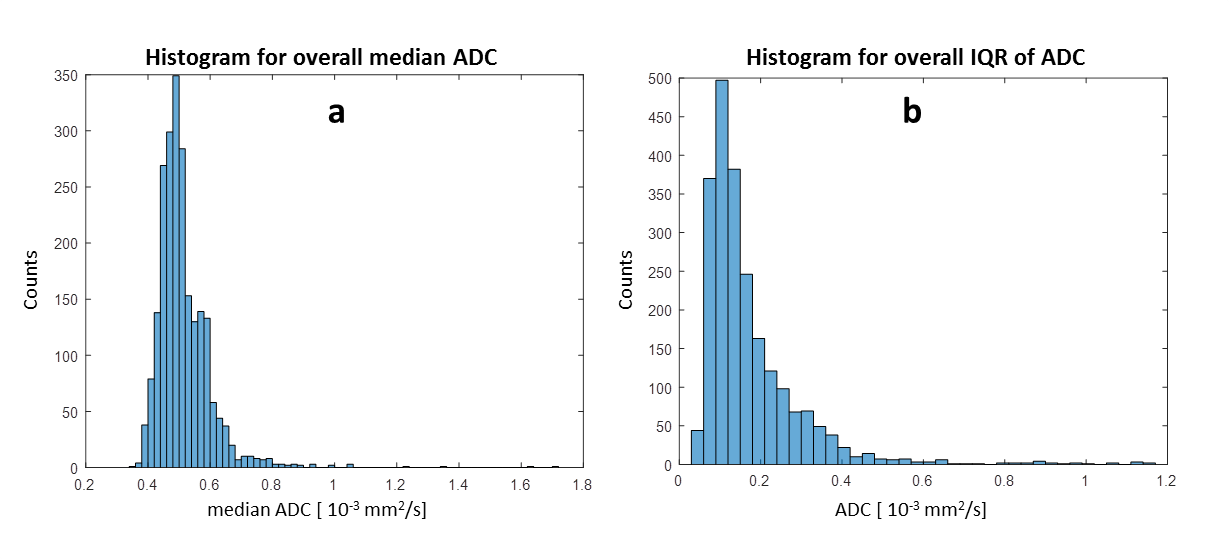
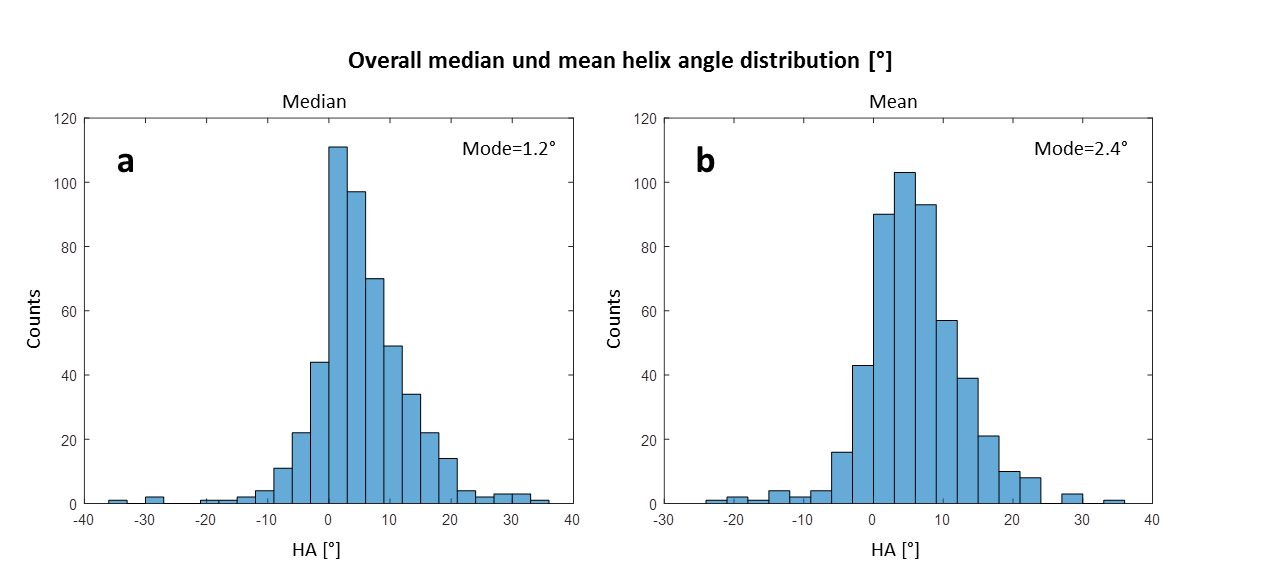
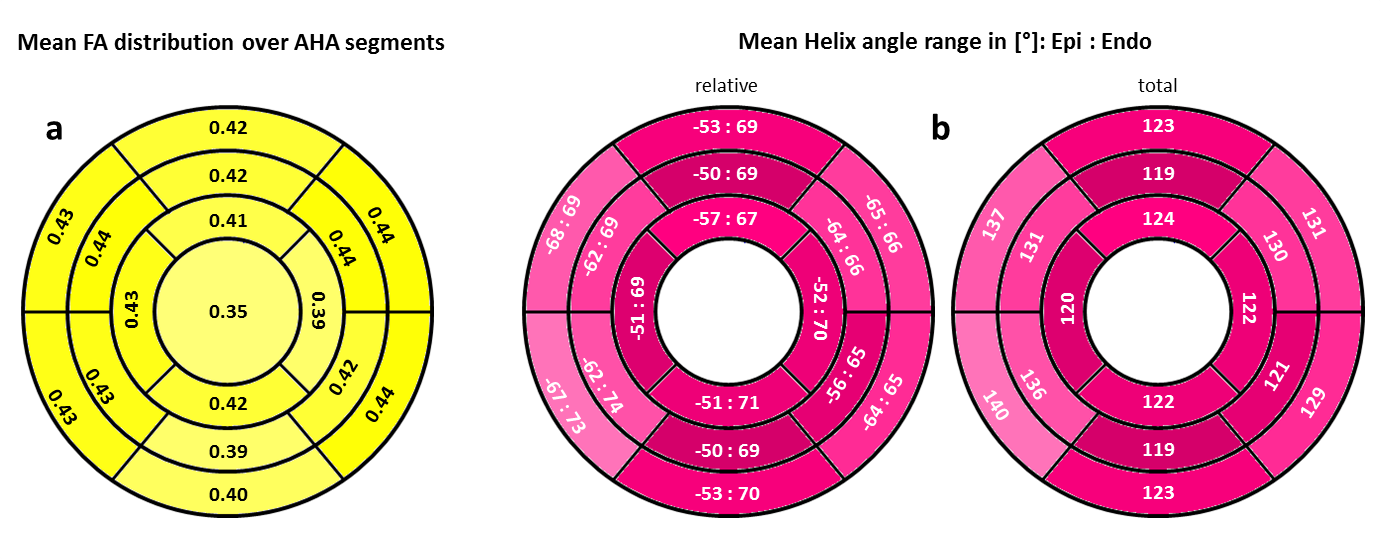
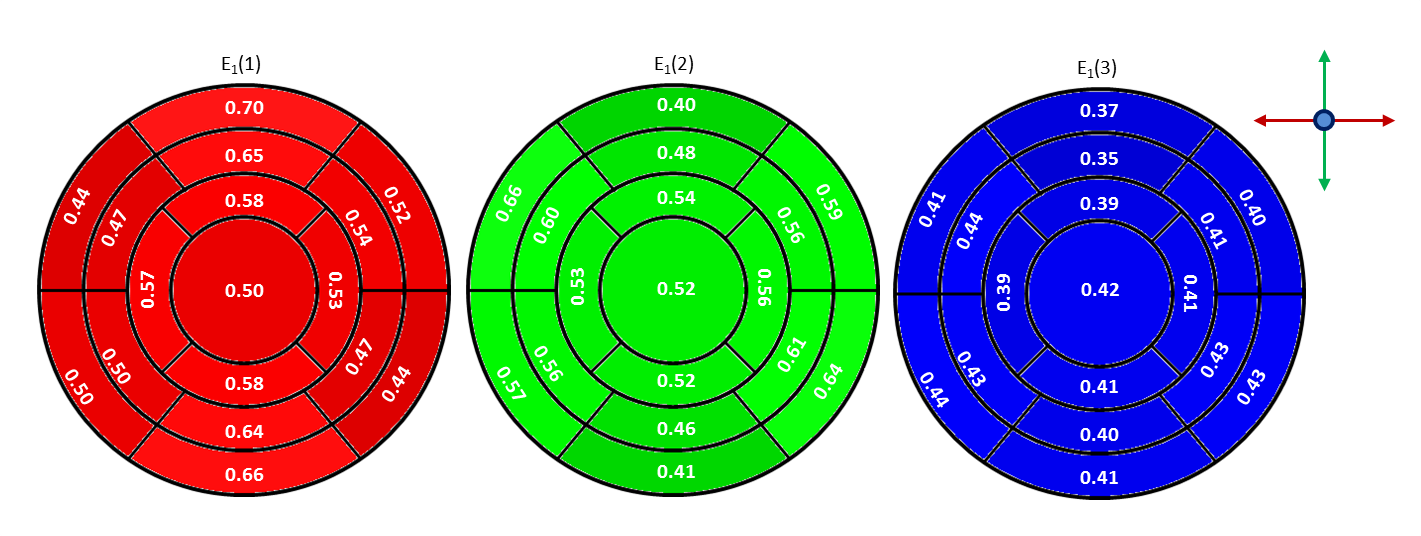
Figure 1 shows an example of the HA distribution mapped to the shown fibers reconstructed by tractography. On average 7±2 slices of apical cap, 9±1 apical, 9±1 mid-cavity, and 9±1 basal slices were analyzed for each heart. Figure 2 shows the distribution of the median (2a) and interquartile range (IQR) (2b) of ADC values for the left ventricle of all 15 hearts. The highest count for the median ADC value was found at 0.5x10⁻³ mm2/s. The IQR histogram has a sharp mode at 0.1x10⁻³ mm2/s. Histograms for the median and mean HA distributions over the left ventricle of all hearts (Figure 3) also display sharp modes with a difference of 1% for a helix angle range of 120°. Figure 4 shows mean FA values (4a) and the mean HA range from epicardium to endocardium (4b) of all hearts mapped to the 17 segments of the AHA model. HA values span a range of about 120° to 140°. The mean FA value varies only slightly (~0.05) between apical and basal segments. In Figure 5 the components of the main eigenvector of diffusion (e1) are shown for each of the 17 segments. A negative correlation between the contributions of e1(1) and e1(2) to the fiber direction was observed. The overall directional contribution of e1(1) and e1(2) is larger than the one of e1(3).Discussion
Sharp modes for median and IQR of the ADC value indicate a similar distribution of those for the individual hearts and allows the generation of a stable statistical reference. The same applies to median and mean values of the helix angle. Values of about 120°-140° and a mean span of 128° over all segments for the helix angle is in agreement with the value of 120° found in literature5. The slight skew in the direction of positive values could be a result of the manual segmentation. The negative correlation of e1(1) and e1(2) values and therefore the variation of fiber orientation for different segments corresponds to the morphology of the left ventricle. Lower values for e1(3) are expected, since papillary muscles were excluded in the segmentation and fiber orientation in the mid-myocardium is circumferential.Conclusion
Conventional spatial resolution used for in vivo measurements5 at 3T ranges from 2x2x4 mm3 to 2.7x.2.7x8 mm3. With spatial resolution of 1.3x1.3x1.3 mm3 the analyzed data set has significantly higher resolution of both the helix angle and diffusion tensor parameters. This should provide a statistically sound reference for cardiac DTI measurements in vivo at 3T and both ex vivo and in vivo at higher field strengths such as 7T, where higher SNR allows for significantly increased spatial resolution.Acknowledgements
We acknowledge financial support of German Ministry of Education and Research (BMBF, grants: 01EO1004, 01E1O1504).References
1. Skare S, Hedehus M, Moseley M E, Li T-Q. Condition Number as a Measure of Noise Performance of Diffusion Tensor Data Acquisition Schemes with MRI. Journal of Magnetic Resonance. 2000; 147(2): p. 340-352.
2. Yeh F-C. DSI-Studio. http://dsi-studio.labsolver.org. Accessed June 22, 2016.
3. Cerqueira M D , Weissman N J, Dilsizian V, et al. Standardized Myocardial Segmentation and Nomenclature for Tomographic Imaging of the Heart. A Statement for Healthcare Professionals From the Cardiac Imaging Committee of the Council on Clinical Cardiology of the American Heart Association. 2002; 105(4): p. 539-542.
4. Mekkaoui C, Huang S, Chen H H, et al. Fiber architecture in remodeled myocardium revealed with a quantitative diffusion CMR tractography framework and histological validation. J Cardiovasc Magn Reson. 2012; 14(1).
5. Mekkaoui C, Reese T G, Jackowski M P, Bhat H, Sosnovik D E. Diffusion MRI in the heart. NMR in Biomedicine. 2015
Figures