1833
Comparaison of in vivo and ex vivo high resolution imaging of the mouse brain at 11.7T1Center of NeuroImaging Research - CENIR, Paris, France, 2Inserm U 1127, CNRS UMR 7225, Sorbonne Universités, UPMC Univ Paris 06 UMR S 1127, Institut du Cerveau et de la Moelle épinière, ICM, Paris, France, 3Behavior, Emotion and Basal Ganglia (BEBG), Brain and Spine Institute, Paris, France
Synopsis
This study compares high resolution in vivo and ex vivo diffusion imaging of mouse brain at 11.7T. The study shows that even with the advancement in image sequences and equipment, ex vivo imaging remains superior to in vivo imaging in terms of resolution with clear delineation of brain structures. However, fractional anisotropy values obtained from ex vivo imaging may not be a true representation of the in vivo condition. Nonetheless, the resolution obtained from in vivo imaging should allow for longitudinal studies.
Purpose
Diffusion MRI techniques were used occasionally when they were first introduced. However, the recent years has seen an exponential rise in their use. This is evident in the hundreds of publications per year that has used diffusion MRI and tractography techniques to probe several diseases, localize white matter tracts for surgical procedure, and detect stroke at an early stage1. This technique is not only limited to clinical studies but has also been applied widely to pre-clinical studies involving wild-type and transgenic mice. Unlike in clinical imaging, small animal imaging lacks robust atlases that could help in delineating brain structures especially in the in vivo brain. That is because most of the available atlases were created from diffusion images acquired from the postmortem brain. Ex vivo brains undergo microstructure changes due to the fixation process and may not be a true representation of the in vivo microstructure2. In order to generate atlases from in vivo imaging and to allow for longitudinal studies, there is need for sequences that could reduce the scan time while improving the resolution.This study compares high resolution in vivo diffusion imaging with an optimized ex vivo sequence to evaluate their differences.Methods
Brain images were acquired on an 11.7 T MRI system (Bruker Biospec 117/16 USR, 750 mT/m gradients, PV6.0.1) using a CryoprobeTM. Imaging was performed on a 8-week old PLP-gfp mouse. In vivo imaging was performed with a 3D segmented EPI sequence in 60 directions at b value of 1,500 s/mm2 for 1 hr 20 mins (100 µm isotropic, FOV = 1.92 x 1.28 x 0.8 cm3, TR/TE = 300/20.24 ms). 6 A0 directions were also acquired. The ex vivo mouse brain was perfused with 4% PFA. The brain was then placed in a mixture of 4% PFA and gadolinium 48 hrs before imaging. 3D diffusion-weighted spin echo sequence was used for the ex vivo diffusion imaging with a b value of 10,000 s/mm2 (100 µm isotropic, FOV = 1.7 x 1.4 x 9.6 cm3, TR/TE = 250/25 ms) and a total scan time of 86 hrs 10 mins.
Data analysis involved preprocessing to correct for eddy currents using fsl (http://fsl.fmrib.ox.ac.uk/fsl/). Fsl dtifit was used to generate the FA maps. Estimation of the fiber orientation distribution (FOD) was achieved with MrTrix using the constrained spherical deconvolution algorithm3. Whole-brain probabilistic tractography was performed (10000 tracts, step size = 0.1 mm, angle = 45o, minimum tract length = 6 mm, FOD amplitude cutoff = 0.6). The generated whole brain tractogram was then filtered to have streamlines match the FOD lobe integrals in order to have biologically relevant tractogram4. We compared the in vivo and ex vivo FA maps. We also compared the FA values and FOD in the corpus callosum since this is the region that is clearly visible on both acquisitions.
Results
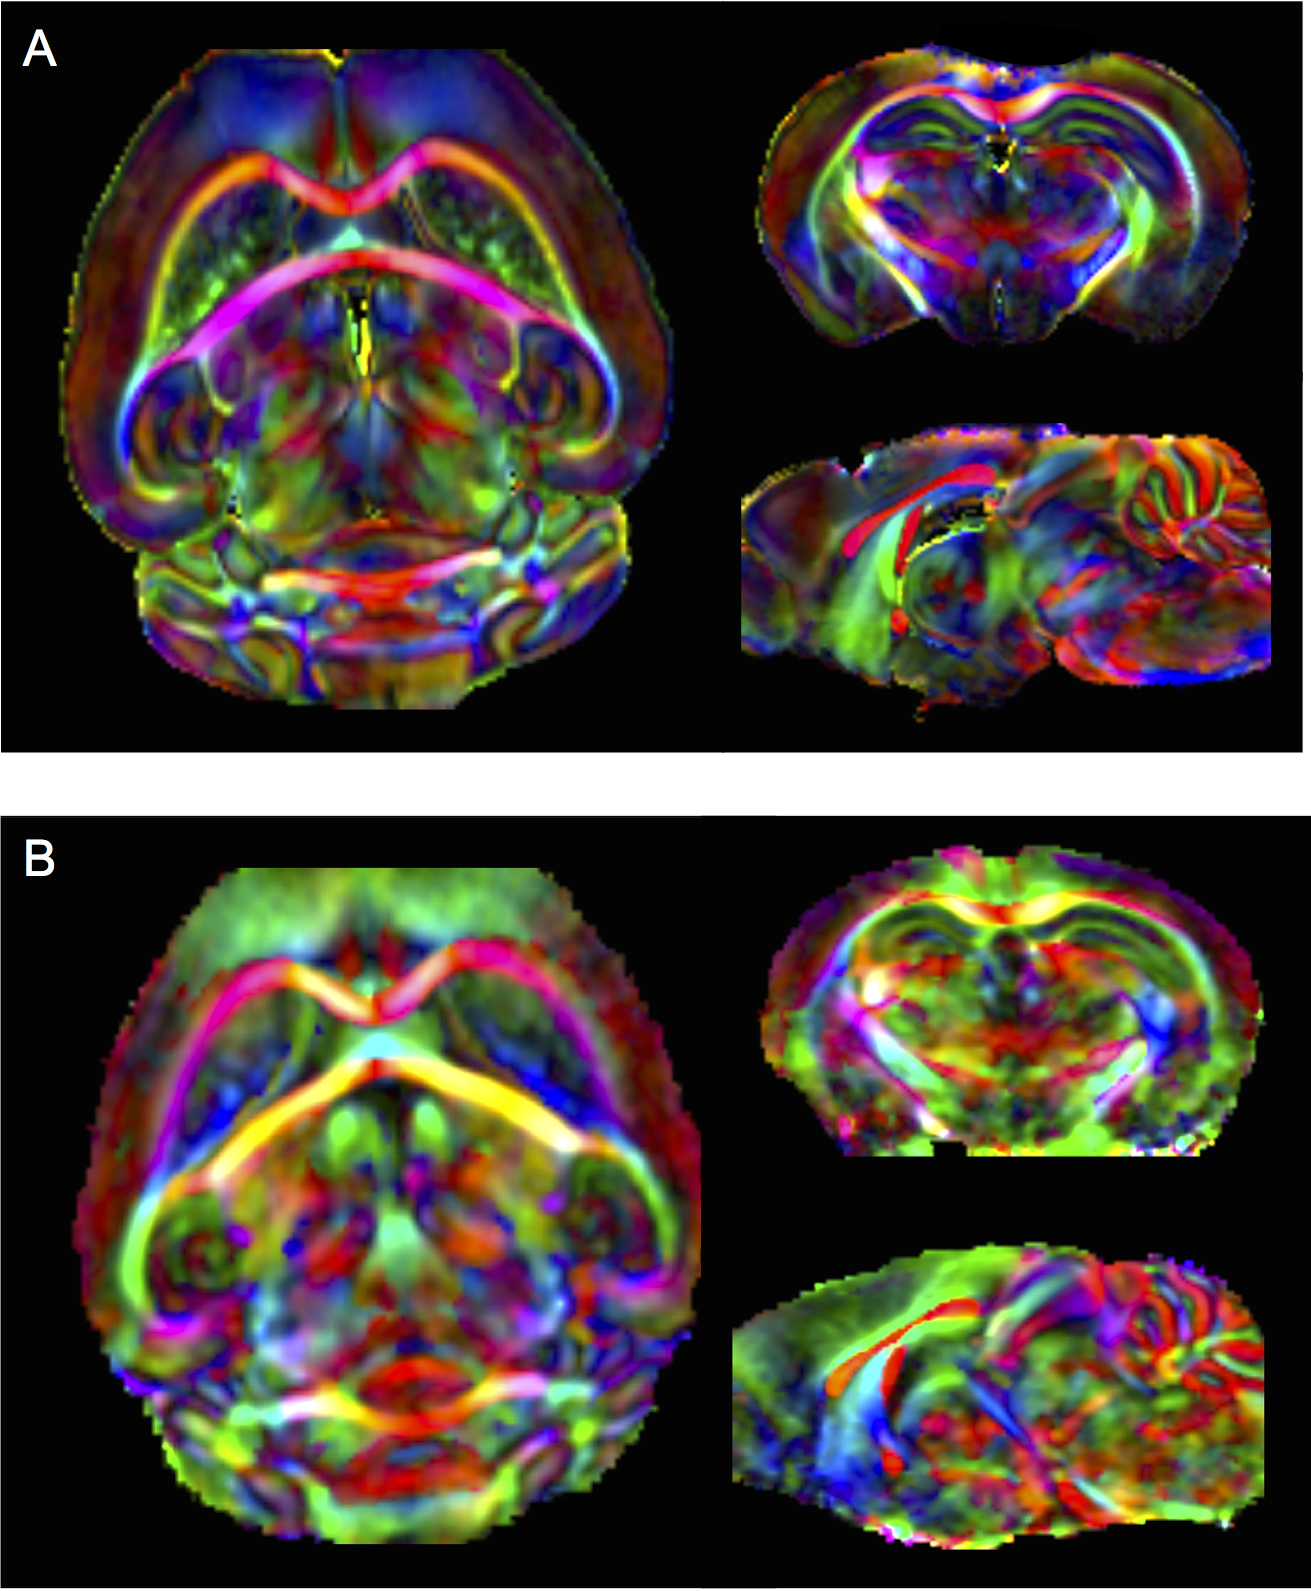
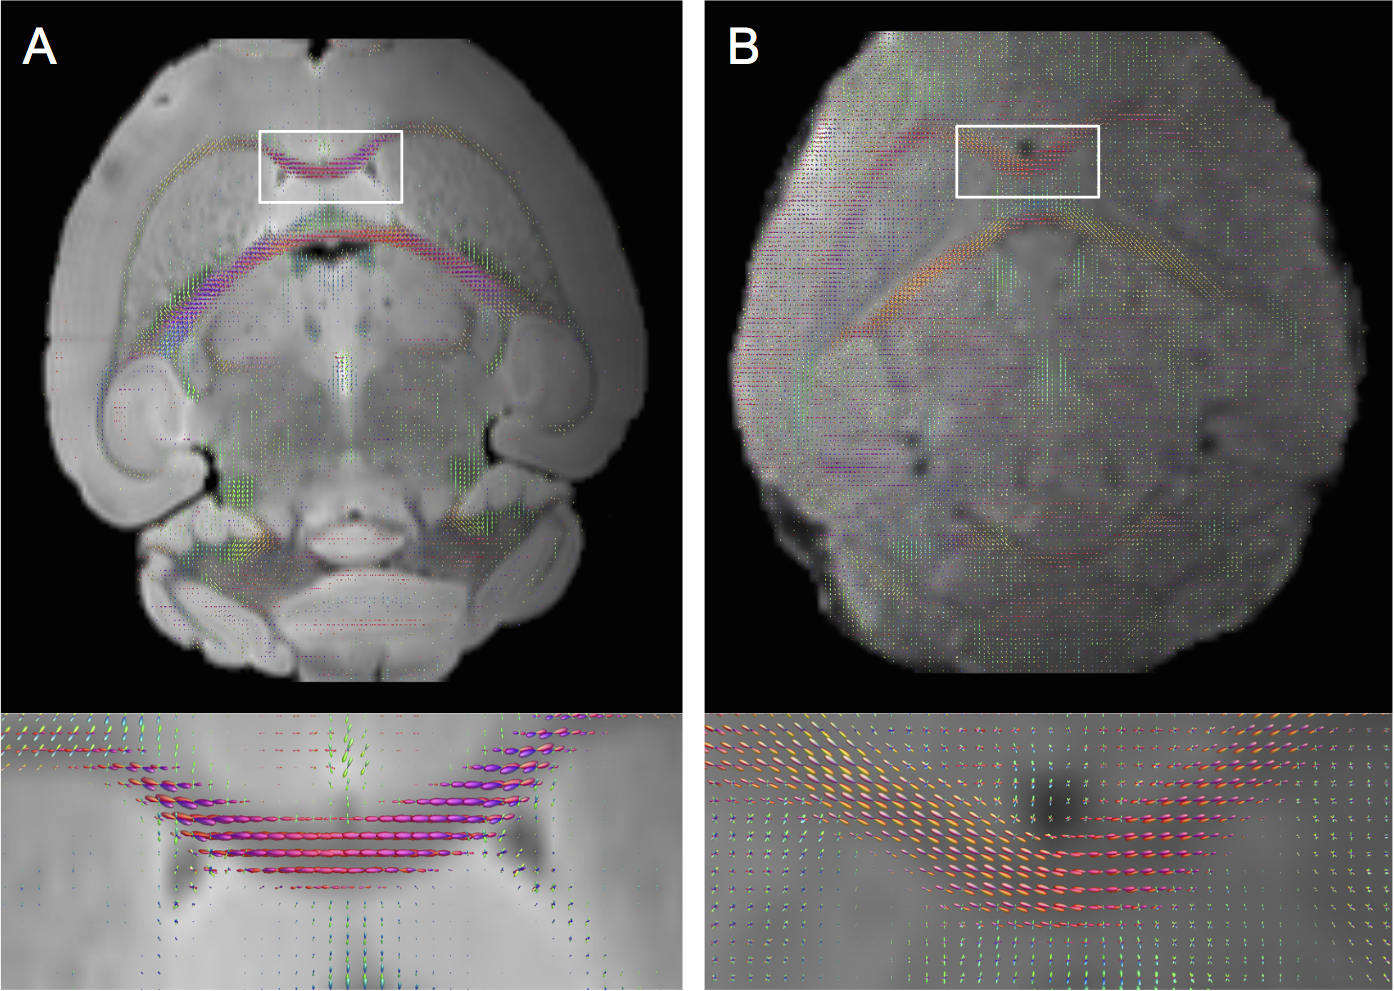
Ex vivo diffusion image shows clear delineation of white matter fibers compared to the in vivo image (Fig. 1). Visual inspection of the images does not seem to show significant differences in the size of brain structures. However, FA measurements in in the corpus callosum showed a 15% increased FA in vivo compared to ex vivo. This variation is clearly explained by the differences in the FOD. Compared to ex vivo data, the in vivo data was very noisy and the lack of clear structural delineation resulted in poor FOD estimation (Fig. 2).Conclusion
This study shows that even at high fields, in vivo imaging is not able to obtain the same resolution as ex vivo imaging due to the limitation in scan time and contrast agents. The resolution obtained from in vivo imaging is however enough to allow for longitudinal studies. There is still the need for sequences that could overcome this limitation and allow for improved in vivo imaging.Acknowledgements
The research leading to these results received funding from the programs 'Institut des neurosciences translationnelle' ANR-10-IAIHU-06, 'Infrastructure d’avenir en Biologie Santé' ANR-11-INBS-0006 and from the Brain Booster Challenge program at the Brain and Spine Institute.
SBS has been supported by the Bettencourt Schueller Foundation and by the National Agency for Research under the program "Investissements d’avenir" ANR-10-EQPX-15.
References
1. Horsfield MA, Jones DK. Applications of diffusion-weighted and diffusion tensor MRI to white matter diseases - a review. NMR Biomed 2002;15:570-577.
2. Zhang J, Jones MV, McMahon MT, et al. In vivo and ex vivo diffusion tensor imaging of cuprizone induced demyelination in the mouse corpus callosum. Magn Reson Med 2012;67(3):750-759.
3. Dhollander T, Raffelt D, Connelly A. Unsupervised 3-tissue response function estimation from single-shell or multi-shell diffusion MR data without a co-registered T1 image. ISMRM Workshop on Breaking the Barriers of Diffusion MRI, 2016, 5.
4. Smith RE, Tournier JD, Calamante E, Connelly A. SIFT: Spherical-deconvolution informed filtering of tractograms. NeuroImage 2013;67:298-312.
Figures