1832
High-resolution diffusion imaging of post-mortem monkey brain: comparison of 3D Spin Echo and 3D segmented EPI sequence at 11.7T1Center of NeuroImaging Research - CENIR, Paris, France, 2Inserm U 1127, CNRS UMR 7225, Sorbonne Universités, UPMC Univ Paris 06 UMR S 1127, Institut du Cerveau et de la Moelle épinière, ICM, Paris, France, 3AP-HP, Hôpital de la Pitié-Salpêtrière, Department of Neurosurgery, Paris, France, 4AP-HP, Hôpital de la Pitié-Salpêtrière, Department of Neurology, Paris, France
Synopsis
Diffusion-weighted spin echo (SE) acquisition is the golden-standard of diffusion imaging, yet it is limited by a very long acquisition time. This work present the optimization of a 3D segmented Echo Planar Imaging (EPI) sequence with the goal of reducing acquisition time and be able to perform tractography and to promote further analysis such as microstructure or histology correlation.
Purpose
Diffusion imaging of post-mortem brain become challenging when combining techniques is desired such as MRI with histology. Indeed, the gold standard technique namely diffusion-weighted spin echo acquisition require long acquisition time which is not suitable for tissue preservation. The goal of combining techniques is to confirm, precise and get greater details of the structures observed such as fibers tracts or microstructure for example. This get more and more of interest in the field. Thus the purpose of this work was to propose an alternative acquisition technique for diffusion imaging of post-mortem brain, allowing tractography and enabling combination with histology technique.Methods
Experiments were performed on a perfusion fixed macaque brain using a 11.7T Biospec 117/16 (Bruker Biospin, Germany) running Paravision 6.0.1 and equipped with a 72-mm transceiver. A 1:200 gadolinium MR contrast agent was added to the buffer 48 hours before imaging. Ex-vivo diffusion imaging was performed with a 3D SE and 3D segmented EPI sequences. 3D segmented EPI parameters were: 64 diffusion-weighted directions at b = 10 000 s/mm², 1 b = 0 volume, voxel size 0.2x0.2x0.2 mm3, matrix 384x288x256, TR/TE = 250/26.6 ms, acquisition time 73H21 and 32 segments. 3D SE parameters were: 64 diffusion-weighted directions at b = 10 000 s/mm², 1 b = 0 volume, voxel size 0.2x0.2x0.2 mm3, matrix 384x288x256, TR/TE = 250/25 ms, acquisition time 224 hours with a partial Fourier of 2/3.
Data were processed with MrTrix and we estimated the distribution of fiber orientations (FOD) present within each imaging voxel using the Constrained Spherical Deconvolution framework1. Probabilistic whole brain tractography was run with the following parameters: 100 000 tracks, step length of 0.1 mm, curvature threshold of 45°, minimum tract length of 6 mm, maximum tract length of 250 mm and fiber orientation distribution amplitude cut-off of 0.06. The spherical-deconvolution informed filtering of tractograms was applied to reduce the number of streamlines to 5 million to provide a biologically meaningful estimate of structural connection density by removing false positive tracts2. The tracts of interest in the resulting whole brain tractogram were isolated with manually defined regions of interest.
Results
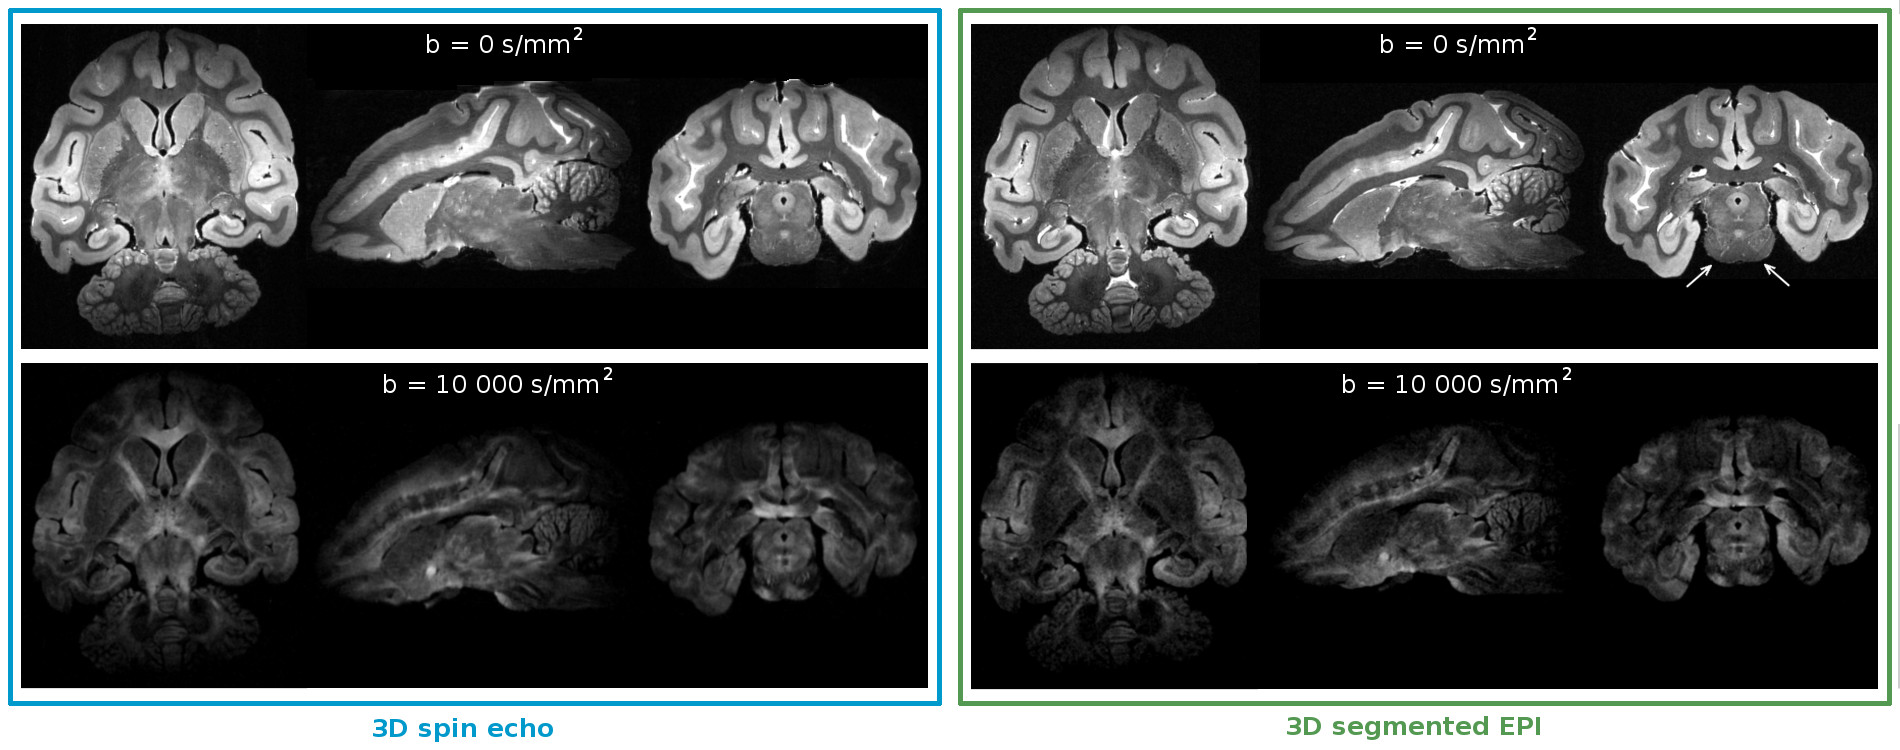
Our first comparison of high-resolution diffusion imaging using 3D SE and 3D segmented EPI is the observation of the signal efficiency and the quality of the signal at b = 0 but also high b-value, e.g b = 10 000 s/mm² in our study (Fig. 1). The noise on the images obtained with the segmented EPI sequence is higher than the one obtained with the 3D SE sequence (mean standard deviation in the background across all the directions of 14.55 for the segmented EPI versus a mean of 0 for the SE). We can also notice a minimal deformation (white arrow) of the brain with the 3D segmented EPI.
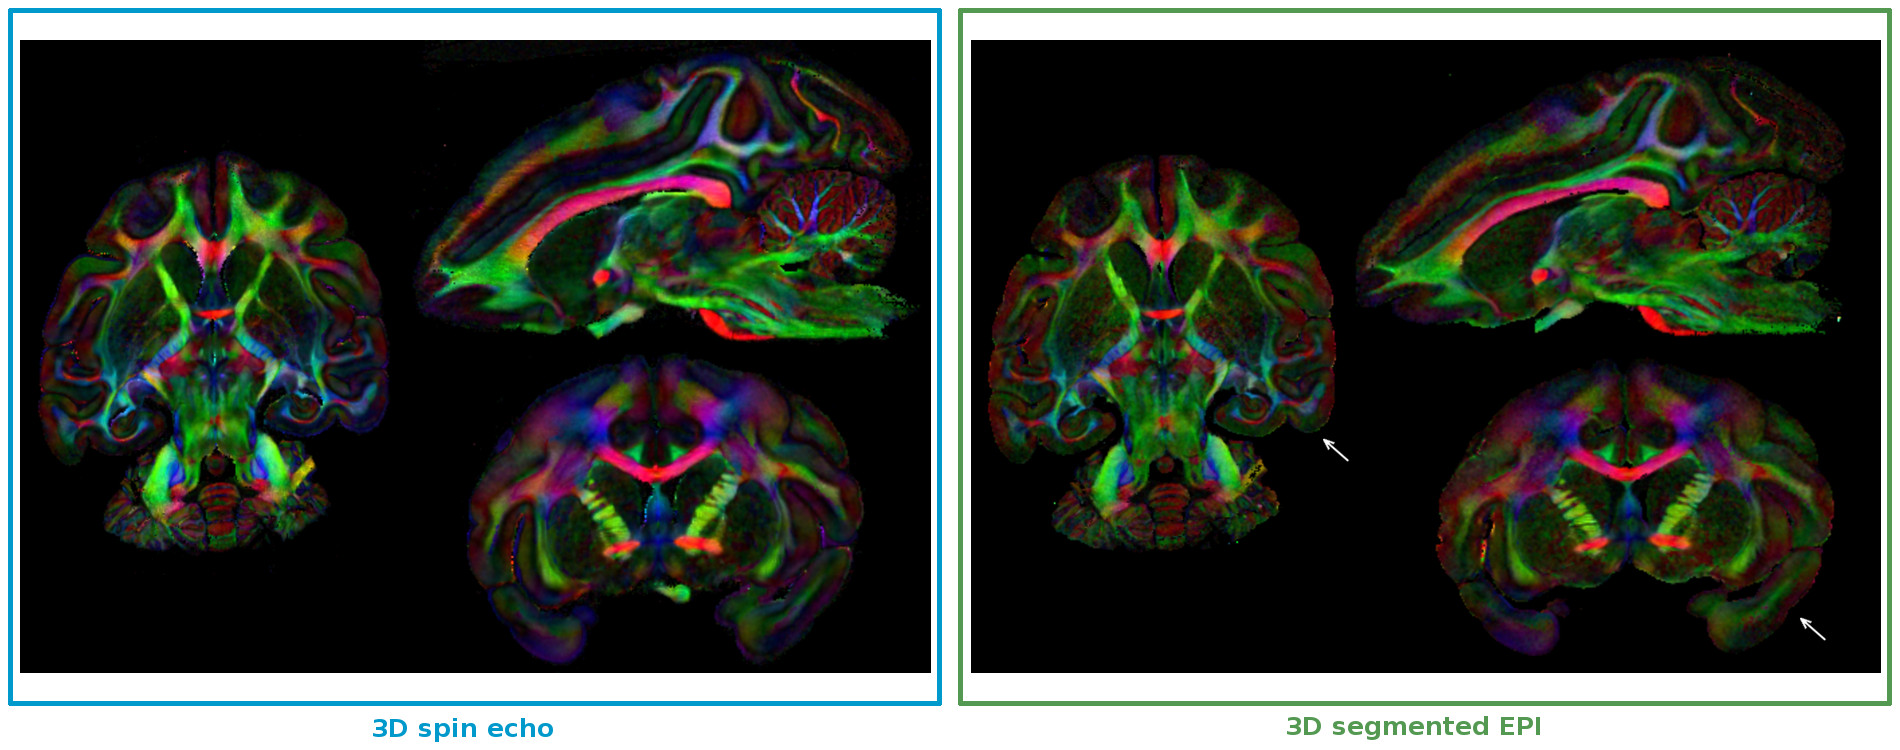
Our second comparison is an observation of the fractional anisotropy (FA) maps (Fig. 2). Overall, the anisotropy of the diffusion process is similar for both sequences even if there is small discrepancies on the brain edges (white arrows).
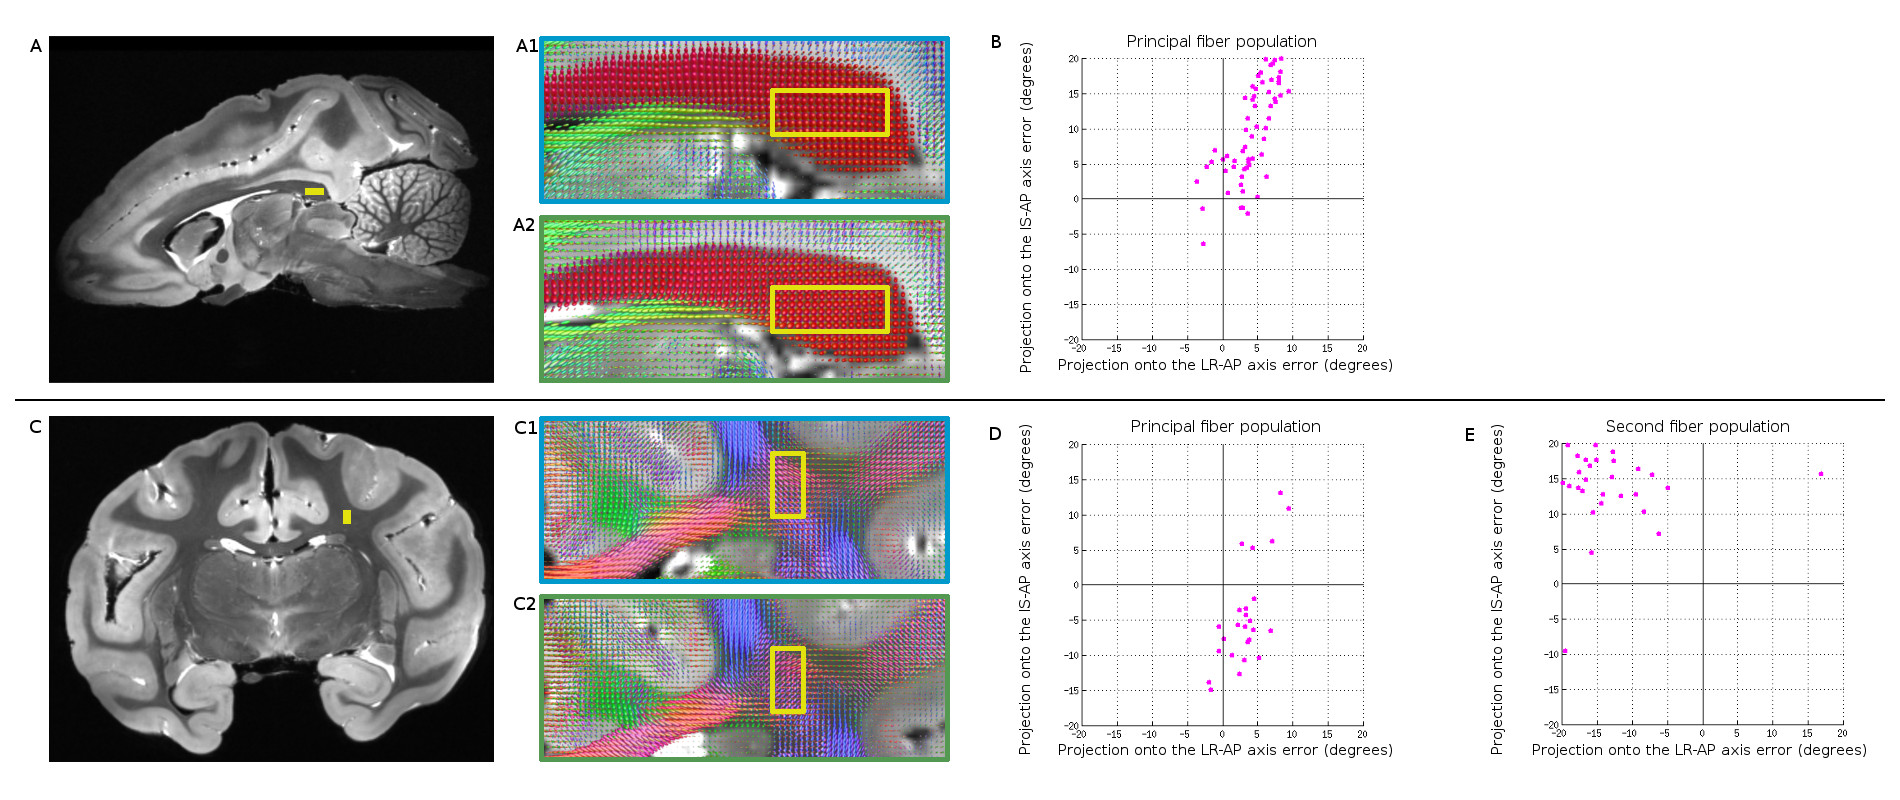
Then, we compared FOD between the two acquisitions (Fig. 3). Orientations are similar for both sequences: in simple fiber tract such as corpus callosum (3A) but also in more complex fibers tracts with crossing pathways (3B). Measure of the angle between the FOD from SE and the one from EPI gives quantitative value of the slight difference between the two sequences.
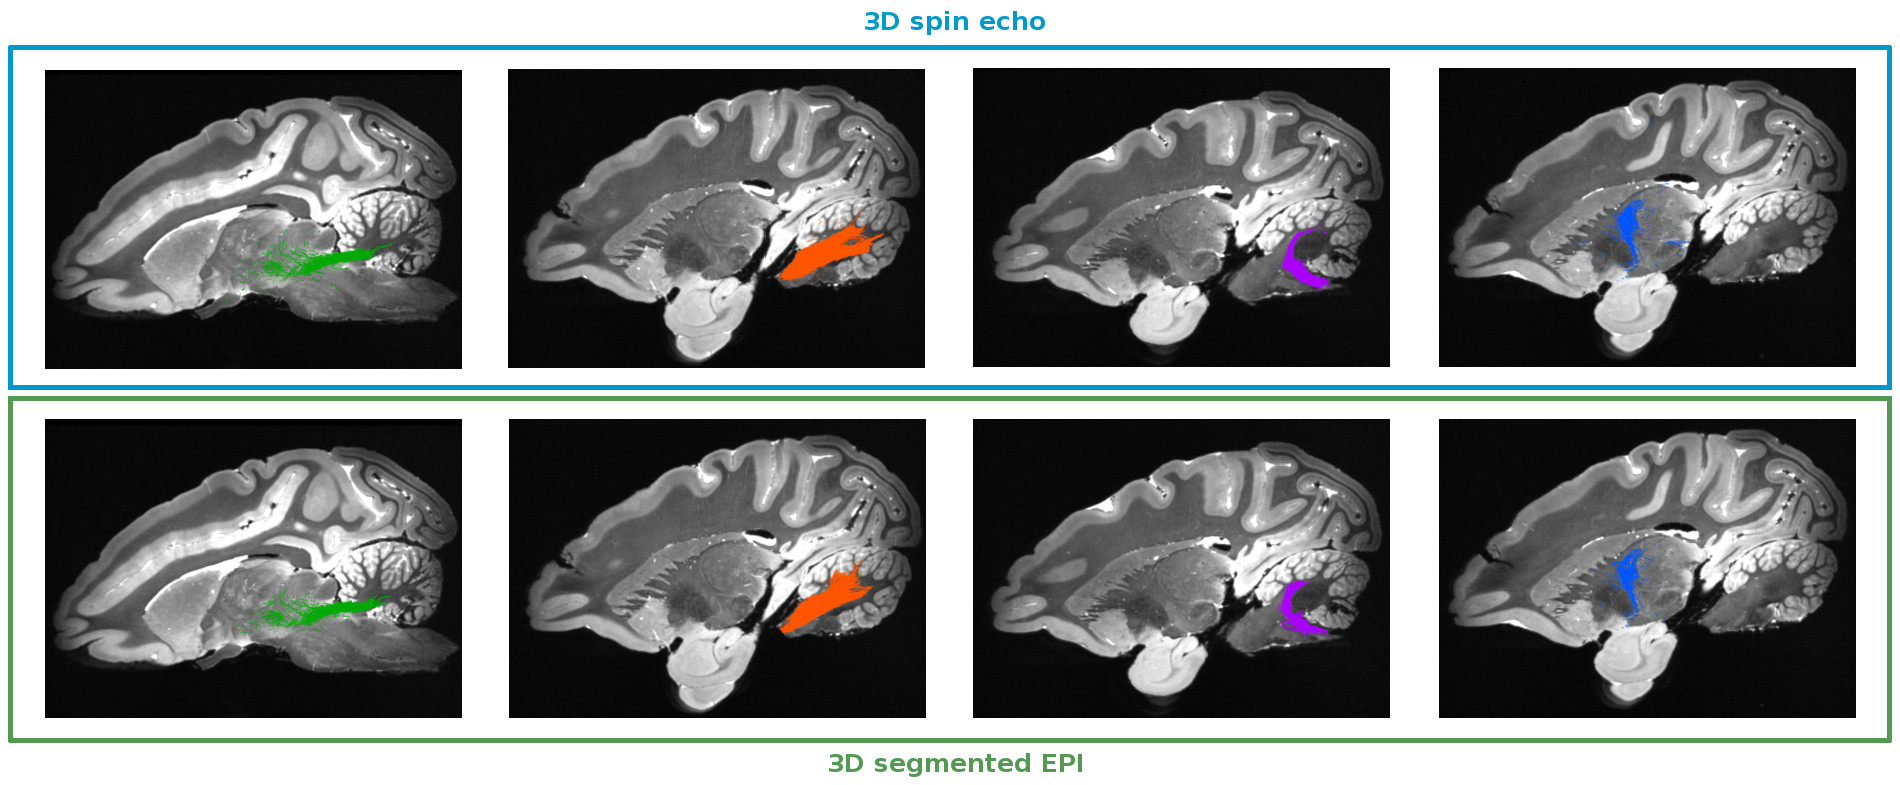
Our final comparison is the ability of reconstructing coherent fiber tracts with the two differents acquisitions (Fig. 4). We focused on four particular fiber tracts well described with more or less complex course: the superior cerebellar peduncle, the medium cerebellar peduncle, the inferior cerebellar peduncle and the pallido-thalamic tract. Tracts obtained are similar for both sequences with a slight more detailed tracts with the 3D SE.
Conclusion
Overall we believe that the 3D segmented EPI sequence, with a sufficient number of segments, is an exquisite method for in-vivo study that need tractography but also for ex-vivo study with a perspective of coupling diffusion MRI method with histology or electron microscopy for example due to shorter time of data acquisition.Acknowledgements
The research leading to these results received funding from the programs 'Institut des neurosciences translationnelle' ANR-10-IAIHU-06 and 'Infrastructure d’avenir en Biologie Santé' ANR-11-INBS-0006.
SBS has been supported by the Bettencourt Schueller Foundation and by the National Agency for Research under the program "Investissements d’avenir" ANR-10-EQPX-15.
References
1. Dhollander T, Raffelt D, Connelly A. Unsupervised 3-tissue response function estimation from single-shell or multi-shell diffusion MR data without a co-registered T1 image. ISMRM Workshop on Breaking the Barriers of Diffusion MRI, 2016, 5.
2. Smith RE, Tournier JD, Calamante E, Connelly A. SIFT: Spherical-deconvolution informed filtering of tractograms. NeuroImage. 2013;67:298-312.
Figures